. 2024 Sep 19;25(1):246.
doi: 10.1186/s13059-024-03392-7.

Recruitment of the m6A/m6Am demethylase FTO to target RNAs by the telomeric zinc finger protein ZBTB48

Affiliations

Recruitment of the m6A/m6Am demethylase FTO to target RNAs by the telomeric zinc finger protein ZBTB48

Syed Nabeel-Shah et al. Genome Biol. .

Abstract

Background: N6-methyladenosine (m6A), the most abundant internal modification on eukaryotic mRNA, and N6, 2'-O-dimethyladenosine (m6Am), are epitranscriptomic marks that function in multiple aspects of posttranscriptional regulation. Fat mass and obesity-associated protein (FTO) can remove both m6A and m6Am; however, little is known about how FTO achieves its substrate selectivity.

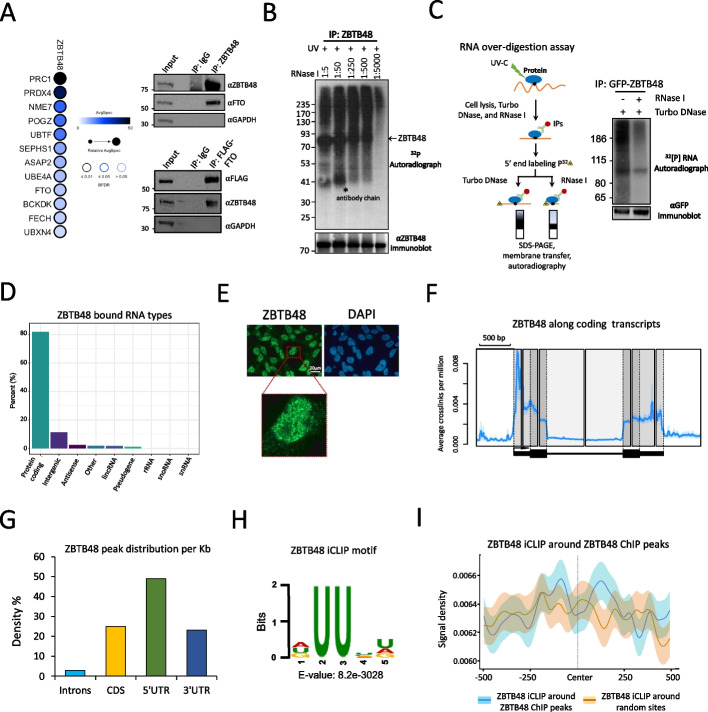
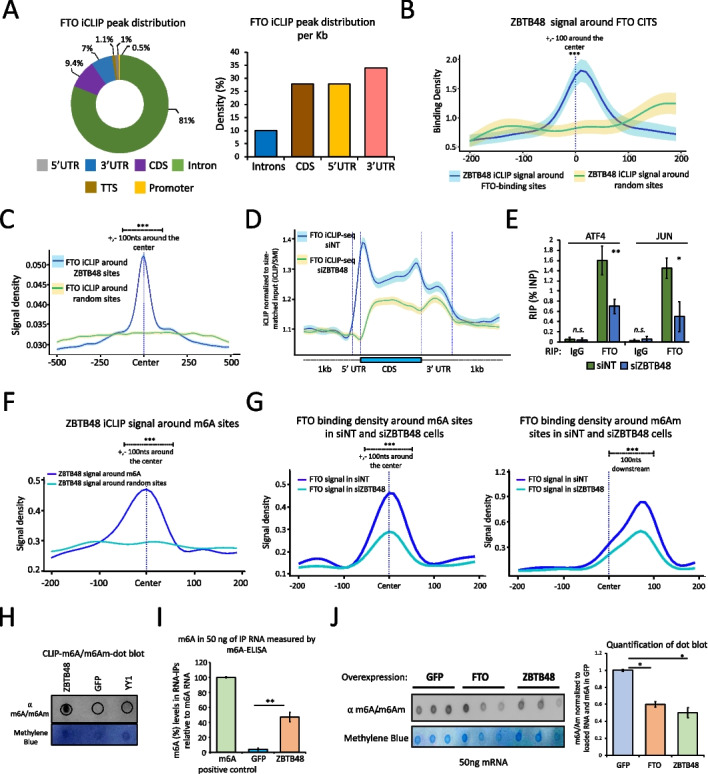
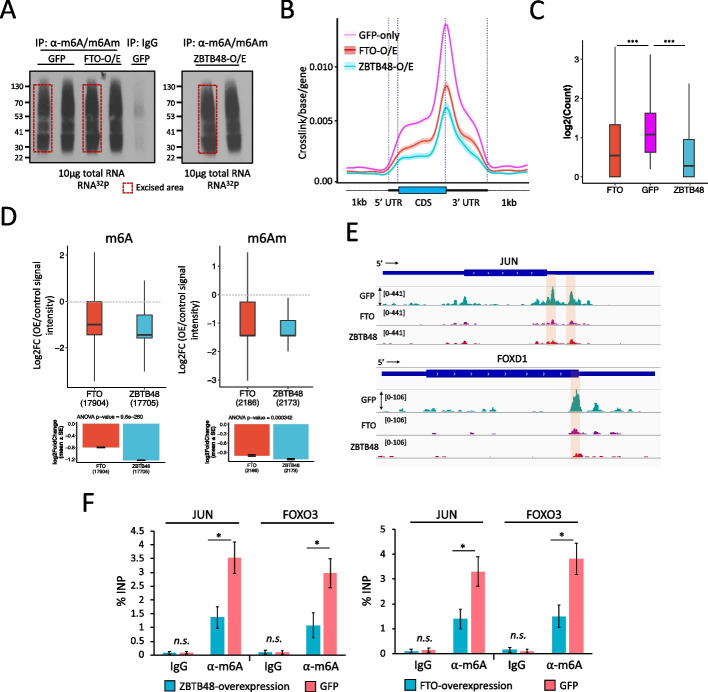
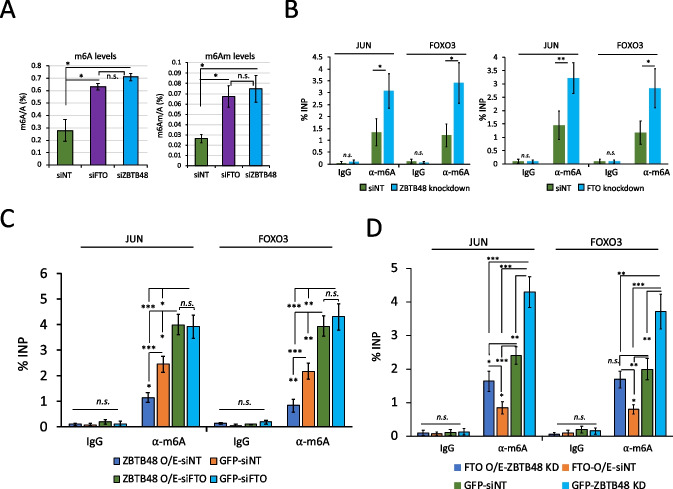
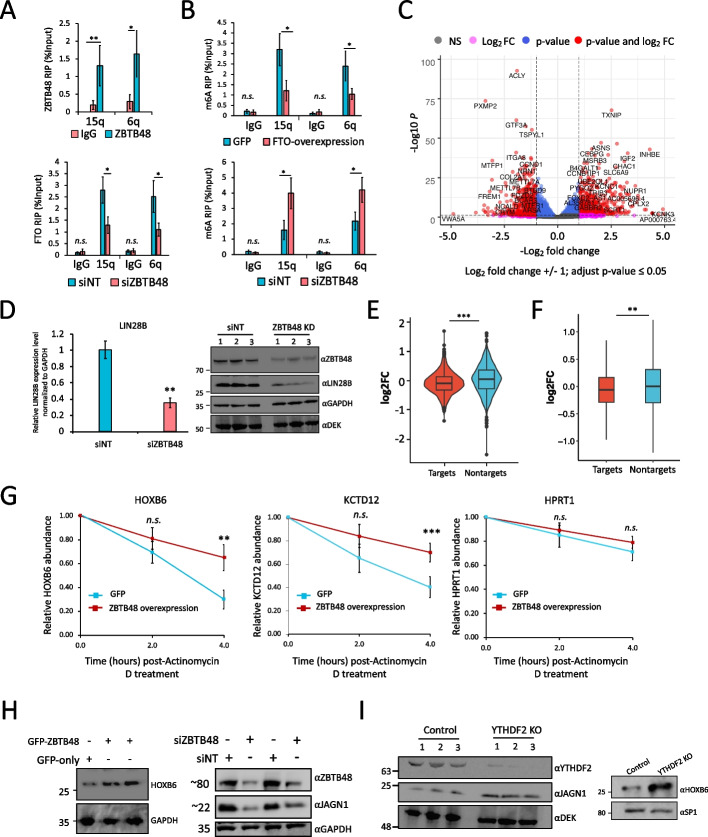
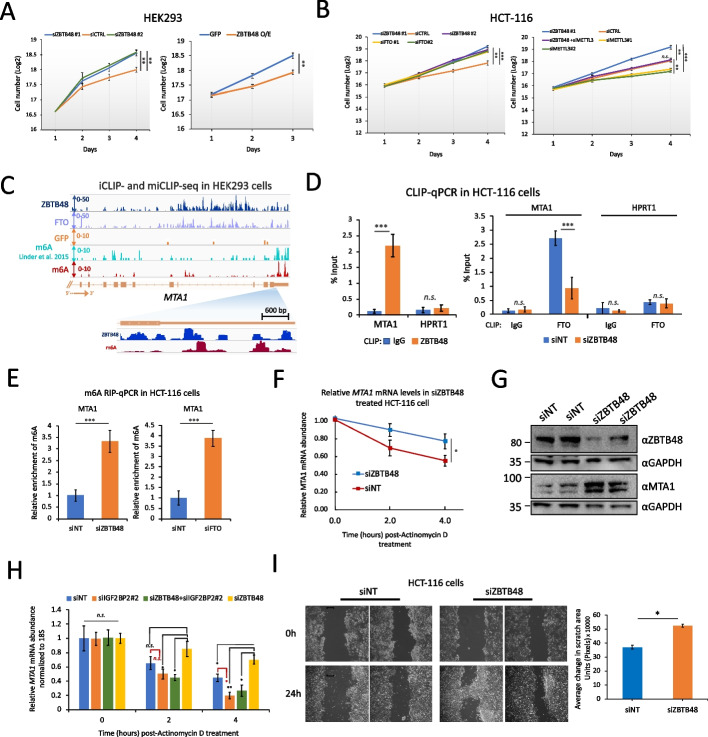
Results: Here, we demonstrate that ZBTB48, a C2H2-zinc finger protein that functions in telomere maintenance, associates with FTO and binds both mRNA and the telomere-associated regulatory RNA TERRA to regulate the functional interactions of FTO with target transcripts. Specifically, depletion of ZBTB48 affects targeting of FTO to sites of m6A/m6Am modification, changes cellular m6A/m6Am levels and, consequently, alters decay rates of target RNAs. ZBTB48 ablation also accelerates growth of HCT-116 colorectal cancer cells and modulates FTO-dependent regulation of Metastasis-associated protein 1 (MTA1) transcripts by controlling the binding to MTA1 mRNA of the m6A reader IGF2BP2.

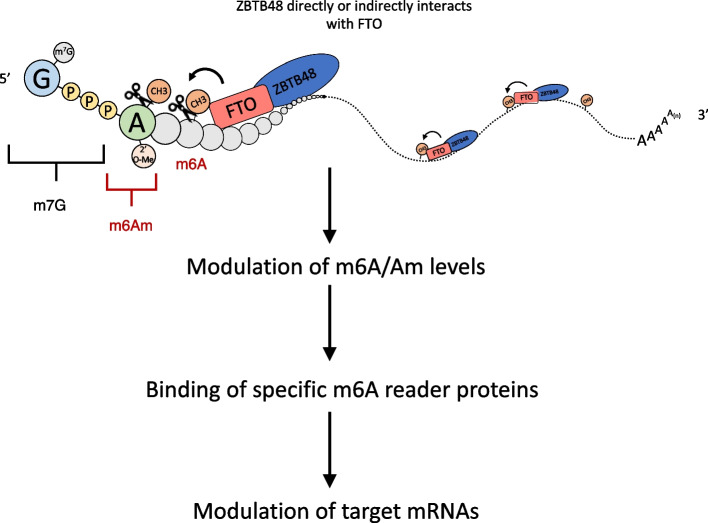
Conclusions: Our findings thus uncover a previously unknown mechanism of posttranscriptional regulation in which ZBTB48 co-ordinates RNA-binding of the m6A/m6Am demethylase FTO to control expression of its target RNAs.

Keywords: FTO; ICLIP; M6A/m6Am; MRNA modification; RNA-binding; TERRA; TZAP; Telomeres; ZBTB48.


Conflict of interest statement

The authors declare that they have no competing interests.

Figures

Fig. 1
Fig. 1
ZBTB48 interacts with FTO and binds to RNA in cells. A Left, Dot plot representation of ZBTB48 protein-protein interactions. Right, Interaction of ZBTB48 with FTO detected by co-immunoprecipitation. Cell lysates were treated with Benzonase prior to IPs. Note: The inputs and IPs were loaded twice on 4-12% Bis-Tris SDS polyacrylamide gels and probed with the indicated antibodies. B CLIP autoradiography of 32P-labeled ZBTB48-RNA complexes was performed after RNase I treatment at various dilution. The Western blot in the bottom panel shows the recovery of ZBTB48. C Left, Schematic representation of CLIP RNA over-digestion assay. Right, Autoradiograph of immunopurified 32P-labeled ZBTB48-RNA complexes after RNase I and/or DNase I over-digestion. The bottom panel Western blot indicates the recovery of GFP-ZBTB48 protein. D Bar chart representing the distribution (%) of ZBTB48-bound RNA types. E Immunofluorescence (IF) analysis to examine the localization of ZBTB48 in HEK293 cells. Experiment was performed using an anti-ZBTB48 antibody. For nuclear counterstaining, DAPI was used. F Standardized metaplot profile showing the density of ZBTB48 as average crosslinks per million. Black arrow indicates transcription start site (TSS). G Bar chart representing the distribution of ZBTB48 mRNA CITS peaks per Kb of mRNA (FDR ≤ 0.01). H Enriched sequence motif found in ZBTB48 iCLIP-seq peaks. E-value represents the significance of the motif against randomly assorted sequences. I iCLIP-seq signal density of ZBTB48 around either ZBTB48 ChIP-seq peaks or random sites. Shaded area indicates a standard error of mean (SEM). See also Additional file 1: Fig. S1, S2; Additional file 2, 3, 4: Tables S1, S2, and S3
Fig. 2
Fig. 2
RNA-binding sites of ZBTB48 and FTO coincide on target transcripts. A Left, FTO iCLIP-seq CITS distribution. Absolute numbers of peaks are used. Right, Bar chart showing the distribution of FTO iCLIP-seq peaks per Kb along mRNA. B Metagene profile showing ZBTB48 iCLIP-seq signal density around either FTO RNA-binding sites or random sites. Quantification of signal densities was performed for +/-100bp around the center (∗∗∗p ≤ 0.001, Wilcoxon (Mann-Whitney) test). Shaded area: SEM. C FTO iCLIP-seq signal density around either ZBTB48 CITS or random sites (∗∗∗p ≤ 0.001, Wilcoxon test). D Standardized metaplot profiles showing the binding density (iCLIP/size-matched input) of FTO in either siZBTB48 or siNT cells. E Bar graph showing FTO RIP-qPCR experiments after knocking down ZBTB48 (biological replicates (n) = 4, student’s t test, ∗∗p ≤ 0.01, ∗p ≤ 0.05, error bars: SEM). F ZBTB48 iCLIP-seq signal density around either m6A sites or random sites. G FTO signal density around m6A (left) or m6Am (right) sites in cells treated with either siZBTB48 or siNT. Note: For F and G, quantification of signal densities was performed for +/-100bp around the center; ∗∗∗p ≤ 0.001, Wilcoxon test. H ZBTB48 CLIP dot blot showing the enrichment of m6A/m6Am modified RNA. Top panel: anti-m6A, bottom panel: Methylene blue. I Bar plot showing the enrichment of m6A. RIP was performed using either GFP-ZBTB48 or GFP-alone cells, and RNA was analyzed using an m6A ELISA kit. Synthetic RNA containing m6A was used as a positive control (error bars: SEM, n =3, student’s t test, ∗∗p ≤ 0.01). J m6A dot blot using polyadenylated RNA purified from either GFP-alone, or ZBTB48-overexpressing, or FTO-overexpressing cells (top panel: anti-m6A, bottom panel: Methylene blue, error bars: SEM, ∗p ≤ 0.05; student’s t-test; n = 3). See also Additional file 1: Fig. S3, S4, Additional file 5: Table S4
Fig. 3
Fig. 3
ZBTB48 affects cellular m6A/m6Am levels. A Autoradiographs of 32P-labeled immunopurified (IP) anti-m6A-RNA complexes. Red boxes indicate the excised areas. B standardized metagene plots showing miCLIP-seq signal density for RNA purified from cells overexpressing GFP-alone, or GFP-ZBTB48, or GFP-FTO. C Boxplot representation of read counts for DRACH motif containing m6A sites across different samples, as indicated (Mann–Whitney test, ∗∗∗p ≤ 0.001; outliers not shown in the plot). D Box plot showing differential methylation analysis using miCLIP data generated from either GFP-ZBTB48-overexpressing or GFP-FTO-overexpressing cells versus GFP control cells. Analysis was performed with the DESeq2 package, which accounts for the read depth in each sample, using reads corresponding to internal m6A (left) and terminal m6Am (right) sites. Outliers are not shown in the box plots. Dotted lines indicate the base line signal (i.e., m6A or m6Am in GFP cells). Bottom bar plots indicate the mean values for the indicated groups along with p-values (ANOVA, post hoc Tukey HSD). E Genome browser snapshots of JUN and FOXD1 gene tracks show the location and coverage of miCLIP in GFP- or GFP-ZBTB48- or FTO-overexpressing cells. Locations of the putative m6A sites are highlighted. F Bar plots showing the m6A levels for JUN and FOXO3 transcripts estimated using m6A-RIP-qPCR on RNA purified from either ZBTB48-overexpressing or GFP-only cells (left) or from either FTO-overexpressing or GFP-only cells (right). Data are represented as % input. Note, for qPCRs: biological replicates n = 5, student’s t-test, ∗∗∗p ≤ 0.001, ∗∗p ≤ 0.01, ∗p ≤ 0.05, n.s.: non-significant, error bars denote SEM. See also Additional file 1: Fig. S5, S6; Additional file 6, 7, 8, 9: Table S5, S6, S7,S8
Fig. 4
Fig. 4
ZBTB48 knockdown increases cellular m6A/m6Am. A LC-MS/MS shows that knockdown of ZBTB48 or FTO leads to an increase in m6A/A (left) and m6Am/A (right) in total RNA in comparison with the controls (i.e., siNT). Error bars show SEM (∗p ≤ 0.05; student’s t-test). B Bar plot showing the m6A levels for JUN and FOXO3 transcripts estimated using m6A-RIP-qPCR on RNA purified from either siZBTB48- or siNT-treated cells (left) or from either siFTO- or siNT-treated cells (right). Data are represented as % input. C-D Bar plots showing the m6A levels for JUN and FOXO3 transcripts estimated using m6A-RIP-qPCR on RNA purified from cells treated in the indicated ways. Data are represented as % input. Note, qPCRs in B-D: biological replicates n = 5, student’s t-test, ∗∗∗p ≤ 0.001, ∗∗p ≤ 0.01, ∗p ≤ 0.05, n.s.: non-significant, error bars denote SEM. See also Additional file 1: Fig. S6, S7.
Fig. 5
Fig. 5
ZBTB48 knockdown alters gene expression and affects mRNA stability. A Top: RIP-qRT-PCR to examine binding of ZBTB48 to TERRA transcripts in U2OS cells. Bottom: FTO RIP-qPCR bar graph showing effects of siNT- or siZBTB48-treatment on binding of FTO to TERRA in U2OS cells. TERRA was detected using specific primers against the 15q and 6q chromosomes. B Bar plots showing the m6A levels for TERRA transcripts (15q and 6q) in U2OS cells estimated using m6A-RIP-qPCR in GFP- and FTO-overexpressing cells (top), or ZBTB48 knockdown and siNT-treated cells (bottom). Data are represented as % input. C Volcano plot representation of genes differentially expressed in ZBTB48 knockdown HEK293 cells in comparison with control siNT-treated cells. Each dot represents a single gene. Vertical dotted lines represent log2fold change of 1, and highly significant genes are shown as red dots with labels indicating some of the gene names. D left, qRT-PCR results to examine the differential expression of LIN28B in ZBTB48 knockdown cells. Right, Western blotting analysis in whole cell lysates prepared from either siZBTB48 (siZBTB48 #1 + #2) or siNT-treated cells. Blots were probed with the indicated antibodies. Note: DEK and GAPDH were used as loading controls. E Relative abundance of ZBTB48 mRNA targets (based on iCLIP-seq) and non-targets after ZBTB48 KD in HEK293 cells. Violin plots show mean log2 fold change values for the indicated groups (p ≤ 0.01 ANOVA, post hoc Tukey HSD). F: Box plot shows mean log2 fold change values for the abundance of mRNA from m6A genes (targets) and non-m6A genes (non-targets) after ZBTB48 KD in HEK293 cells (p ≤ 0.01 ANOVA, post hoc Tukey HSD; Outliers are not depicted). G qRT-PCR quantification of selected m6A-containing mRNAs targeted by ZBTB48 after treating GFP or GFP-ZBTB48 overexpressing cells with Actinomycin D for the indicated times. HPRT1 serves as negative control. H Western blotting analysis in whole cell lysates prepared from cells treated in the indicated ways. Note: ZBTB48 KD (right) was carried out using two different siRNAs, i.e., siZBTB48 #1 and #2 (the second and fourth lanes, respectively). Blots were probed with the indicated antibodies. I Western blotting analysis in whole cell lysates prepared from either YTHDF2 KO or control cells. Blots were probed with the indicated antibodies. Note: For qPCRs (including RIPs): biological replicates n = 5, student’s t-test, ∗∗∗p ≤ 0.001, ∗∗p ≤ 0.01, ∗p ≤ 0.05, n.s.: non-significant. Error bars represent SEM. See also Additional file 1: Fig. S9, S10; Additional file 10: Table S9
Fig. 6
Fig. 6
ZBTB48 inhibits cellular proliferation. A Effects of ZBTB48 KD (left) or overexpression (right) on cell proliferation in HEK293 cells (error bars denote SEM, n = 4, ∗∗p ≤ 0.01, ∗p ≤ 0.05, two-way ANOVA). Cell counts are presented as log2. B Equal numbers of HCT-116 cells were transfected with the indicated siRNAs in biological triplicates and seeded at the same time in 6-well plates. Cells were separately transfected and seeded for each time point in biological triplicates. Error bars denote SEM. ∗∗∗p ≤ 0.001, ∗∗p ≤ 0.01, ∗p ≤ 0.05 (two-way ANOVA). C Representative genome browser snapshot for MTA1 locus showing the read coverage for ZBTB48 iCLIP-seq, miCLIP-seq (GFP samples), and previously published miCLIP-seq data in HEK293 cells. D Left: CLIP-qRT-PCR to examine binding of ZBTB48 to MTA1 transcripts in HCT-116 cells. Control IPs were performed using IgG. HPRT1 was used as a negative control. Right: CLIP-qPCR to examine binding of FTO to MTA1 transcripts in siNT or siZBTB48 HCT-116 cells. Data are represented as % input. E Bar plot showing the relative m6A levels for MTA1 transcripts estimated using m6A-RIP-qPCR in ZBTB48 knockdown (left), siFTO (right), or siNT-treated HCT-116 cells. Data are represented as % input. F qRT-PCR analysis of MTA1 mRNA in siZBTB48 or siNT-treated HCT-116 cells after treating cells with Actinomycin D for the indicated times. G Western blotting analysis in whole cell lysates prepared from either ZBTB48 KD or control cells. ZBTB48 KD was carried out using two different siRNAs, i.e., siZBTB48 #1 and #2 (third and fourth lanes, respectively). Blots were probed with the indicated antibodies. H qRT-PCR analysis of MTA1 mRNA in cells treated with siNT, siZBTB48 (siRNA#2), siIGF2BP2 (siRNA#2), or a combination of siZBTB48 and siIGF2BP2. For each time point, relative transcript levels were normalized to 18S rRNA and time point “0”. I Wound healing assay using ZBTB48-knockdown or control cells was recorded and quantitatively analyzed (right) (∗p ≤ 0.05, two-way ANOVA). Note: For all qPCR experiments: at least 3 biological replicates, student’s t-test, ∗∗∗p ≤ 0.001, ∗∗p ≤ 0.01, ∗p ≤ 0.05, n.s.: non-significant, error bars denote SEM. See also Additional file 1: Fig. S11 and S12.
Fig. 7
Fig. 7
Proposed model for ZBTB48-mediated regulation of m6A/m6Am. ZBTB48 binds to RNA in the vicinity of m6A/m6Am and recruits FTO through either a direct or indirect interaction with it

References

    1. Zhao BS, Roundtree IA, He C. Post-transcriptional gene regulation by mRNA modifications. Nat Rev Mol Cell Biol. 2017;18:31–42. - PMC - PubMed
    1. Roundtree IA, Evans ME, Pan T, He C. Dynamic RNA Modifications in Gene Expression Regulation. Cell. Cell Press; 2017. p. 1187–200. - PMC - PubMed
    1. Zhao BS, Wang X, Beadell A V., Lu Z, Shi H, Kuuspalu A, et al. m6A-dependent maternal mRNA clearance facilitates zebrafish maternal-to-zygotic transition. Nature. 2017;542:7642. 2017;542:475–8. - PMC - PubMed
    1. Chen T, Hao YJ, Zhang Y, Li MM, Wang M, Han W, et al. m(6)A RNA methylation is regulated by microRNAs and promotes reprogramming to pluripotency. Cell Stem Cell. 2015;16:289–301. - PubMed
    1. Zhao X, Yang Y, Sun BF, Shi Y, Yang X, Xiao W, et al. FTO-dependent demethylation of N6-methyladenosine regulates mRNA splicing and is required for adipogenesis. Cell Res. 2014;24:1403. - PMC - PubMed

MeSH terms