

The differential effects of dyslipidemia status and triglyceride-glucose index on left ventricular global function and myocardial microcirculation in diabetic individuals: a cardiac magnetic resonance study
- PMID: 39300497
- PMCID: PMC11412031
- DOI: 10.1186/s12933-024-02435-4
The differential effects of dyslipidemia status and triglyceride-glucose index on left ventricular global function and myocardial microcirculation in diabetic individuals: a cardiac magnetic resonance study
Abstract
Background: It remains unclear whether the association between dyslipidemia status and triglyceride-glucose (TyG) index with myocardial damage varies in the context of type 2 diabetes mellitus (T2DM). This study aimed to determine the differential effects of dyslipidemia status and TyG index on left ventricular (LV) global function and myocardial microcirculation in patients with T2DM using cardiac magnetic resonance (CMR) imaging.
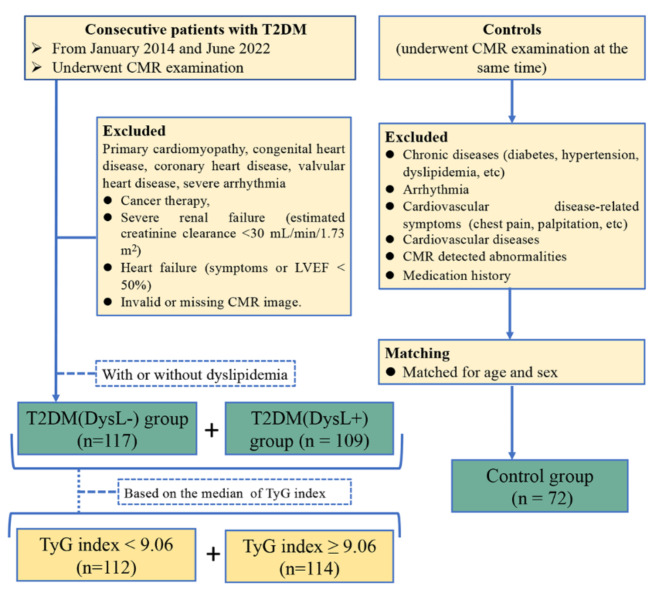
Methods: A total of 226 T2DM patients and 72 controls who underwent CMR examination were included. The T2DM group was further categorized into subgroups based on the presence or absence of dyslipidemia (referred to as T2DM (DysL+) and T2DM (DysL-)) or whether the TyG index exceeded 9.06. CMR-derived LV perfusion parameters, remodeling index, and global function index (GFI) were assessed and compared among groups. A multivariable linear regression model was employed to evaluate the effects of various variables on LV myocardial microcirculation, remodeling index, and GFI.
Results: The LV GFI sequentially decreased in controls, T2DM (DysL-), and T2DM (DysL+) groups (p < 0.001), and was lower (p = 0.003) in T2DM with higher TyG index group than in lower TyG index group. The LV remodeling index was higher in higher TyG index group than in lower TyG index group (p = 0.002), but there was no significant difference in whether the subgroup was accompanied by dyslipidemia. Multivariable analysis revealed that the TyG index, but not dyslipidemia status, was independently associated with LV remodeling index (β coefficient[95% confidence interval], 0.152[0.025, 0.268], p = 0.007) and LV GFI (- 0.159[- 0.281, - 0.032], p = 0.014). For LV myocardial microcirculation, perfusion index, upslope, and max signal intensity sequentially decreased in controls, T2DM (DysL-), and T2DM (DysL+) groups (all p < 0.001). Dyslipidemia status independently correlated with perfusion index (- 0.147[- 0.272, - 0.024], p = 0.02) and upslope (- 0.200[- 0.320, 0.083], p = 0.001), while TyG index was independently correlated with time to maximum signal intensity (0.141[0.019, 0.257], p = 0.023).
Conclusions: Both dyslipidemia status and higher TyG index were associated with further deterioration of LV global function and myocardial microvascular function in the context of T2DM. The effects of dyslipidemia and a higher TyG index appear to be differential, which indicates that not only the amount of blood lipids and glucose but also the quality of blood lipids are therapeutic targets for preventing further myocardial damage.
Keywords: Dyslipidemia status; Global function index; Myocardial microcirculation; Remodeling index; Triglyceride-glucose index; Type 2 diabetes mellitus.
© 2024. The Author(s).
Conflict of interest statement
The authors declare no competing interests.
Figures


References
-
- Marx N, Federici M, Schütt K, Müller-Wieland D, Ajjan RA, Antunes MJ, et al. 2023 ESC guidelines for the management of cardiovascular disease in patients with diabetes. Eur Heart J. 2023;44(39):4043–140. - PubMed
-
- Dake AW, Sora ND. Diabetic dyslipidemia review: an update on current concepts and management guidelines of diabetic dyslipidemia. Am J Med Sci. 2016;351(4):361–5. - PubMed
-
- Adiels M, Olofsson SO, Taskinen MR, Borén J. Diabetic dyslipidaemia. Curr Opin Lipidol. 2006;17(3):238–46. - PubMed
Publication types
MeSH terms
Substances
Grants and funding
- 82202115/National Natural Science Foundation of China
- 82120108015/National Natural Science Foundation of China
- 82371925/National Natural Science Foundation of China
- 2023NSFSC1725/Sichuan Provincial Science and Technology Support Program
- 2023ZYD0100/Sichuan Provincial Science and Technology Support Program
LinkOut - more resources
Full Text Sources
Medical
