. 2025 Mar 6;148(3):845-860.
doi: 10.1093/brain/awae291.

Clinical-grade intranasal NGF fuels neurological and metabolic functions of Mecp2-deficient mice

Affiliations

Clinical-grade intranasal NGF fuels neurological and metabolic functions of Mecp2-deficient mice

Diego Pozzer et al. Brain. .

Abstract

MECP2 deficiency causes a broad spectrum of neuropsychiatric disorders that can affect both genders. Rett syndrome is the most common and is characterized by an apparently normal growth period followed by a regression phase in which patients lose most of their previously acquired skills. After this dramatic period, various symptoms progressively appear, including severe intellectual disability, epilepsy, apraxia, breathing abnormalities and motor deterioration. MECP2 encodes for an epigenetic transcription factor that is particularly abundant in the brain; consequently, several transcriptional defects characterize the Rett syndrome brain. The well-known deficiency of several neurotrophins and growth factors, together with the positive effects exerted by trofinetide, a synthetic analogue of insulin-like growth factor 1, in Rett patients and in mouse models of Mecp2 deficiency, prompted us to investigate the therapeutic potential of nerve growth factor. Initial in vitro studies demonstrated a healing effect of recombinant human GMP-grade NGF (rhNGF) on neuronal maturation and activity in cultured Mecp2-null neurons. Subsequently, we designed in vivo studies with clear translational potential using intranasally administered rhNGF already used in the clinic. The efficacy of rhNGF in vivo in Mecp2-null hemizygous male mice and heterozygous female mice was assessed. General well-being was evaluated by a conventional phenotypic score and motor performance through the Pole and Beam Walking tests, while cognitive function and interaction with the environment were measured by the Novel Object Recognition test and the Marble Burying test, respectively. At the end of the treatment, mouse cortices were dissected and bulk RNA sequencing was performed to identify the molecular pathways involved in the protective effects of rhNGF. In both male and female mouse models of Rett syndrome, rhNGF exerted positive effects on cognitive and motor functions. In male hemizygous mice, which suffer from significantly more severe and rapidly advancing symptoms, the drug's ability to slow the disease's progression was more pronounced. The unbiased research for the molecular mechanisms triggering the observed benefits revealed a strong positive effect on gene sets related to oxidative phosphorylation, mitochondrial structure and function. These results were validated by demonstrating the drug's ability to improve mitochondrial structure and respiration in Mecp2-null cerebral cortices. Furthermore, Gene Ontology analyses indicated that NGF exerted the expected improvement in neuronal maturation. We conclude that intranasal administration of rhNGF is a non-invasive and effective route of administration for the treatment of Rett syndrome and possibly for other neurometabolic disorders with overt mitochondrial dysfunction.

Keywords: Mecp2 null mice; Rett syndrome; animal behaviour; cognitive function; mitochondrial dysfunction; rhNGF.


Conflict of interest statement

The authors report no competing interests.

Figures

Figure 1
Figure 1
Recombinant human NGF in vitro treatment restores defects of synaptic density and calcium response in knockout primary cortical neurons. (A) Representative images of immunostainings for Synapsin 1/2 (green) and Shank2 (red) and merged with Map2 (white) of wild-type (WT) and knockout (KO) neurons at 14 days in vitro (DIV14) treated from DIV12 to DIV14 with vehicle [phosphate buffered saline (pbs)] or recombinant human NGF (rhNGF) (25 ng/ml). Scale bars = 30 μm and 5 μm at the corresponding magnifications. (B) The violin plots indicate the median (dashed line) and 25th and 75th percentiles (dotted lines) of the density of presynaptic (Synapsin1/2 positive) and postsynaptic (Shank2 positive) puncta for each experimental group. **P < 0.01, ***P < 0.001, ****P < 0.0001 by two-way ANOVA, followed by Sidak’s post hoc test. Analyses were performed on n > 50 neurons per experimental group, from n = 2–3 biological replicates and two independent experiments. (C) The bar graphs depict the analysis of intracellular calcium transients upon NMDA stimulation. ****P < 0.0001 by Kruskal–Wallis test, followed by Dunn’s post hoc test. Values are expressed as percentages of WT + pbs group, set as 100%, and represented as mean ± standard error of the mean. Analyses were performed on n > 800 neurons per experimental group, from n = 3 biological replicates and three independent experiments.
Figure 2
Figure 2
Recombinant human NGF spreads across brain areas after intracerebroventricular injection and enters CNS after intranasal administration. (A) Graphical representation of the unilateral intracerebroventricular (ICV) injection of recombinant human NGF (rhNGF) or vehicle into the right ventricle (10 μl of 270 ng/µl solution). (B and C) Graphs report the NGF concentration in the ipsilateral and contralateral hippocampus (B) and prefrontal cortex (C) at different time points (1, 4, 24 and 48 h) after ICV administration of rhNGF in wild-type (WT) adult mice. Data are mean ± standard error of the mean (SEM). *P < 0.05, $$P < 0.01, **** or $$$$P < 0.0001; two-way ANOVA followed by Dunnett’s post hoc test. Data are compared to vehicle-treated mice. n = 3–5. (D) Bar graphs depicts the concentration of NGF in hippocampus 1, 6, 18, 24 and 48 h after ICV injection of rhNGF in adult WT and knockout (KO) animals. *P < 0.05, **** or $$$$P < 0.0001; two-way ANOVA followed by Dunnett’s post hoc test. Data are compared to vehicle-treated mice (‘0’ groups). n = 3–5/experimental group. (E) Graphical representation of the intranasal (IN) injection of rhNGF (20 μl of 2.1 mg/ml solution) or vehicle. (F) Bar graph depicts the concentration of NGF detected in the cortex 3, 6 or 16 h after a single administration of the drug in adult WT animals. Control animals that received buffer solution were euthanized after 3 h. Data are mean ± SEM *P < 0.05; one-way ANOVA followed by Tukey’s post hoc test. n = 5–10/experimental group. pbs = phosphate-buffered saline.
Figure 3
Figure 3
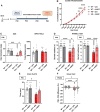
Recombinant human NGF treatment improves behavioural defects in Mecp2 knockout animals. (A) Graphical representation of the treatment paradigm. Daily intranasal administration of recombinant human NGF (rhNGF) (20 μl of 2.1 mg/ml solution) started at postnatal Day (P)30 and ended at P60. Wild-type (WT) and knockout (KO) male animals were treated with rhNGF or phosphate-buffered saline (pbs). (B) Graph represents the cumulative phenotypic score calculated from P30 to P59. Data are presented as mean ± standard error of the mean (SEM). Reported statistical differences refer to KO + pbs versus KO + rhNGF comparison. *P < 0.05, ** P < 0.01, ****P < 0.0001; two-way ANOVA, followed by Tukey’s post hoc test. n = 31–33/experimental group (only for WT groups, n = 12–13). (C) Bar graph shows the results of the Novel Object Recognition test (NOR, left) and Open Field test (OF, right), performed at P48 and P47, respectively. Discrimination index related to different objects is reported. Data are presented as mean ± SEM. *P < 0.05, ***P < 0.001; two-way ANOVA, followed by Tukey’s post hoc test. n = 9–13/experimental group (three outliers). (D) Bar graphs show the results of the Marble Burying test performed 10 days (P40) and 25 days (P55) after the start of the treatment. Data indicate the number of marbles buried in 30 min. Data are presented as mean ± SEM. *P < 0.05, ****P < 0.0001; two-way ANOVA, followed by Tukey’s post hoc test. n = 20/experimental group. (E) Bar graph shows thermal sensitivity assessed in WT and KO animals 22 days after the start of the treatment (P52). Data are presented as mean ± SEM. *P < 0.05; two-way ANOVA, followed by Tukey’s post hoc test. n = 9–13 per experimental group. (F) Graph shows the result of the Pole test, indicated as the difference in performance between the baseline condition at P30 and that shown 20 days after the start of treatment (P50). Data are presented as mean ± SEM. *P < 0.05, ****P < 0.0001; two-way ANOVA, followed by Tukey’s post hoc test. n = 30–32/experimental group (one outlier).
Figure 4
Figure 4
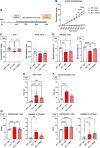
Early treatment slightly modifies the beneficial effects of recombinant human NGF. (A) Graphical representation of the treatment paradigm. Daily intranasal administration of recombinant human NGF (rhNGF) (20 μl of 2.1 mg/ml solution) started at postnatal Day (P)20 and ended at P50. Wild-type (WT) and knockout (KO) male animals were treated with rhNGF or phosphate-buffered saline (pbs). (B) Graph shows the progression of the cumulative phenotypic score from P20 to P51. Data are presented as mean ± standard error of the mean (SEM). Reported statistical differences refer to KO + pbs versus KO + rhNGF comparison. n = 9–10/experimental group. *P < 0.05, ***P < 0.001; two-way ANOVA, followed by Tukey’s post hoc test. (C) Bar graph shows the results of the Novel Object Recognition (NOR) and Open Field (OF) tests performed at P40 and P39, respectively. Discrimination index related to different objects is reported. Data are presented as mean ± SEM. **P < 0.01, $P = 0.0981; one-way ANOVA followed by Tukey’s post hoc test. n = 20–21/experimental group (four outliers for NOR/OF tests). (D) Bar graphs show the number of marbles buried in 30 min by the animals, tested after 10 (P30) and 30 days (P50) of treatment. Data are presented as mean ± SEM. *P < 0.05, **P < 0.01, ****P < 0.0001; one-way ANOVA followed by Tukey’s post hoc test. n = 11/experimental group. (E) Bar graph show the performances of the mice in the Pole test at the end of the treatment (P50). Data are presented as mean ± SEM. **P < 0.01, ***P < 0.001, ****P < 0.0001; one-way ANOVA followed by Tukey’s post hoc test. n = 20–21/experimental group. (F) Bar graph reports the results of the Beam Walking test, performed after 25 days of treatment (P45). Data are presented as mean ± SEM. ***P < 0.001 by one-way ANOVA followed by Tukey’s post hoc test. n = 9–10/experimental group. (G) Bar graphs report Inspiratory time and number of apnoeas, measured with a whole-body pletismograph at P30 (10 days after the start of the treatment) and P44 (24 days after the start of the treatment). Data are presented as mean ± SEM. *P < 0.05, **P < 0.01, ****P < 0.0001; one-way ANOVA, followed by Tukey’s post hoc test. n = 12/experimental group (two outliers at P30 for number of apnoeas, two outliers at P44 for both parameters analysed).
Figure 5
Figure 5
Recombinant human NGF treatment exerts positive effects in Mecp2 heterozygous animals. (A) Graphical representation of the treatment paradigm. Daily intranasal administration of recombinant human NGF (rhNGF) (20 μl of 2.1 mg/ml solution) started at postnatal Day (P)60 and ended at P110. Wild-type (WT) and heterozygous (HET) animals were treated with rhNGF or phosphate-buffered saline (pbs). (B) Graph shows the progression of the cumulative phenotypic score from P60 to P109. Data are presented as mean ± standard error of the mean (SEM). by two-way ANOVA, followed by Tukey’s post hoc test did not report any statistical difference. n = 22–23/experimental group. (C) Heat maps represent the evolution of the parameters that make up the cumulative phenotypic score; the darker the shade, the worse the parameter. n = 22–23/experimental group. (D) Bar graph shows the results of the Novel Object Recognition (NOR) and Open Field (OF) tests performed at P80 and P79, respectively. Data are presented as mean ± SEM. *P < 0.05, by two-way ANOVA, followed by Sidak’s post hoc test. n = 22–23/experimental group (one outlier for the OF test). (E) Graph reports the results of the Beam Walking test performed at P90, 30 days after the start of the treatment. Data are presented as mean ± SEM. **P < 0.01; two-way ANOVA, followed by Sidak’s post hoc test. n = 22–23/experimental group (three outliers).
Figure 6
Figure 6
Recombinant human NGF treatment reverts alteration of pathways linked to neuronal development in Mecp2 knockout cortices. (A) Gene Ontology-Biological Processes (GO-BP) terms identified by over-representation enrichment analysis of differentially expressed genes (DEGs) with Padj < 0.05 in knockout (KO) + phosphate-buffered saline (pbs) versus wild-type (WT) + pbs. GO-BP terms were ranked according to increasing adjusted P-values, and the top 40 are shown, represented by the number of genes belonging to each indicated GO-BP term. (BE) Expression variations (log2-transformed fold-changes, LFC) of the enriched genes belonging to the GO-BP terms ‘axonogenesis’, ‘synapse organization’, ‘positive regulation of neuron projection development’ and ‘oxidative phosphorylation’ in the comparisons KO versus WT and KO + recombinant human NGF (rhNGF) versus KO, after filtering for absolute LFC > 0.3. (F) Gene Set Enrichment Analysis (GSEA) plots of relevant GO term gene set: GO-BP (Biological Processes) Oxidative Phosphorylation and GO-CC (Cellular Component) Inner Mitochondrial Membrane Protein Complex and Respiration Chain Complex. The normalized enrichment score (NES) and significance of enrichment (q-value) are reported for each GO gene set. RES = running enrichment score.
Figure 7
Figure 7
Recombinant human NGF improves mitochondrial function and structure in Mecp2 knockout cortices. (A) Analysis of ATP production in freshly isolated mitochondria from cortices of wild-type (WT) and knockout (KO) male mice (P60) treated or not with recombinant human NGF (rhNGF) from P30 to P60 and stimulated with pyruvate/malate (PM respiration) or glutamate/malate (GM respiration). Data are presented as mean ± standard error of the mean (SEM). *P < 0.05 by one-way ANOVA followed by Tukey’s post hoc test. n = 3–10 for each experimental group. (B) Quantification of the area of mitochondria. Data are presented as mean ± SEM. ****P < 0.0001 by Kruskal–Wallis test followed by Dunn’s post hoc test. n = 80–100 mitochondria for each experimental group (from two biological replicates). (C) Representative images of the different scores given to mitochondrial cristae. The higher the score, the worse the integrity. (D) The bar graph depicts the score of the mitochondrial cristae. Data are presented as mean ± SEM. *P < 0.05, ****P < 0.0001 by Kruskal–Wallis test followed by Dunn’s post hoc test. n = 80–100 mitochondria for each experimental group (from two biological replicates). pbs = phosphate-buffered saline.

References

    1. Frasca A, Kilstrup-Nielsen C, Landsberger N. Rett syndrome: From the involved gene(s) to treatment. In: Zigmond MJ, Wiley CA, Chesselet M-F, eds. Neurobiology of brain disorders. 2nd edn. Academic Press; 2023:89–113.
    1. Chahrour M, Zoghbi HY. The story of Rett syndrome: From clinic to neurobiology. Neuron. 2007;56:422–437. - PubMed
    1. Tarquinio DC, Hou W, Neul JL, et al. The changing face of survival in Rett syndrome and MECP2-related disorders. Pediatr Neurol. 2015;53:402–411. - PMC - PubMed
    1. Neul JL, Benke TA, Marsh ED, et al. The array of clinical phenotypes of males with mutations in Methyl-CpG binding protein 2. Am J Med Genet B Neuropsychiatr Genet. 2019;180:55–67. - PMC - PubMed
    1. Guy J, Hendrich B, Holmes M, Martin JE, Bird A. A mouse Mecp2-null mutation causes neurological symptoms that mimic Rett syndrome. Nat Genet. 2001;27:322–326. - PubMed