. 2024 Sep;13(18):e70240.
doi: 10.1002/cam4.70240.

Targeting the cancer cells and cancer-associated fibroblasts with next-generation FGFR inhibitors in prostate cancer co-culture models

Affiliations

Targeting the cancer cells and cancer-associated fibroblasts with next-generation FGFR inhibitors in prostate cancer co-culture models

Syeda Afshan et al. Cancer Med. 2024 Sep.

Abstract

Background: Inhibition of androgen receptor (AR) signaling is the main treatment strategy in advanced prostate cancer (PCa). A subset of castration resistant prostate cancer (CRPC) bypasses the AR blockade by increased fibroblast growth factor receptor (FGFR) signaling. The first- and second-generation, non-covalent FGFR inhibitors (FGFRis) have largely failed in the clinical trials against PCa.

Purpose: In this study, we tested the drug sensitivity of LNCaP, VCaP, and CWR-R1PCa cell lines to second-generation, covalent FGFRis (FIIN1, FIIN2) and a novel FGFR downstream molecule inhibitor (FRS2αi).

Methods: 2D and 3D mono- and co-cultures of cancer cells, and cancer-associated fibroblasts (CAFs) were used to mimic tumor-stroma interactions in the extracellular matrix (ECM). The treatment responses of the FGFR signaling molecules, the viability and proliferation of cancer cells, and CAFs were determined through immunoblotting, migration assay, cell viability assay, and real-time imaging. Immunofluorescent and confocal microscopy images of control and treated cultures of cancer cells and CAFs, and their morphometric data were deduced.

Results: The FGFRis were more effective in mono-cultures of the cancer cells compared with co-cultures with CAFs. The FRS2αi was specifically effective in co-cultures with CAFs but was not cytotoxic to CAF mono-cultures as in the case of FIIN1 and FIIN2. At the molecular level, FRS2αi decreased p-FRS2α, p-ERK1/2, and activated apoptosis as monitored by cleaved caspase-3 activity in a concentration-dependent manner in the co-cultures. We observed no synergistic drug efficacy in the combination treatment of the FGFRi with ARi, enzalutamide, and darolutamide. The FRS2αi treatment led to a decrease in proliferation of cancer cell clusters in co-cultures as indicated by their reduced size and Ki67 expression.

Conclusions: CAFs exert a protective effect on cancer cells and should be included in the in vitro models to make them physiologically more relevant in screening and testing of FGFRis. The FRS2αi was the most potent agent in reducing the viability and proliferation of the 3D organotypic co-cultures, mainly by disrupting the contact between CAFs and cancer cell clusters. The next-generation FGFRi, FRS2αi, may be a better alternative treatment option for overcoming ARi treatment resistance in advanced PCa.

Keywords: AR antagonist; FGFR inhibitors; FRS2α inhibitor; cancer‐associated fibroblasts; castration resistant prostate cancer; darolutamide; enzalutamide.


Conflict of interest statement

The authors declare that they have no conflicts of interest.

Figures
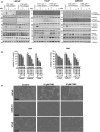
FIGURE 1
FIGURE 1
The effects of second‐generation pan‐FGFRi, FIIN1, and FIIN2 on FGFR signaling in PCa cells. (A) Immunoblot analysis of FGFR pathway activation of serum‐starved LNCaP, VCaP, and CWR‐R1 cells treated with FGF2 for 15 min in the presence or absence of FIIN1 and FIIN2 at indicated concentrations and control sample being 0.1% DMSO. Total FRS2α and ERK1/2 protein were used as controls for phospho‐specific antibodies, and α‐tubulin as a loading control. (B) A biochemical end‐point assay (Cell Titre Glo 2.0) to determine the dose–response of treatment effects. Statistical significance of n = 3 replicas was calculated using one‐way ANOVA, combined with Dunnett's test with untreated control as reference (*p < 0.05, **p < 0.01, ***p < 0.001, ****p < 0.0001). (C) Visualization of treatment effect by phase‐contrast microscopy imaging of treated and its control cultures at the endpoint after 72 h treatment with FIIN1 and FIIN2 inhibitors. The scale bar is as mentioned in the image.
FIGURE 2
FIGURE 2
Reduction of cell viability (in percentage, compared to control) and morphologic effects as the result of FGFRi (FIIN1, FIIN2) exposure in adherent 2D monolayer versus matrix‐embedded 3D organotypic cultures with or without CAFs (green fluorescence). The treatment was done for 3 days in 2D cultures and 6 days in 3D cultures in three replicas. (A) The drug sensitivity of LNCaP cells quantitated in 2D mono‐culture and co‐culture with CAFs, as measured by Cell Titre Glo metabolic assay. Similarly, (B) the viability of LNCaP cells in 3D mono‐ versus co‐culture with CAFs. Statistical significance of n = 3 replicas was calculated using one‐way ANOVA, combined with Dunnett's test with respective untreated control as reference in each model system (*p < 0.05, **p < 0.01, ***p < 0.001, ****p < 0.0001). (C) Representative phase‐contrast images of LNCaP 2D cultures with or without GFP‐tagged CAFs. Scale bars 100 μm. (D) In parallel, LNCaP cells were cultured in 3D organotypic conditions, using mixed Matrigel/collagen type I gels. Representative images of 3D mono‐ and co‐cultures of LNCaP with CAFs expressing GFP are shown. Scalebars 200 μm. (E) Spinning disk confocal microscopy images with 40× objective labeled by immunofluorescence with an antibody against α‐smooth muscle actin (α‐actin, green), which serves as a marker of cancer‐associated fibroblasts (indicated with arrows), epithelial cell marker (cytokeratin 8 + 18, red), and nuclear counterstain (Draq5, blue). Scale bars 100 μm.
FIGURE 3
FIGURE 3
The FRS2αi blocks cancer cells and CAFs growth in a dose‐dependent manner in the PCa co‐cultures of LNCaP, VCaP, and CWR‐R1. (A, C, E) Time course effects of FRS2αi treatment on proliferation (line graphs) and cellular viability (bar graphs), expressed as percentage of solvent (0.1% DMSO) control in LNCaP, CWR‐R1, and VCaP co‐cultures with CAFs. (B, D, F) Time course analysis of FRS2αi treatment effects on the growth of CAFs expressed as the count of green fluorescent cells in (B, F) and migration of the cells into the wound expressed as the percentage of wound confluence in (D). Statistical significance of n = 3 replicates in A, B, and C were calculated using one‐way ANOVA using Dunnett's test with controls (0.1% DMSO) as reference (*p < 0.05, **p < 0.01, ***p < 0.001, ****p < 0.0001). (G) Immunoblot analysis of FGFR downstream signaling, with protein band signal intensities, indicated in the line graphs in response to 0 μM–10 μM FRS2αi treatment. Antibodies used are indicated to the right of the immunoblot panels.
FIGURE 4
FIGURE 4
The FGFRis affect proliferation of CAFs in a dose‐dependent manner (A–C). Time course shows the effects of FIIN1 (A), FIIN2 (B), and FRS2αi (C) treatment on proliferation (indicated as percentage of confluence) and (D) cell viability after 72 h of treatment, expressed as the percentage of solvent (0.1% DMSO) control. Statistical significance of n = 3 replicas was calculated using one‐way ANOVA and Dunnett's test with controls (0.1% DMSO) as a reference (*p < 0.05, **p < 0.01, ***p < 0.001, ****p < 0.0001). (E) Representative phase‐contrast images of CAF 2D mono‐cultures after 72 h treatment with FGFRis. Scale bar 200 μm. (F) Immunofluorescent staining of CAFs in 3D organotypic culture against mesenchymal markers (vimentin), F‐Actin (Phalloidin), a cell proliferation marker (Ki67), and nuclear DNA counterstain (Draq5) after 6 days of treatment with FRS2αi. The images were captured with a 40× objective using the spinning disk confocal microscope. Scalebar = 100 μm.
FIGURE 5
FIGURE 5
FRS2αi represses PCa growth in 3D‐organotypic co‐cultures with CAFs. (A) Representative phase contrast and green fluorescence (GFP) images of organotypic co‐cultures of LNCAP + CAF. (B) Brightfield microscope images of CWR‐R1 at the endpoint of treatment with FRS2αi. Scale bar of 200 μm. (C–F) Quantitative analysis of size and viability 3D LNCaP co‐cultures (C, D) and CWR‐R1 (E,F). The box and whisker plots represent the median size of the treated organotypic co‐cultures (black horizontal line), the median size of the controls (dotted red horizontal line) and the total number of objects in the analyses. Statistical significance of n = 3 replica calculated using Bonferroni‐corrected t‐test (*p < 0.05, **p < 0.01, ***p < 0.001, ****p < 0.0001). The viability analysis of LNCaP co‐culture organotypic growth indicated in (D) and CWR‐R1 in (F), exposed to FRS2αi. Statistical analysis with one‐way ANOVA using Dunnett's test of n = 3 replicas (*p < 0.05, **p < 0.01, ***p < 0.001, ****p < 0.0001). (G, H) Immunofluorescence staining of 3D co‐cultures after 6 days of treatment with 7 μM FRS2αi in LNCaP with CAFs (G) and CWR‐R1 (H) with CAF specific expression protein, a mesenchymal marker (vimentin), F‐actin (Phalloidin), and nuclear DNA counterstain (Draq5). The images were captured with 20× and 40× objectives using the spinning disk confocal microscope. Scalebar = 100 μm.
FIGURE 6
FIGURE 6
Immunofluorescence staining of (A) LNCaP with CAFs and (B) CWR‐R1 organotypic 3D co‐cultures after 6 days of treatment with 7 μM FRS2αi. The 3D co‐cultures were stained for vimentin (CAF marker, green channel), Ki67 (proliferation marker, red channel), and Draq5 (nuclei, blue channel). The merged Z‐stack images from confocal microscopy are displayed in greyscale and shown in the merged images in color. Scale bar = 50 μm.

References

    1. Mills IG. Maintaining and reprogramming genomic androgen receptor activity in prostate cancer. Nat Rev Cancer. 2014;14(3):187‐198. doi: 10.1038/nrc3678 - DOI - PubMed
    1. Poutanen M, Hagberg Thulin M, Härkönen P. Targeting sex steroid biosynthesis for breast and prostate cancer therapy. Nat Rev Cancer. 2023;23:686‐709. doi: 10.1038/s41568-023-00609-y - DOI - PubMed
    1. Mori K, Mostafaei H, Pradere B, et al. Apalutamide, enzalutamide, and darolutamide for non‐metastatic castration‐resistant prostate cancer: a systematic review and network meta‐analysis. Int J Clin Oncol. 2020;25:1892‐1900. doi: 10.1007/s10147-020-01777-9 - DOI - PMC - PubMed
    1. Watson PA, Arora VK, Sawyers CL. Emerging mechanisms of resistance to androgen receptor inhibitors in prostate cancer. Nat Rev Cancer. 2015;15(12):701‐711. doi: 10.1038/nrc4016 - DOI - PMC - PubMed
    1. Kirby M, Hirst C, Crawford ED. Characterising the castration‐resistant prostate cancer population: A systematic review. Int J Clin Pract. 2011;65(11):1180‐1192. doi: 10.1111/j.1742-1241.2011.02799.x - DOI - PubMed

MeSH terms

Substances