. 2024 Sep;13(18):e70239.
doi: 10.1002/cam4.70239.

Extracellular matrix production and oxygen diffusion regulate chemotherapeutic response in osteosarcoma spheroids

Affiliations

Extracellular matrix production and oxygen diffusion regulate chemotherapeutic response in osteosarcoma spheroids

Isabel S Sagheb et al. Cancer Med. 2024 Sep.

Abstract

Background: Osteosarcoma (OS) survival rates and outcome have not improved in 50 years since the advent of modern chemotherapeutics. Thus, there is a critical need for an improved understanding of the tumor microenvironment to identify better therapies. Extracellular matrix (ECM) deposition and hypoxia are known to abrogate the efficacy of various chemical and cell-based therapeutics. Here, we aim to mechanistically investigate the combinatorial effects of hypoxia and matrix deposition with the use of OS spheroids.

Methods: We use two murine OS cell lines with differential metastatic potential to form spheroids. We form spheroids of two sizes, use ascorbate-2-phosphate supplementation to enhance ECM deposition, and study cell response under standard (21% O2) and physiologic (5% O2) oxygen tensions. Finally, we examine chemotherapeutic responses to doxorubicin treatment.

Results: ECM production and oxygen tension are key determinants of spheroid size through cell organization based on nutrient and oxygen distribution. Interestingly, highly metastatic OS is more susceptible to chemotherapeutics compared to less metastatic OS when matrix production increases. Together, these data suggest that dynamic interactions between ECM production and oxygen diffusion may result in distinct chemotherapeutic responses despite inherent tumor aggressiveness.

Conclusion: This work establishes OS spheroids as a valuable tool for early OS tumor formation investigation and holds potential for novel therapeutic target and prognostic indicator discovery.

Keywords: chemoresistance; chemotherapy; hypoxia; osteosarcoma; tumorigenesis.


Conflict of interest statement

The authors declare no conflicts of interest.

Figures

FIGURE 1
FIGURE 1
OS spheroids have similar diameters regardless of initial cell density. OS spheroid diameter during formation of spheroids formed with 5,000 (5 K) (A) or 10,000 (10 K) (B) cells per spheroid. (C) Representative brightfield microscopy images of spheroids during formation. Scale bar = 500 μm. Data are mean ± SD (n = 10–12 single spheroids, distributed over at least three separate wells). Groups with statistically significant differences based on two‐way ANOVA do not share the same letters; ns denotes no significance among groups.
FIGURE 2
FIGURE 2
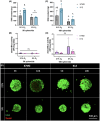
Spheroids formed with 10,000 OS cells have decreased viability. DNA content and metabolic activity of OS spheroids formed with 5,000 (5 K) (A, B) or 10,000 (10 K) (C, D) cells per spheroid. (E) Representative Live/Dead confocal microscopy images of spheroids as max projected z‐stacks after 72 h of formation. Live cells are green, and dead cells are red. Scale bar = 500 μm. Data are mean ± SD (n = 3 spheroid wells, 29 spheroids/well). Groups with statistically significant differences based on two‐way ANOVA do not share the same letters; ns denotes no significance among groups.
FIGURE 3
FIGURE 3
Spheroids formed of 5,000 OS cells contain more collagen than those of 10,000 cells. (A) Representative H&E‐stained spheroids 1 day after formation. Scale bar = 100 μm. Collagen content as measured by hydroxyproline assay for spheroids formed with K7M2 (B) and K12 (C) cells. Data are mean ± SD (n = 3 spheroid wells, 29 spheroids/well). Groups with statistically significant differences based on two‐way ANOVA do not share the same letters; ns denotes no significance among groups.
FIGURE 4
FIGURE 4
Spheroids of 10,000 K12 cells have increased compressive storage modulus. A MicroTester (A, B) was used to measure the compressive storage modulus of spheroids formed under standard (21% O2) (C, E) and physiologic (5% O2) (D, F) culture conditions. Data are mean ± SD (n = 3–6 single spheroids, distributed over at least three separate wells). Groups with statistically significant differences based on unpaired t‐test do not share the same letters; ns denotes no significance among groups.
FIGURE 5
FIGURE 5
Spheroids formed with 10,000 K7M2 cells cultured under standard conditions have increased integrin α5 expression. Representative confocal microscopy images of sectioned spheroids with immunohistochemical staining for integrin α5 (green) counterstained with DAPI (blue). Scale bar = 200 μm.
FIGURE 6
FIGURE 6
A2P does not change OS proliferation or spheroid compressive storage modulus. Spheroids formed with K7M2 and K12 cells were supplemented with 50 μg/mL A2P during formation to promote ECM deposition. One day after formation, OS spheroid DNA content (A, B), compressive storage modulus (C, D), and collagen content (E, F) were measured. (G) Live/Dead confocal microscopy images, as max projected z‐stacks, of A2P‐supplemented spheroids after 1 day after formation. Live cells are green, dead cells are red. Scale bar = 500 μm. Data are mean ± SD (n = 3, spheroid wells, 29 spheroids/well for A, B, E, F; n = 3–7, single spheroids, distributed over at least 3 separate wells for C, D). Groups with statistically significant differences based on two‐way ANOVA do not share the same letters; ns denotes no significance among groups.
FIGURE 7
FIGURE 7
Increased ECM content influences OS spheroid susceptibility to doxorubicin as a function of metastatic potential. OS spheroids without A2P or supplemented with A2P were treated with 0.1 μM DOX for 7 days after formation. DNA content was measured for spheroids formed with K7M2 (A, B) and K12 (C, D) cells. Data are presented as Day 7 DNA content normalized to Day 1 DNA content. Data are mean ± SD (n = 3 spheroid wells, 29 spheroids/well). Groups with statistically significant differences based on two‐way ANOVA do not share the same letters; ns denotes no significance among groups.

References

    1. Geller DS, Gorlick R. Osteosarcoma: a review of diagnosis, management, and treatment strategies. Clin Adv Hematol Oncol. 2010;8:705‐718. - PubMed
    1. Eaton BR, Schwarz R, Vatner R, et al. Osteosarcoma. Pediatr Blood Cancer. 2021;68(Suppl 2):e28352. - PubMed
    1. Misaghi A, Goldin A, Awad M, Kulidjian AA. Osteosarcoma: a comprehensive review. SICOT J. 2018;4:12. - PMC - PubMed
    1. Peterse EFP, van Leeuwen TN, Cleton‐Jansen AM. In vitro studies of osteosarcoma: a researcher's perspective of quantity and quality. J Bone Oncol. 2017;7:29‐31. - PMC - PubMed
    1. Thai VL, Griffin KH, Thorpe SW, Randall RL, Leach JK. Tissue engineered platforms for studying primary and metastatic neoplasm behavior in bone. J Biomech. 2021;115:110189. - PMC - PubMed