. 2024 Sep 5:15:1448226.
doi: 10.3389/fpsyg.2024.1448226. eCollection 2024.

Mind wandering on command

Affiliations

Mind wandering on command

Adrian B Safati et al. Front Psychol. .

Abstract

Three experiments (N = 336) examined whether participants can systematically adjust levels of mind wandering on command. Participants performed four blocks of the metronome response task (MRT) in which they pressed a spacebar in sync with a steady audio tone. Levels of spontaneous and deliberate mind wandering were measured using intermittent thought probes. Performance was indexed with MRT response time variability and omission errors. Each block started with instructions to mind wander either 20, 40, 60, or 80% of the time. Analysis was primarily conducted using linear mixed effects models. We found that mind wandering (spontaneous and deliberate), response time variability, and omission errors increased progressively with instructions to mind wander more and that these instruction-related changes were larger for deliberate than spontaneous mind wandering (Experiments 1-3). This pattern held regardless of whether participants' eyes were open or shut (Experiment 2). Relative to a control group receiving no commands to mind wander, instructing people to mind wander 60 or 80% of the time led to more deliberate mind wandering, and strikingly, asking people to mind wander 20% of the time led to less spontaneous mind wandering (Experiment 3). Our results suggest that individuals can titrate mind wandering experiences to roughly match instructed levels indicating that mind wandering can be manipulated through simple instructions. However, other features of the data suggest that such titration is effortful and may come with a cost to performance.

Keywords: attention; executive control; experience sampling; mind-wandering; sustained attention; thought control.


Conflict of interest statement

The authors declare that the research was conducted in the absence of any commercial or financial relationships that could be construed as a potential conflict of interest.

Figures

Figure 1
Figure 1
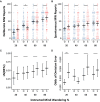
Mind wandering outcomes and MRT performance in the counterbalanced group by level of instructed mind wandering for Experiment 1. The colored points illustrate raw participant responses to the mind wandering probes at every level of mind wandering instruction. The estimated marginal means, and 95% confidence intervals from Model 1.1 for panels (A,B), Model 1.2 for panel (C), Model 1.3 for panel (D) are presented in black. Pairwise comparisons with significance scores are shown at the top, Tukey’s HSD was used to adjust for multiple comparisons. The rhythmic response time variability scores presented in panel (C) were transformed by applying a natural logarithm function (*p < 0.05, **p < 0.01, ***p < 0.001).
Figure 2
Figure 2
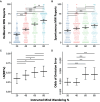
Mind wandering outcomes and MRT performance in the ascending and descending mind wandering instruction groups for Experiment 1. The colored points illustrate raw participant responses to the mind wandering probes at every level of mind wandering instruction. The estimated marginal means, and 95% confidence intervals from Model 1.4 for panels (A,B), Model 1.5 for panel (C), and Model 1.6 for panel (D) are presented in black. Pairwise comparisons with significance scores are shown at the top, Tukey’s HSD was used to adjust for multiple comparisons (*p < 0.05, **p < 0.01, ***p < 0.001).
Figure 3
Figure 3
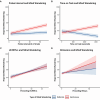
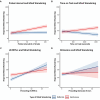
Estimated marginal trends in spontaneous and deliberate mind wandering reports for Experiment 1. Estimated marginal trends for the effects of (A) probe interval, (B) time on task, (C) rhythmic response time variability, and (D) omissions on reported mind wandering. Plots (A,B) use the data from the counterbalanced group from Model 1.1. Plot (C) uses the data from all groups from Model 1.7, and Plot (D) uses the data from all groups from Model 1.8.
Figure 4
Figure 4
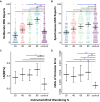
Differences in mind wandering outcomes and MRT performance for Experiment 2. Panels (A,B) contain mind wandering reports and task performance across levels of mind wandering instruction comparing individuals instructed to have their eyes opened “O” or shut “S.” The colored points illustrate raw participant responses to the mind wandering probes at every level of mind wandering instruction. The estimated marginal means, and 95% confidence intervals from Model 2.1 for panels (A,B), Model 2.2 for panels (C), and Model 2.3 for panel (D) are presented in black. Pairwise comparisons with significance scores are shown at the top, Tukey’s HSD was used to adjust for multiple comparisons (*p < 0.05, **p < 0.01, ***p < 0.001).
Figure 5
Figure 5
Differences in mind wandering outcomes and MRT performance for Experiment 2. The panels herein collapse the eye instructions to highlight the pairwise comparisons across levels of mind wandering instruction. The colored points illustrate raw participant responses to the mind wandering probes at every level of mind wandering instruction. The estimated marginal means, and 95% confidence intervals from Model 2.1 for panels (A,B), Model 2.2 for panels (C), and Model 2.3 for panel (D) are presented in black. Pairwise comparisons with significance scores are shown at the top, Tukey’s HSD was used to adjust for multiple comparisons (*p < 0.05, **p < 0.01, ***p < 0.001).
Figure 6
Figure 6
Estimated marginal trends in spontaneous and deliberate mind wandering reports for Experiment 2. Estimated marginal trends for the effects of (A) probe interval, (B) time on task, (C) rhythmic response time variability, and (D) omission on reported mind wandering. Plots (A,B) use the data from Model 2.1, while Plot (C) uses data from Model 2.4, and Plot (D) uses data from Model 2.5.
Figure 7
Figure 7
Mind wandering outcomes and MRT performance by instructed levels of mind wandering for Experiment 3. The colored points illustrate raw participant responses to the mind wandering probes at every level of mind wandering instruction. The estimated marginal means, and 95% confidence intervals from Model 3.1 for panels (A,B), Model 3.2 for panel (C), and Model 3.3 for panel (D) are presented in black. Pairwise comparisons with significance scores are shown at the top, Tukey’s HSD was used to adjust for multiple comparisons (*p < 0.05, **p < 0.01, ***p < 0.001).
Figure 8
Figure 8
Mind wandering outcomes and MRT performance by instructed levels of mind wandering for Experiment 3. The colored points illustrate raw participant responses to the mind wandering probes at every level of mind wandering instruction. The estimated marginal means, and 95% confidence intervals from Model 3.4 for panels (A,B), Model 3.5 for panel (C), and Model 3.6 for panel (D) are presented in black. Pairwise comparisons with significance scores are shown at the top, with black lines indicating comparisons between specific levels of instruction and the control group, and blue lines indicating comparisons between the instruction and control group overall, Tukey’s HSD was used to adjust for multiple comparisons (*p < 0.05, **p < 0.01, ***p < 0.001).
Figure 9
Figure 9
Estimated marginal trends in spontaneous and deliberate mind wandering reports for Experiment 3. Estimated marginal trends for the effects of (A) probe interval, (B) time on task, (C) rhythmic response time variability, and (D) omission on reported mind wandering. Plots (A,B) use the data from Model 3.1, while Plot (C) uses data from Model 3.7, and Plot (D) uses data from Model 3.8.

References

    1. Adam K. C., Doss M. K., Pabon E., Vogel E. K., de Wit H. (2020). Δ9-tetrahydrocannabinol (THC) impairs visual working memory performance: a randomized crossover trial. Neuropsychopharmacology 45, 1807–1816. doi: 10.1038/s41386-020-0690-3, PMID: - DOI - PMC - PubMed
    1. Anderson T., Petranker R., Lin H., Farb N. A. (2021). The metronome response task for measuring mind wandering: replication attempt and extension of three studies by Seli et al. Atten. Percept. Psychophys. 83, 315–330. doi: 10.3758/s13414-020-02131-x, PMID: - DOI - PubMed
    1. Baird B., Smallwood J., Lutz A., Schooler J. W. (2014). The decoupled mind: mind-wandering disrupts cortical phase-locking to perceptual events. J. Cogn. Neurosci. 26, 2596–2607. doi: 10.1162/jocn_a_00656, PMID: - DOI - PubMed
    1. Bates D., Mächler M., Bolker B., Walker S. (2015). Fitting linear mixed-effects models using lme4. J. Stat. Softw. 67, 1–48. doi: 10.18637/jss.v067.i01 - DOI
    1. Blondé P., Sperduti M., Makowski D., Piolino P. (2022). Bored, distracted, and forgetful: the impact of mind wandering and boredom on memory encoding. Q. J. Exp. Psychol. 75, 53–69. doi: 10.1177/17470218211026301, PMID: - DOI - PubMed

LinkOut - more resources