. 2024 Sep 5:15:1455457.
doi: 10.3389/fimmu.2024.1455457. eCollection 2024.

Expression and regulation of the CXCL9-11 chemokines and CXCR3 receptor in Atlantic salmon (Salmo salar)

Affiliations

Expression and regulation of the CXCL9-11 chemokines and CXCR3 receptor in Atlantic salmon (Salmo salar)

Natalia Valdés et al. Front Immunol. .

Abstract

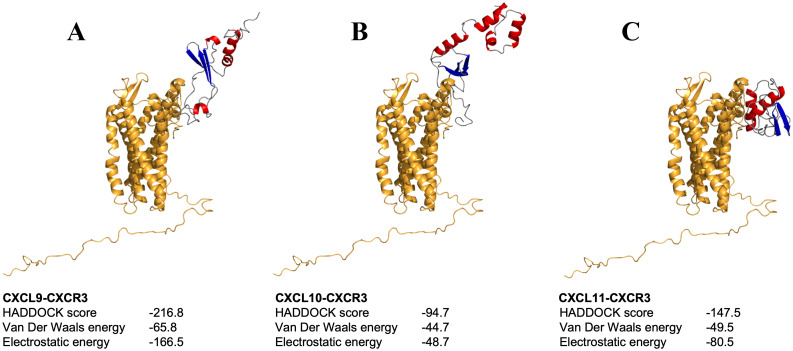
Chemokines are cytokines that mediate leukocyte traffic between the lymphoid organs, the bloodstream, and the site of tissue damage, which is essential for an efficient immune response. In particular, the gamma interferon (IFN- γ) inducible chemokines CXCL9, CXCL10, and CXCL11, and their receptor CXCR3, are involved in T cell and macrophage recruitment to the site of infection. The nature and function of these chemokines and their receptor are well-known in mammals, but further research is needed to achieve a similar level of understanding in fish immunity. Thus, in this study, we seek to identify the genes encoding the components of the Atlantic salmon (Salmo salar) CXCL9, CXCL10, CXCL11/CXCR3 axis (CXCL9-11/CXCR3), predict the protein structure from the amino acid sequence, and explore the regulation of gene expression as well as the response of these chemokines and their receptor to viral infections. The cxcl9, cxcl10, cxcl11, and cxcr3 gene sequences were retrieved from the databases, and the phylogenetic analysis was conducted to determine the evolutionary relationships. The study revealed an interesting pattern of clustering and conservation among fish and mammalian species. The salmon chemokine sequences clustered with orthologs from other fish species, while the mammalian sequences formed separate clades. This indicates a divergent evolution of chemokines between mammals and fish, possibly due to different evolutionary pressures. While the structural analysis of the chemokines and the CXCR3 receptor showed the conservation of critical motifs and domains, suggesting preserved functions and stability throughout evolution. Regarding the regulation of gene expression, some components of the CXCL9-11/CXCR3 axis are induced by recombinant gamma interferon (rIFN-γ) and by Infectious pancreatic necrosis virus (IPNV) infection in Atlantic salmon cells. Further studies are needed to explore the role of Atlantic salmon CXCL9-11 chemokines in regulating immune cell migration and endothelial activation, as seen in mammals. To the best of our knowledge, there have been no functional studies of chemokines to understand these effects in Atlantic salmon.

Keywords: CXCL10; CXCL11; CXCL9; CXCR3; Salmo salar; chemokine; fish immunity; teleost.


Conflict of interest statement

The authors declare that the research was conducted in the absence of any commercial or financial relationships that could be construed as a potential conflict of interest.

Figures

Figure 1
Figure 1
Sequence alignment of CXCR3 receptors. Analysis is based on the structure of CXCR3 chemokine receptors, where sequences 1-9 correspond to the Atlantic salmon (Ss) receptor, sequence 10 corresponds to mouse (Mm), and sequence 11 to human (Hs). Transmembrane (TM) intra (ICL) and extracellular (ECL) domains are colored in orange and blue, and conserved motifs colored in red.
Figure 2
Figure 2
Phylogenetic tree of CXCL9-11/CXCR3 axis genes in Atlantic salmon based on amino acid sequences. (A) CXCL9, CXCL10, CXCL11, and (B) CXCR3 are highlighted in green, turquoise, and purple, respectively. CXCR is highlighted in red. Sequences from Atlantic salmon (S. salar) are indicated with a dot. Amino acid-based phylogenetic analyses were generated using MAFFT Version 7.409 software, and the tree was constructed with the FigTree program using the Bayesian method.
Figure 3
Figure 3
Alignment of protein sequences and phylogenetic tree analysis of CXCR3. (A) Multiple sequence alignment of amino acid sequences of CXCR3 from different species. (B) Phylogenetic analysis of CXCR3 proteins from different species. The tree was generated using the maximum likelihood method in MEGA 11.0 software, with bootstrap values of 1000 replicates.
Figure 4
Figure 4
Molecular modeling of Atlantic salmon CXC3 receptor. The CXCR3 chemokine receptor is represented with alpha helices in red, beta sheets in blue, and loops in grey.
Figure 5
Figure 5
Molecular modeling of Atlantic salmon CXCL9, CXCL10, and CXCL11 chemokines. (A) CXCL9, (B) CXCL10, and (C) CXCL11 chemokines are represented with alpha helices in red, beta sheets in blue, loops in white and yellow highlighting the cysteine residues forming disulfide bonds characteristic of the CXC family of chemokines. The CXCR3 chemokine receptor is represented with alpha helices in red, beta sheets in blue, and loops in white, with highlighted disulfide bond side chains in yellow.
Figure 6
Figure 6
Molecular docking between chemokines-CXCR3 complex. (A-C) depict the docking of chemokines CXCL9, CXCL10, and CXCL11 with CXCR3, respectively. Molecules are shown in ribbon representation, with the receptor displayed in orange and chemokines colored by secondary structure.
Figure 7
Figure 7
Tissue distribution of transcript expression of CXCL9-11/CXCR3 axis in Atlantic salmon. The expression level of the receptor transcripts was determined by real-time RT-PCR in lymphoid and non-lymphoid tissues obtained from 4 fish. Gene expression data were normalized to β-Actin. Data represent the mean ± SD of relative expression levels to expression in the liver. Differences between groups were determined with one way ANOVA followed by Dunnet post hoc test. * p < 0.05; *** p < 0.001
Figure 8
Figure 8
rIFN-γ modulates the expression of genes cxcl9, cxcl10, cxcl11 and cxcr3 in SHK-1 cells. Cells were treated with recombinant IFN-γ for 3, 6, 9, and 12 h. Specific mRNA levels were measured by RT-qPCR and expressed gene expression was reported as relative to β-Actin expression (reference gene) and normalized with the relative expression of each gene in untreated cells (control group). The values obtained for each condition were expressed as normalized relative expression (NRE) ± standard deviation (SD) of 3 independent experiments (n=3). Differences between groups were determined with Kruskal-Wallis followed by Dunnet post hoc test. * < 0.05.
Figure 9
Figure 9
Poly I:C modulates the expression of genes cxcl9, cxcl10, cxcl11 and cxcr3 in SHK-1 cells. Cells were treated with poly I: C 24 h. Specific mRNA levels were measured by RT-qPCR and expressed gene expression was reported as relative to β-Actin expression (reference gene) and normalized with the relative expression of each gene in untreated cells (control group). The values obtained for each condition were expressed as normalized relative expression (NRE) ± standard deviation (SD) of 3 independent experiments (n=3). Differences between groups were determined by using a Mann-Whitney test. A p<0.05 was considered statistically significant. * p < 0.05.
Figure 10
Figure 10
Infection with IPNV modulates the expression of genes cxcl9, cxcl10, cxcl11 and cxcr3 in CHSE-214 cells. Cells were infected with IPNV (MOI = 0,1). After 24, 48, and 72 hpi cells were collected, total RNA was isolated from CHSE-214 cells across all groups, and RT-qPCR was performed to quantify gene expression. Relative quantification of transcripts encoding CXCL9, CXCL10, CXCL11 and CXCR3 was conducted using the Pfaffl method. β-Actin expression (reference gene) and normalized with the relative expression of each gene in uninfected cells (control group). The values obtained for the control (square) and IPNV-infected (circles) condition were expressed as normalized relative expression (NRE) ± standard deviation (SD) of 3 independent experiments (n=3). Statistical analyses were performed using t-test with Welch’s correction. A p<0.05 was considered statistically significant. * p < 0.05; ** p < 0.01.

Similar articles

References

    1. Fernandez EJ, Lolis E. Structure, function, and inhibition of chemokines. Annu Rev Pharmacol Toxicol. (2002) 42:469–99. doi: 10.1146/annurev.pharmtox.42.091901.115838 - DOI - PubMed
    1. Griffith JW, Sokol CL, Luster AD. Chemokines and chemokine receptors: Positioning cells for host defense and immunity. Annu Rev Immunol. (2014) 32:659–702. doi: 10.1146/annurev-immunol-032713-120145 - DOI - PubMed
    1. Miller MC, Mayo KH. Chemokines from a structural perspective. Int J Mol Sci. (2017) 18:1–16. doi: 10.3390/ijms18102088 - DOI - PMC - PubMed
    1. Bachelerie F, Ben-Baruch A, Burkhardt AM, Combadiere C, Farber JM, Graham GJ, et al. . International union of pharmacology. LXXXIX. Update on the extended family of chemokine receptors and introducing a new nomenclature for atypical chemokine receptors. Pharmacol Rev. (2014) 66:1–79. doi: 10.1124/pr.113.007724 - DOI - PMC - PubMed
    1. Dixon B, Shum B, Adams EJ, Magor K, Hedrick RP, Muir DG, et al. . CK-1, a putative chemokine of rainbow trout (Oncorhynchus mykiss). Immunol Rev. (1998) 166:341–8. doi: 10.1111/j.1600-065X.1998.tb01274.x - DOI - PubMed

MeSH terms

LinkOut - more resources