. 2024 Sep 11;5(4):901-921.
doi: 10.1162/nol_a_00151. eCollection 2024.

A Comparison of Denoising Approaches for Spoken Word Production Related Artefacts in Continuous Multiband fMRI Data

Affiliations

A Comparison of Denoising Approaches for Spoken Word Production Related Artefacts in Continuous Multiband fMRI Data

Angelique Volfart et al. Neurobiol Lang (Camb). .

Abstract

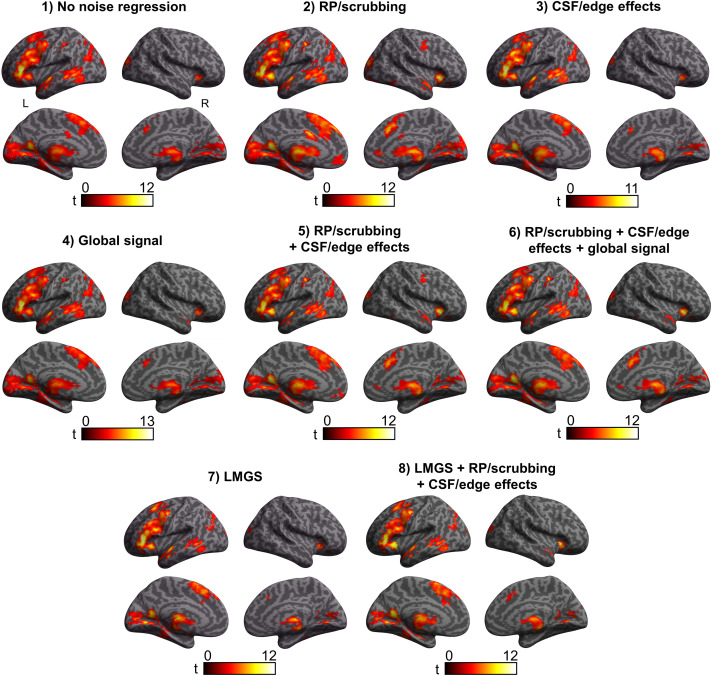
It is well-established from fMRI experiments employing gradient echo echo-planar imaging (EPI) sequences that overt speech production introduces signal artefacts compromising accurate detection of task-related responses. Both design and post-processing (denoising) techniques have been proposed and implemented over the years to mitigate the various noise sources. Recently, fMRI studies of speech production have begun to adopt multiband EPI sequences that offer better signal-to-noise ratio (SNR) and temporal resolution allowing adequate sampling of physiological noise sources (e.g., respiration, cardiovascular effects) and reduced scanner acoustic noise. However, these new sequences may also introduce additional noise sources. In this study, we demonstrate the impact of applying several noise-estimation and removal approaches to continuous multiband fMRI data acquired during a naming-to-definition task, including rigid body motion regression and outlier censoring, principal component analysis for removal of cerebrospinal fluid (CSF)/edge-related noise components, and global fMRI signal regression (using two different approaches) compared to a baseline of realignment and unwarping alone. Our results show the strongest and most spatially extensive sources of physiological noise are the global signal fluctuations arising from respiration and muscle action and CSF/edge-related noise components, with residual rigid body motion contributing relatively little variance. Interestingly, denoising approaches tended to reduce and enhance task-related BOLD signal increases and decreases, respectively. Global signal regression using a voxel-wise linear model of the global signal estimated from unmasked data resulted in dramatic improvements in temporal SNR. Overall, these findings show the benefits of combining continuous multiband EPI sequences and denoising approaches to investigate the neurobiology of speech production.

Keywords: functional magnetic resonance imaging; multiband echoplanar imaging; naming to definitions; spoken word production.


Conflict of interest statement

Competing Interests: The authors have declared that no competing interests exist.

Figures

<b>Figure 1.</b>
Figure 1.
Experimental paradigm performed in the scanner. ITI = intertrial interval.
<b>Figure 2.</b>
Figure 2.
Group-level significant BOLD signal increases. A. Clusters showing significant BOLD signal increases due to residual head motion regressors (realignment parameters and scrubbed volumes). B. Clusters showing significant BOLD signal increases associated with CSF/edge effects (5 aCompCor components). C. Clusters showing significant global BOLD signal increases (CONN method; default mask value set at 80%). D. Clusters showing significant global BOLD signal increases (mask value set at 0%). E. Extracranial sources of significant global BOLD signal increases observed in the unmasked data from panel D, rendered on a single individual’s T1-weighted MRI scan (‘chris_t1’ in MRIcroGL, Version 13.6.1, https://www.nitrc.org/projects/mricrogl/; Rorden, 2017). A–D are shown on inflated surface renderings from SPM12. All results come from Pipeline 6 looking at the variance coming from each type of noise regressor when controlling for the others and are thresholded at p < 0.001 with a spatial extent cluster at p < 0.05 (FWE corrected).
<b>Figure 3.</b>
Figure 3.
Group-level significant BOLD signal decreases. A. Clusters showing significant BOLD signal decreases due to residual head motion (realignment parameters and scrubbed volumes). B. Clusters showing significant BOLD signal decreases associated with CSF/edge effects (5 aCompCor components). A and B are shown on a rendered inflated cortical surface from SPM12. C. Clusters showing significant global BOLD signal decreases (mask value set at 0%, no significant activity was observed with mask value set at 80%). Clusters are shown on the averaged T1-weighted scan of all 18 participants, and the section view is centred on the peak cluster. All results come from Pipeline 6 looking at the variance coming from each type of noise regressor when controlling for the others and are thresholded at p < 0.001 with a spatial extent cluster at p < 0.05 (FWE corrected).
<b>Figure 4.</b>
Figure 4.
Cortical surface renderings showing significant BOLD signal changes for the contrast Definition > Control as a function of analysis pipeline. All results thresholded at p < 0.001 with a spatial extent cluster at p < 0.05 (FWE corrected). RP = realignment parameters, CSF = cerebrospinal fluid, LMGS = linear model of the global signal.
<b>Figure 5.</b>
Figure 5.
Cortical surface renderings showing significant BOLD signal changes for the contrast Definition < Control as a function of analysis pipeline. All results thresholded at p < 0.001 with a spatial extent cluster at p < 0.05 (FWE corrected).
<b>Figure 6.</b>
Figure 6.
Changes in temporal signal-to-noise ratio (tSNR) between Pipelines 1 and 7. A. Maps showing the distribution and magnitude of tSNR for images following the application of global signal regression (GSR) with LMGS (Pipeline 7) compared to without (Pipeline 1), plotted on the MNI152 template in MRIcroGL. Scale is set at the maximum value across both maps. Slices are centred on MNI coordinates −36, −15, −30 in the ventral anterior temporal lobe. B. Regions showing significant tSNR increases for images with GSR applied via LMGS, rendered on an inflated cortical surface in SPM12. Height thresholded at p < 0.05 (FWE corrected) with spatial cluster extent at 5 for visualization purposes.

References

    1. Andersson, J. L., Hutton, C., Ashburner, J., Turner, R., & Friston, K. (2001). Modeling geometric deformations in EPI time series. NeuroImage, 13(5), 903–919. 10.1006/nimg.2001.0746, - DOI - PubMed
    1. Ashburner, J. (2007). A fast diffeomorphic image registration algorithm. NeuroImage, 38(1), 95–113. 10.1016/j.neuroimage.2007.07.007, - DOI - PubMed
    1. Ashburner, J., & Friston, K. J. (2005). Unified segmentation. NeuroImage, 26(3), 839–851. 10.1016/j.neuroimage.2005.02.018, - DOI - PubMed
    1. Barch, D. M., Sabb, F. W., Carter, C. S., Braver, T. S., Noll, D. C., & Cohen, J. D. (1999). Overt verbal responding during fMRI scanning: Empirical investigations of problems and potential solutions. NeuroImage, 10(6), 642–657. 10.1006/nimg.1999.0500, - DOI - PubMed
    1. Behzadi, Y., Restom, K., Liau, J., & Liu, T. T. (2007). A component based noise correction method (CompCor) for BOLD and perfusion based fMRI. NeuroImage, 37(1), 90–101. 10.1016/j.neuroimage.2007.04.042, - DOI - PMC - PubMed

LinkOut - more resources