. 2024 Sep 18;14(41):29763-29773.
doi: 10.1039/d4ra05989a.

Cu-doped ZnO/Ag/CuO heterostructure: superior photocatalysis and charge transfer

Affiliations

Cu-doped ZnO/Ag/CuO heterostructure: superior photocatalysis and charge transfer

Abbay Gebretsadik et al. RSC Adv. .

Abstract

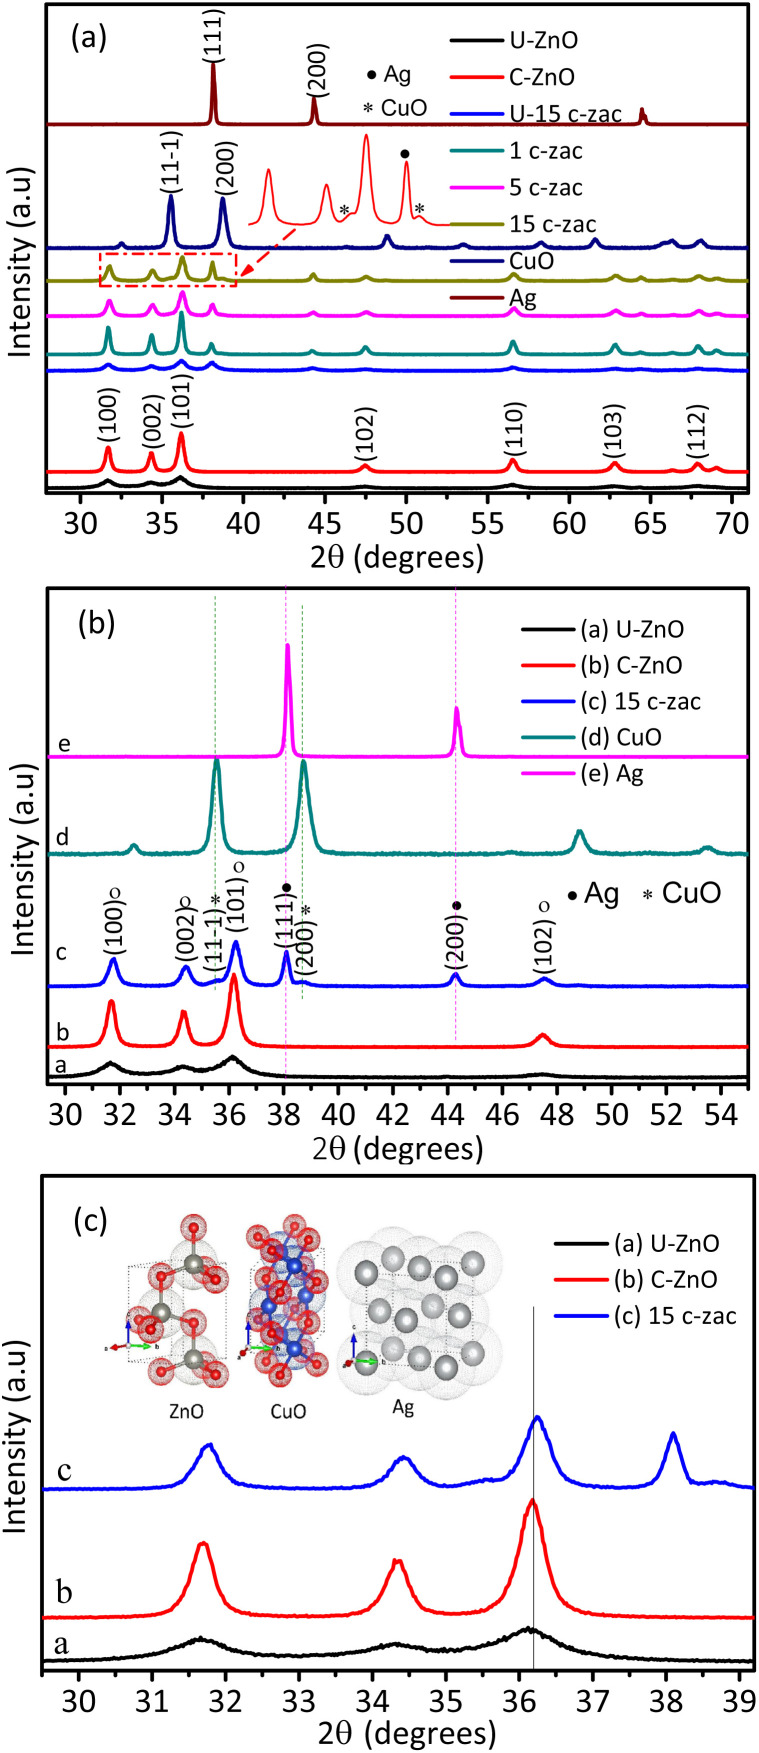
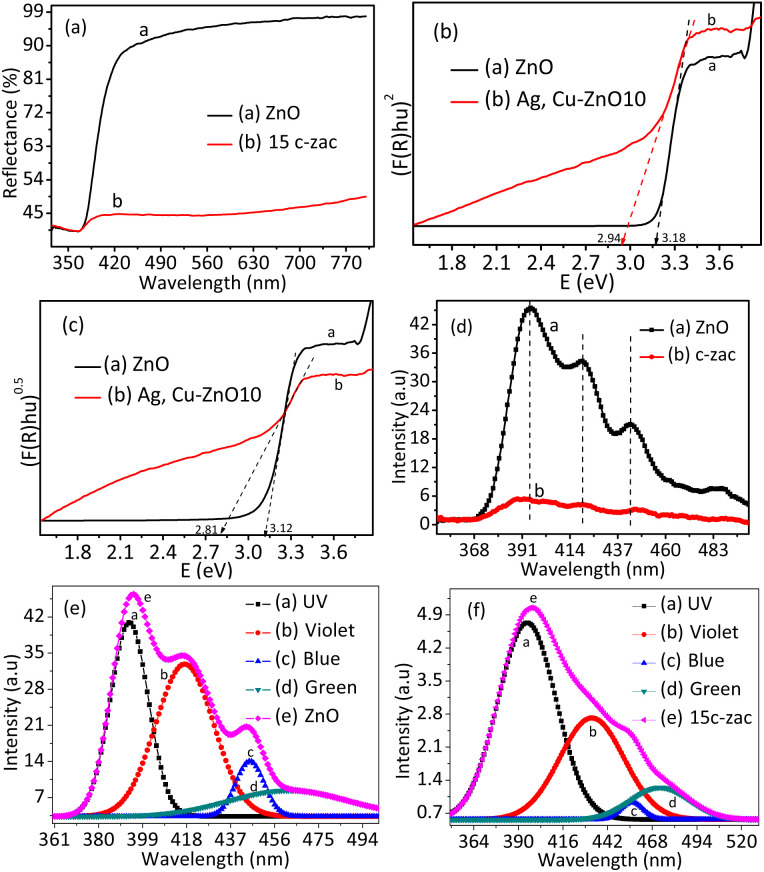
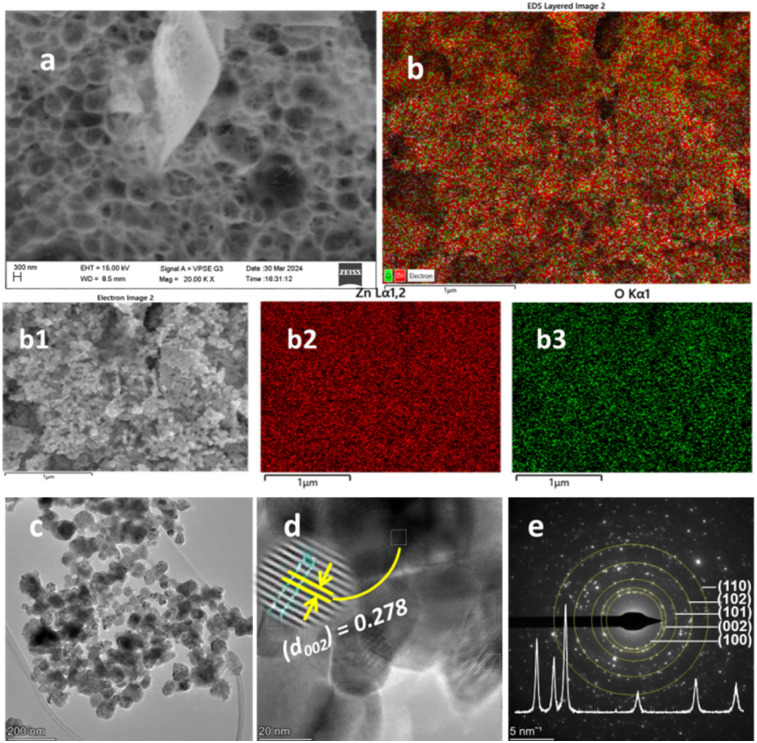
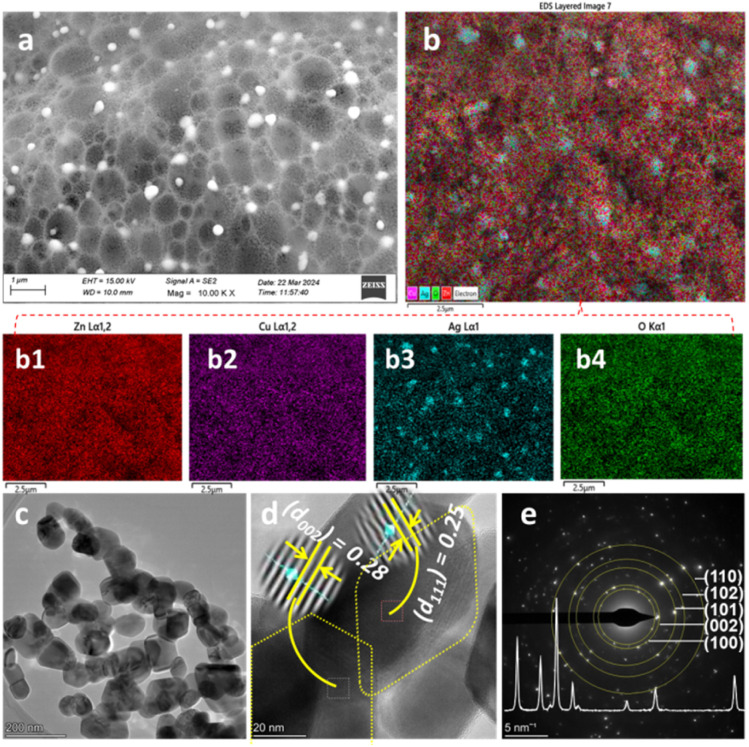
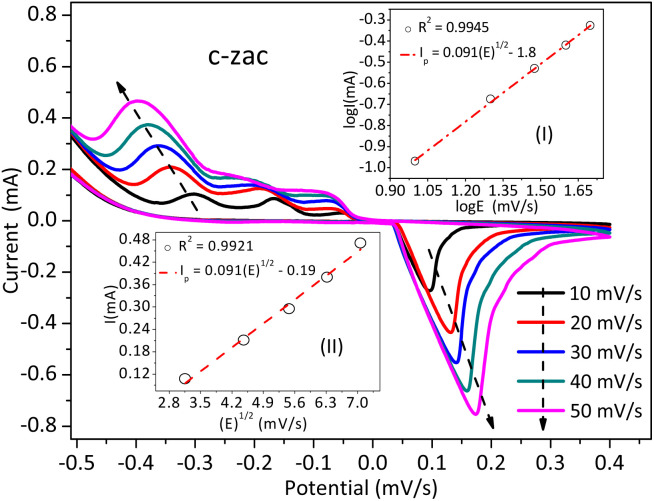
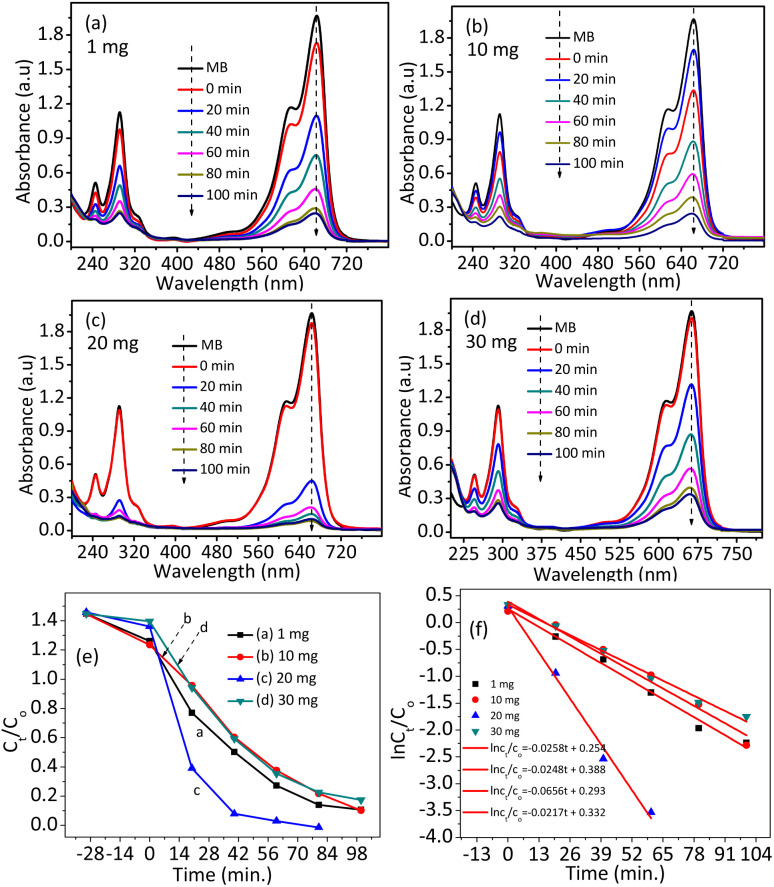
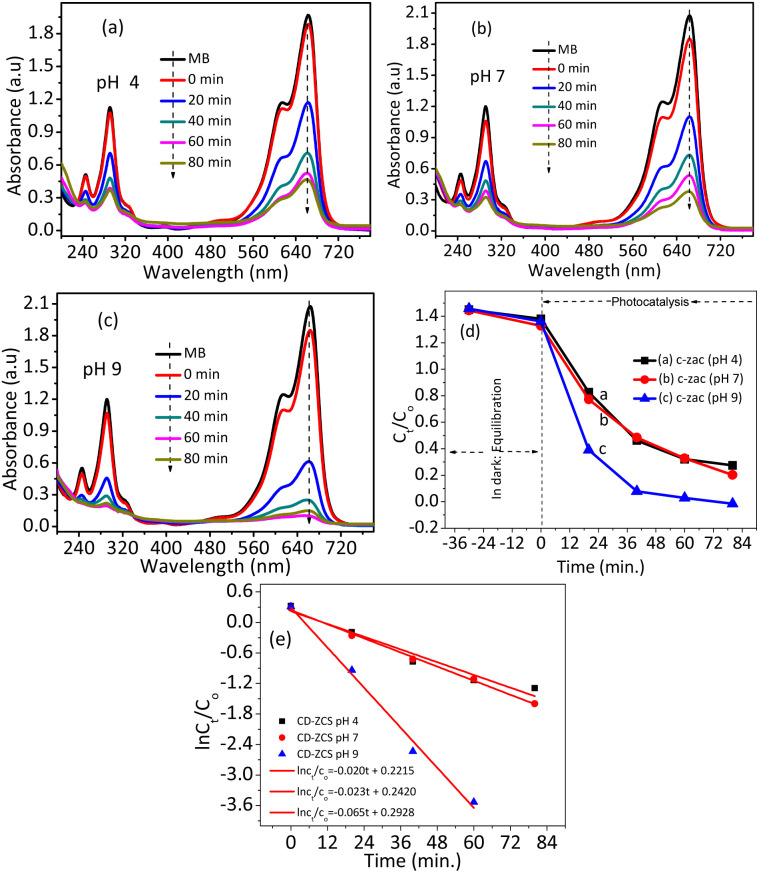
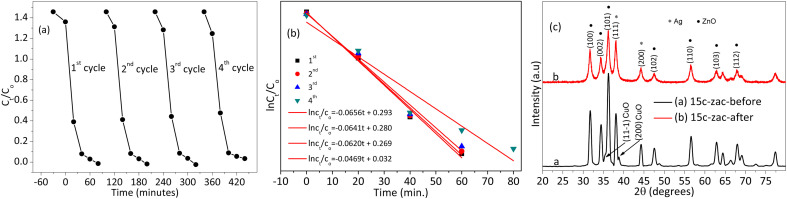
Doped semiconductor heterostructures have superior properties compared to their components. In this study, we observed the synthesis of Cu-doped ZnO/Ag/CuO heterostructure with the presence of charge transfer and visible light-harvesting properties resulting from doping and heterojunction. The porous heterostructures were prepared using the bottom-up combustion (BUC) approach. This method generated porous heterostructures by eliminating gaseous by-products. X-ray diffraction (XRD) optimization revealed that the ideal conditions included 1.00 g of polyvinyl alcohol (PVA), a synthesis temperature of 50 °C, and a 1 hour calcination time. Introducing copper (Cu) into the zinc oxide (ZnO) lattice caused a high-angle shift in the XRD pattern peaks. High-resolution transmission electron microscopy (HRTEM) images and XRD patterns confirmed the formation of Cu-doped ZnO/Ag/CuO (c-zac) heterostructures. Elemental mapping analysis confirmed the even surface distribution of Ag metal. The c-zac heterostructures exhibited superior optoelectrical and charge transfer properties compared to single ZnO. The heterostructures demonstrated improved methylene blue (MB) dye degradation potential (k = 0.065 min-1) compared to single ZnO (k = 0.0041 min-1). This photocatalytic potential is attributed to enhanced light absorption and charge transfer properties. The extended visible light absorption resulted from CuO and Ag's surface plasmon resonance properties. The selected 15c-zac heterostructure also performed well in a reusability photocatalytic test, remaining effective until the 3rd cycle. Consequently, this heterostructure holds promise for scaling up as a catalyst for environmental remediation.


Conflict of interest statement

There are no conflicts to declare.

Figures

Fig. 1
Fig. 1. Thermal analysis: DTA-TGA (differential thermal-thermogravimetric analysis) plots of polyvinyl alcohol–zinc precursor complexes before calcinating the sample in the furnace.
Fig. 2
Fig. 2. XRD crystallite structure of NPs and c-zac heterostructure: (a) the X-ray diffraction patterns of ZnO nanoparticles, and c-zac heterostructures, (b and c) the magnified views of uncalcined and calcined ZnO and calcined c-zac heterostructures. A copper oxide-independent peak was detected above the 15% dopant amount. The high-angle shift is associated with the dominant copper doping.
Fig. 3
Fig. 3. Optical properties of ZnO NPs and doped heterostructure: (a) the DRS-UV-vis spectra, (b and c) the respective direct and indirect Kubelka–Munk plots of ZnO and c-zac heterostructures, (d) the PL spectra of ZnO and 15c-zac heterostructure, (e and f) the ZnO and c-zac heterostructure Gaussian-shaped constituents of the deconvoluted plots. The inset label 15c-zac denotes the 15% dopant concentration.
Fig. 4
Fig. 4. Morphological and elemental mapping analysis of ZnO NPs: (a) FESEM image, (b) EDS layered image, (b1) electron image, (b2 and b3) elemental mapping images of zinc and oxygen, respectively, (c–e) TEM image, HRTEM, and SAED ring of ZnO NPs, respectively. The inset in (e) is the X-ray diffraction pattern. The scale bar for image (a) is 300 nm, for (b), (b1), (b2), and (b3) is 1 μm, for (c) is 200 nm, for (d) 20 nm, and for (e) 5 nm−1.
Fig. 5
Fig. 5. Morphological and elemental mapping analysis of c-zac heterostructure: (a) FESEM image, (b) EDS layered image, (b1–b4) elemental mapping images of zinc, copper, silver, and oxygen, respectively, (c–e) TEM image, HRTEM, and SAED ring of c-zac heterostructure, respectively. The inset in (e) is the X-ray diffraction pattern. The scale bar for image (a) is 1 μm nm, for (b), (b1), (b2), (b3), and (b4) is 2.5 μm, for (c) is 200 nm, for (d) 20 nm, and for (e) 5 nm−1.
Fig. 6
Fig. 6. C-zac electrochemical analysis using cyclic voltammetry; the inset (I) is the logarithmic relation between scan rates and the peak current linear plot; (II) is the square root of the scan rate vs. peak current linear plot.
Fig. 7
Fig. 7. Absorbance vs. wavelength plots of the c-zac heterostructure at an initial MB concentration of 10 ppm, an optimized solution pH of 9, and different catalyst amounts of (a) 1, (b) 10, (c) 20, (d) 30 mg, (e and f) Ct/C0 and ln Ct/C0versus time plots of the NPs and heterostructures. A catalyst amount of 20 mg has greater photocatalytic performance. A lower catalyst amount of 1 and 10 mg lacks active sites for sorption. At a high catalyst amount of 30 mg, the catalyst protects the light from reaching the adsorbed methylene blue dye.
Fig. 8
Fig. 8. The absorbance vs. wavelength plots of c-zac heterostructures at an initial MB concentration of 10 ppm, a catalyst amount of 20 mg, and different pH values of (a) 4, (b) 7, (c) 9, (d and e) Ct/C0 and ln Ct/C0versus time plots of the NPs and heterostructures, respectively. The basic region (pH of 9) showed greater photocatalytic performance due to the attractive MB and catalyst electrostatic interaction effects.
Fig. 9
Fig. 9. Reusability and XRD pattern test for optimized 15c-zac heterostructure: (a and b) four-cycle Ct/C0versus time and ln Ct/C0versus time photocatalytic performance reusability test, respectively, (c) the XRD pattern plots of 15c-zac heterostructure before and after the photocatalysis experiment.

References

    1. Oladoye P. O. Ajiboye T. O. Omotola E. O. Oyewola O. J. Results Eng. 2022;16:100678. doi: 10.1016/j.rineng.2022.100678. - DOI
    1. Abebe B. Gupta N. K. Tsegaye D. RSC Adv. 2024;14:17338–17349. doi: 10.1039/D4RA02568G. - DOI - PMC - PubMed
    1. Hu F. Yu D. Ye M. Wang H. Hao Y. Wang L. Li L. Han X. Peng S. Adv. Energy Mater. 2022;12:1–10.
    1. Sun X. Li L. Jin S. Shao W. Wang H. Zhang X. Xie Y. eScience. 2023;3:100095. doi: 10.1016/j.esci.2023.100095. - DOI
    1. Hao Y. Hu F. Zhu S. Sun Y. Wang H. Wang L. Wang Y. Xue J. Liao Y. Shao M. Peng S. Angew. Chem., Int. Ed. 2023;62:1–8. - PubMed

LinkOut - more resources