. 2024 Sep 5:14:1421791.
doi: 10.3389/fcimb.2024.1421791. eCollection 2024.

Intervention in gut microbiota increases intestinal γ-aminobutyric acid and alleviates anxiety behavior: a possible mechanism via the action on intestinal epithelial cells

Affiliations

Intervention in gut microbiota increases intestinal γ-aminobutyric acid and alleviates anxiety behavior: a possible mechanism via the action on intestinal epithelial cells

Mion Ikegami et al. Front Cell Infect Microbiol. .

Abstract

The role of the gut microbiota in the gut-brain axis has attracted attention in recent years. Some gut microbiota produces γ-aminobutyric acid (GABA), a major inhibitory neurotransmitter in mammals, in vitro, but the correlation between gut microbiota composition and intestinal GABA concentration, as well as the action of intestinal GABA in vivo, are poorly understood. Herein, we found that the intestinal GABA concentration was increased in mice by the intervention of the gut microbiota with neomycin or Bifidobacterium bifidum TMC3115 (TMC3115). Administration of TMC3115 reduced anxiety without affecting serum levels of serotonin, corticosterone, or GABA. We further found that intestinal epithelial cells expressed GABA receptor subunits and mediated mitogen-activated protein kinase signaling upon GABA stimulation. In addition, administration of TMC3115 induced mitogen-activated protein kinase signaling in colonic epithelial cells but not in small intestinal epithelial cells in mice. These results indicate that GABA produced by the gut microbiota, mainly in the colon, may affect host behavioral characteristics via GABA receptors expressed in intestinal epithelial cells without being transferred to the blood. This study suggests a novel mechanism by which intestinal GABA exerts physiological effects, even in the presence of the blood-brain barrier.

Keywords: gut microbiota; gut-brain axis; intestinal epithelial cell; probiotics; γ-aminobutyric acid.


Conflict of interest statement

GH, KY, and KM are employees of Takanashi Milk Products Co., Ltd. Kanagawa, Japan. The remaining authors declare that the research was conducted in the absence of any commercial or financial relationships that could be construed as a potential conflict of interest.

Figures

Figure 1
Figure 1
Neomycin treatment increases intestinal γ-aminobutyric acid (GABA) concentration through changes in the gut microbiota composition. (A) Experimental design of antibiotic (ABX) treatments. Mice were treated orally with ampicillin (Amp), metronidazole (Met), vancomycin (Van), or neomycin (Neo) in drinking water for four weeks. (B) Compositions of gut microbiota in Amp, Met, Van, and Neo-treated and untreated (Control) mice were determined from 16S rRNA sequences using fecal DNA pooled from 3 mice/group on days 0 and 28. The principal coordinate analysis plot of β-diversity is shown. Each group is indicated in a different color: Control, white; Amp, red; Met, blue; Van, green; Neo, purple. Small and large dots represent the data on days 0 and 28, respectively. (C) Fecal GABA concentration was measured using an ultra-performance liquid-chromatography-tandem mass spectrometry (UPLC-MS/MS) system in the control (n = 15), Amp (n = 6), Met (n = 12), Van (n = 6), and Neo (n = 18) groups on days 0, 14, 21, and 28. Data are presented as mean ± SD. *P < 0.05; **P < 0.01; ***P < 0.001 vs. Control. (D) Total amount of 16S rRNA genes in feces was measured using qPCR in the Control (n = 6) and Neo (n = 6) groups on days 0 and 28. Data are presented as mean ± SD. NS, not significant. (E) Serum GABA concentrations were measured using the UPLC-MS/MS system in the Control (n = 12) and Neo (n = 12) groups on day 29. Data are presented as mean ± SD. NS, not significant.
Figure 2
Figure 2
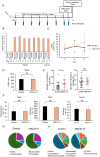
Bifidobacterium bifidum TMC3115 (TMC3115) increases intestinal γ-aminobutyric acid (GABA) concentration and alters mice behavior through changes in the gut microbiota composition. (A) Experimental design of TMC3115 administration. (B) TMC3115 in feces and cecal contents of the Control (n = 16) and TMC3115 (n = 15) groups was quantified using qPCR. Data are presented as mean ± SD. (C) Fecal GABA concentration was measured using ultra-performance liquid-chromatography-tandem mass spectrometry (UPLC-MS/MS) system in the Control (n = 16) and TMC3115 (n = 15) groups on days 0, 6, and 13. Data are presented as mean ± SD. *P < 0.05 vs. Control. (D) Serum GABA concentration was measured using UPLC-MS/MS system in the Control (n = 5) and TMC3115 (n = 5) groups on day 13. Data are presented as mean ± SD. NS, not significant. (E) Numbers of entries in open (left) and closed (right) arms in elevated plus maze test are shown for the Control (n = 22) and TMC3115 (n = 21) groups. Individual data and mean ± SD are presented. NS, not significant; *P < 0.05. (F) Serum corticosterone (left), serum serotonin (middle), and fecal serotonin (right) were measured using ELISA in the Control (n = 6–11) and TMC3115 (n = 5–10) groups on day 13 (fecal) or 14 (serum). Data are presented as mean ± SD. NS, not significant. (G, H) Bacterial occupancies at order (G) and genus (H) levels were analyzed using 16S metagenomic sequence in the Control (n = 5) and TMC3115 (n = 5) groups using cecal contents on day 14. Mean values are presented using pie charts of bacteria with more than 1% occupancies. a, Lactobacillales (G) and Lactobacillus (H); b, Clostridiales (G) and Clostridia (H).
Figure 3
Figure 3
Intestinal epithelial cells (IECs) express γ-aminobutyric acid receptor (GABAR). (A) Expression of GABAR subunits GABAAR β1 (left), GABAB1R (middle), and GABAB2R (right) in IECs prepared from the small intestine (SIECs), IECs prepared from the colon (CIECs), and the brain of mice was quantified using RT-qPCR. Expression levels relative to that in the brain are presented as mean ± SD of three independent experiments. NS, not significant; *P <0.001; **P <0.0001. (B) Expression of GABAR subunits GABAAR β1, GABAAR β2, GABAAR β3, GABAB1R, and GABAB2R in mouse intestinal organoids and brain was quantified using RT-qPCR. Expression levels relative to those in the brain are presented as mean ± SD of eight independent experiments. (C) GABAR expression was analyzed in mouse small intestinal and colonic tissue sections using immunofluorescence. Representative confocal images of GABAB1R (left) and GABAB2R (right) in the small intestine and colon are shown. Top, isotype control or without primary antibody; bottom, anti-GABABR antibody. (D) Expression of GABAR subunits GABAAR β1, GABAARβ2, GABAB1R, and GABAB2R in human IEC lines Caco-2, HCT116, and HT-29 was quantified using RT-qPCR. Expression levels relative to those in Caco-2 are presented as mean ± SD of three independent experiments. *P < 0.05; **P < 0.001.
Figure 4
Figure 4
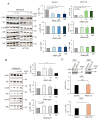
Intestinal epithelial cells (IECs) are responsive to γ-aminobutyric acid (GABA). (A) Mitogen-activated protein kinase (MAPK) phosphorylation in Caco-2 and HCT116 stimulated with GABA for 30 min was analyzed using western blotting. Representative blots (left) and mean ± SD of phosphorylation levels relative to control without GABA stimulation (right) from three independent experiments are shown. Phosphorylation levels were calculated by dividing the band intensities of phosphorylated molecules by those of the corresponding total molecules. *P < 0.05. (B) MAPK phosphorylation in intestinal organoids stimulated with GABA for 30 min was analyzed using western blotting. Representative blots (left) and mean ± SD of phosphorylation levels relative to control without GABA stimulation (right) from three independent experiments are shown. Phosphorylation levels were calculated by dividing the band intensities of phosphorylated molecules by those of the corresponding total molecules. **P < 0.01. (C) Erk phosphorylation in SIECs and CIECs isolated from Bifidobacterium bifidum TMC3115-administered mice (n=10) and control mice (n=10) were analyzed using western blotting. Representative blots (top) and mean ± SD of phosphorylation levels relative to control mice (bottom) are shown. Lysates from pooled IECs for 4-6 mice each were analyzed. Phosphorylation levels were calculated by dividing the band intensities of phosphorylated molecules by those of the corresponding total molecules. NS, not significant; *P < 0.05.

References

    1. Abdou A. M., Higashiguchi S., Horie K., Kim M., Hatta H., Yokogoshi H. (2006). Relaxation and immunity enhancement effects of gamma-aminobutyric acid (GABA) administration in humans. Biofactors 26, 201–208. doi: 10.1002/biof.5520260305 - DOI - PubMed
    1. An J., Seok H., Ha E. (2021). GABA-producing Lactobacillus plantarum inhibits metastatic properties and induces apoptosis of 5-FU-resistant colorectal cancer cells via GABAB receptor signaling. J. Microbiol. 59, 202–216. doi: 10.1007/s12275-021-0562-5 - DOI - PubMed
    1. Barrett E., Ross R. P., O’Toole P. W., Fitzgerald G. F., Stanton C. (2012). γ-Aminobutyric acid production by culturable bacteria from the human intestine. J. Appl. Microbiol. 113, 411–417. doi: 10.1111/j.1365-2672.2012.05344.x - DOI - PubMed
    1. Bercik P., Denou E., Collins J., Jackson W., Lu J., Jury J., et al. . (2011). The intestinal microbiota affect central levels of brain-derived neurotropic factor and behavior in mice. Gastroenterology 141, 599–609, 609e1-3. doi: 10.1053/j.gastro.2011.04.052 - DOI - PubMed
    1. Buffington S. A., Prisco G. V. D., Auchtung T. A., Ajami N. J., Petrosino J., Costa-Mattioli M. (2016). Microbial reconstitution reverses maternal diet-induced social and synaptic deficits in offspring. Cell 165, 1762–1775. doi: 10.1016/j.cell.2016.06.001 - DOI - PMC - PubMed