

Prediction of lymphovascular invasion of gastric cancer based on contrast-enhanced computed tomography radiomics
- PMID: 39301548
- PMCID: PMC11410566
- DOI: 10.3389/fonc.2024.1389278
Prediction of lymphovascular invasion of gastric cancer based on contrast-enhanced computed tomography radiomics
Abstract
Background: Lymphovascular invasion (LVI) is a significant risk factor for lymph node metastasis in gastric cancer (GC) and is closely related to the prognosis and recurrence of GC. This study aimed to establish clinical models, radiomics models and combination models for the diagnosis of GC vascular invasion.
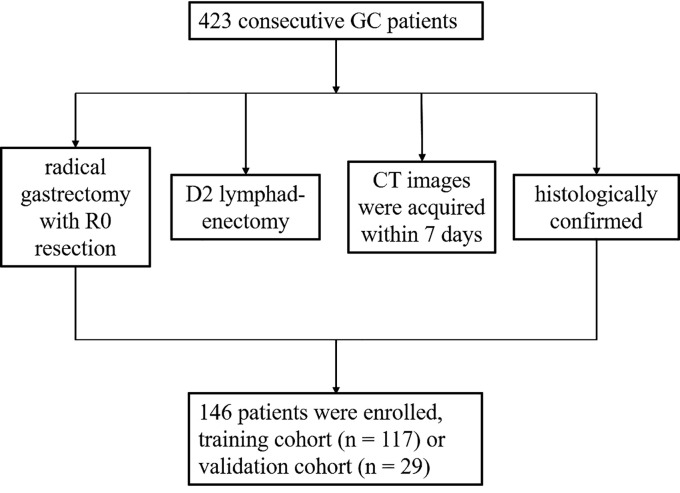
Methods: This study enrolled 146 patients with GC proved by pathology and who underwent radical resection of GC. The patients were assigned to the training and validation cohorts. A total of 1,702 radiomic features were extracted from contrast-enhanced computed tomography images of GC. Logistic regression analyses were performed to establish a clinical model, a radiomics model and a combined model. The performance of the predictive models was measured by the receiver operating characteristic (ROC) curve.
Results: In the training cohort, the age of LVI negative (-) patients and LVI positive (+) patients were 62.41 ± 8.41 and 63.76 ± 10.08 years, respectively, and there were more male (n = 63) than female (n = 19) patients in the LVI (+) group. Diameter and differentiation were the independent risk factors for determining LVI (-) and (+). A combined model was found to be relatively highly discriminative based on the area under the ROC curve for both the training (0.853, 95% CI: 0.784-0.920, sensitivity: 0.650 and specificity: 0.907) and the validation cohorts (0.742, 95% CI: 0.559-0.925, sensitivity: 0.736 and specificity: 0.700).
Conclusions: The combined model had the highest diagnostic effectiveness, and the nomogram established by this model had good performance. It can provide a reliable prediction method for individual treatment of LVI in GC before surgery.
Keywords: contrast-enhanced computed tomography; gastric cancer; lymphovascular invasion; oncology; radiomics models.
Copyright © 2024 Zhen, Wei, Song, Liu, Li, Kong, Wei, Fan and Liang.
Conflict of interest statement
The authors declare that the research was conducted in the absence of any commercial or financial relationships that could be construed as a potential conflict of interest.
Figures


References
-
- GBD 2017 Stomach Cancer Collaborators . The global, regional, and national burden of stomach cancer in 195 countries, 1990-2017: a systematic analysis for the Global Burden of Disease study 2017 [published correction appears in Lancet Gastroenterol Hepatol. 2020 Mar;5(3):e2]. Lancet Gastroenterol Hepatol. (2020) 5:42–54. doi: 10.1016/S2468-1253(19)30328-0 - DOI - PMC - PubMed
LinkOut - more resources
Full Text Sources
Miscellaneous