

Combination of circulating tumor cells and 18F-FDG PET/CT for precision diagnosis in patients with non-small cell lung cancer
- PMID: 39302034
- PMCID: PMC11413915
- DOI: 10.1002/cam4.70216
Combination of circulating tumor cells and 18F-FDG PET/CT for precision diagnosis in patients with non-small cell lung cancer
Abstract
Purpose: To investigate the value of 2-deoxy-18f-fluorodeoxyglucose (18F-FDG) positron emission tomography/computed tomography (PET/CT) and circulating tumor cells (CTCs) for the differential diagnosis of patients with benign lung diseases and those with NSCLC. To explore the phenotypic heterogeneity of CTCs and their correlation with FDG uptake in patients with Stage I-IV NSCLC.
Methods: Blood specimens from patients with benign lung diseases and patients with primary NSCLC were collected for the detection of CTCs and their subtypes (epithelial, mixed, and mesenchymal) and analyzed for 18F-FDG PET/CT tumor metabolic parameters, including the maximum standardized uptake value (SUVmax), standard uptake value (SUL), metabolic tumor volume of primary lesion (MTV), total lesion glycolysis of primary lesion (TLG). Clinical data including age, gender, smoking history, tumor size, TNM stage and pathology type were also collected. The value of the two method alone and in combination for the differential diagnosis of benign and malignant was comparatively analyzed. Finally, the differences in CTC and its subtypes in different stages of NSCLC were compared, and FDG metabolic parameters were correlated with CTC subtypes.
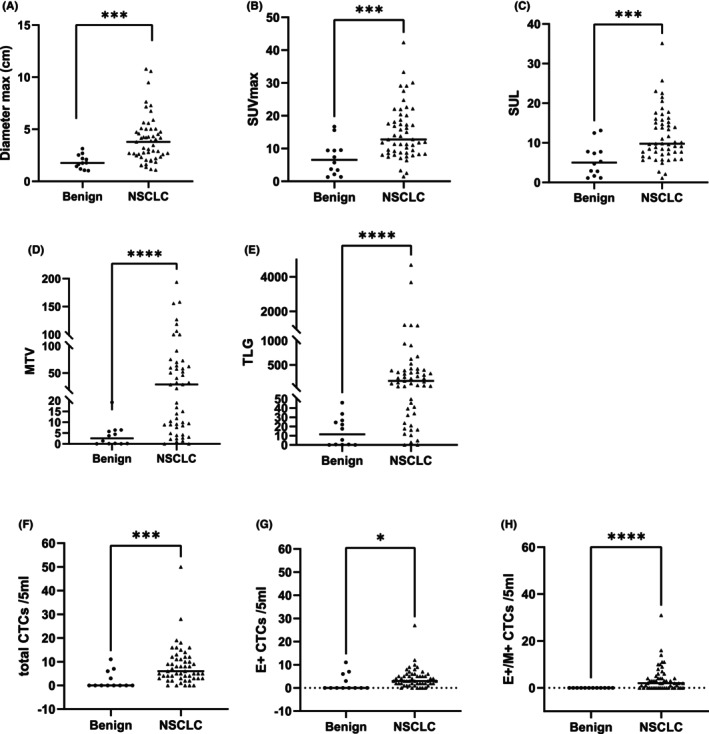
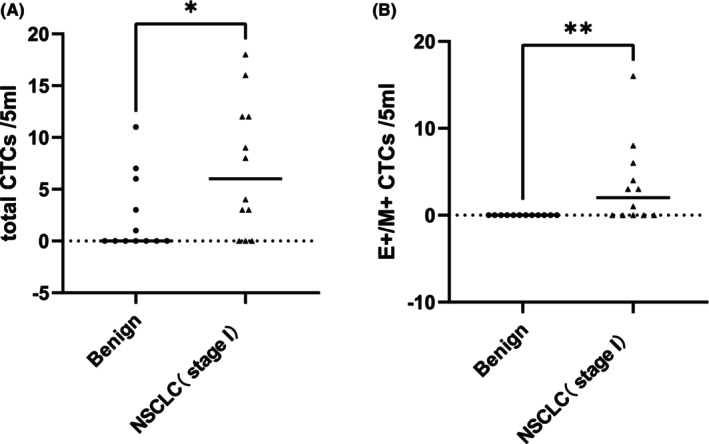
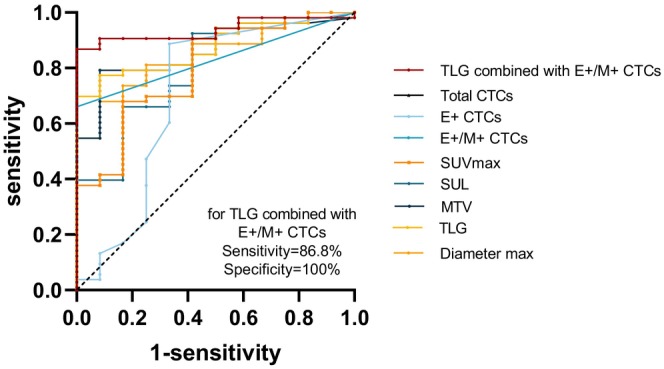
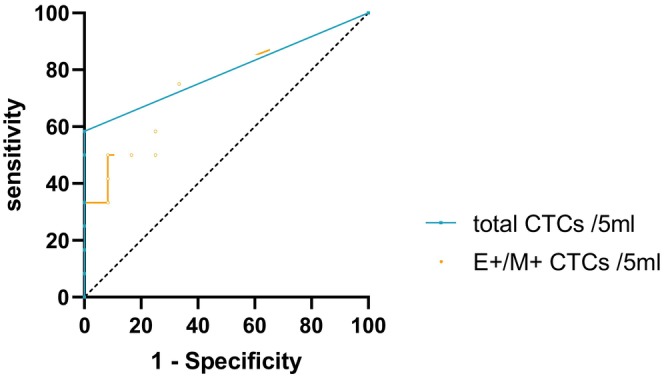
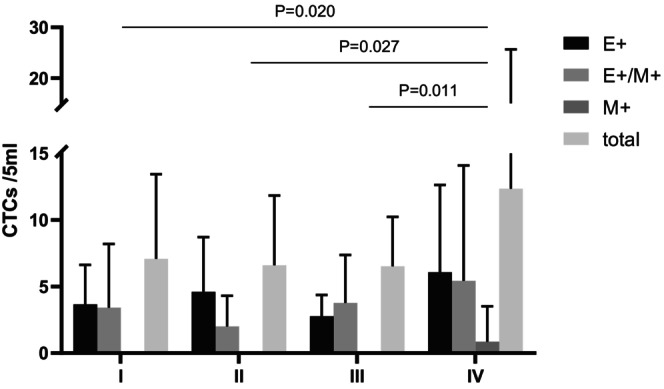
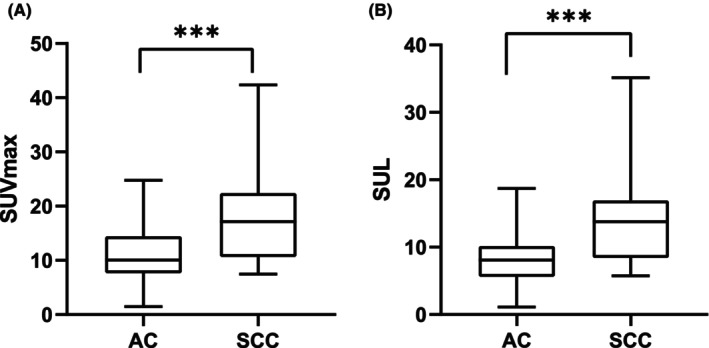
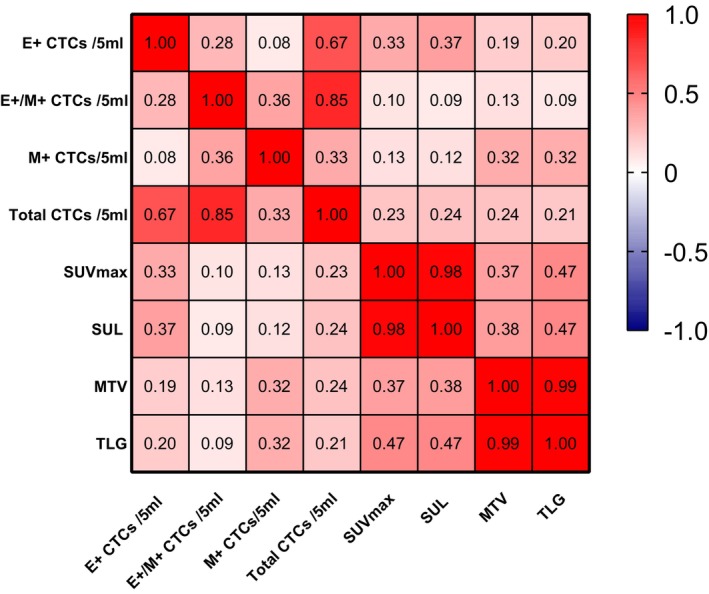
Results: There were a total of 65 patients with pulmonary diseases, including 12 patients with benign pulmonary diseases and 53 patients with NSCLC. The mean age was 67 ± 10 (38-89 years), 27 were females and 38 were males. 31 (22 males and 9 females) had a long history of smoking. The mean size of the largest diameter of all single lesions was 36 ± 22 mm with a range of 10-108 mm. Seven out of 12 benign diseases were inflammatory granulomatous lesions and 5 were inflammatory pseudotumours. Twenty-four out of 53 NSCLC were adenocarcinomas and 29 were squamous carcinomas. Twelve out of 53 patients with NSCLC were in Stage I, 10 were in Stage II, 17 were in Stage III and 14 were in Stage IV. SUVmax, SUL, MTV, TLG, total CTCs, epithelial CTCs, and mixed CTCs were all valuable in the differential diagnosis of benign and malignant. TLG combined with mixed CTCs was statistically different from all other diagnostic methods (p < 0.05) and higher than any other diagnostic criteria. In the differential diagnosis of benign and Stage I NSCLC, only total CTC (Z = -2.188 p = 0.039) and mixed CTCs (Z = -3.020 p = 0.014) had certain diagnostic efficacy, and there was no statistical difference between them (p = 0.480). Only mesenchymal CTCs differed in Stage I-IV NSCLC, with a higher number of those who developed distant metastases than those who had non-distant metastases. Epithelial CTCs correlated with SUVmax (r = 0.333, p = 0.015) and SUL (r = 0.374, p = 0.006). Mmesenchymal CTCs correlated with MTV (r = 0.342, p = 0.018) and TLG (r = 0.319, p = 0.02). Further subgroup analyses revealed epithelial CTCs were correlated with SUVmax (r = 0.543, p = 0.009) and SUL (r = 0.552, p = 0.008), and the total CTCs was correlated with SUVmax (r = 0.622, p = 0.003), SUL (r = 0.652, p = 0.003), MTV (r = 0.460, p = 0.031), and TLG (r = 0.472, p = 0.027) in the early group (Stage I-II). Only mesenchymal CTCs was associated with MTV (r = 0.369, p = 0.041), and TLG (r = 0.415, p = 0.02) in the intermediate-late group (Stage III-IV).
Conclusion: Both FDG PET metabolic parameters and CTCs demonstrated diagnostic value for NSCLC, and combining TLG with mixed CTCs could enhance their diagnostic efficacy. The total CTCs and mixed CTCs showed greater diagnostic value than FDG PET in distinguishing benign lesions from Stage I NSCLC. In NSCLC patients, the epithelial CTCs exhibited a positive correlation with SUVmax and SUL, while mesenchymal CTCs correlated with MTV, and TLG. Besides, epithelial CTCs showed stronger correlations with SUVmax and SUL, and total CTCs showed stronger correlations with SUVmax, SUL, MTV, and TLG in Stage I-II NSCLC. Only mesenchymal CTCs in Stage III-IV NSCLC showed correlations with MTV and TLG. Stage IV NSCLC cases displayed a higher number of mesenchymal CTCs.
Keywords: 18F‐FDG PET/CT; circulating tumor cells (CTCs); diagnosis; non‐small‐cell lung cancer (NSCLC).
© 2024 The Author(s). Cancer Medicine published by John Wiley & Sons Ltd.
Conflict of interest statement
The authors declare that they have No competing financial interests exist.
Figures
References
-
- Siegel RL, Miller KD, Wagle NS, Jemal A. Cancer statistics, 2023. CA Cancer J Clin. 2023;73(1):17‐48. - PubMed
MeSH terms
Substances
LinkOut - more resources
Full Text Sources
Medical
