Review
. 2024 Sep 15;151(18):dev202412.
doi: 10.1242/dev.202412. Epub 2024 Sep 18.

Morphogens in the evolution of size, shape and patterning

Affiliations
Review

Morphogens in the evolution of size, shape and patterning

Lewis S Mosby et al. Development. .

Abstract

Much of the striking diversity of life on Earth has arisen from variations in the way that the same molecules and networks operate during development to shape and pattern tissues and organs into different morphologies. However, we still understand very little about the potential for diversification exhibited by different, highly conserved mechanisms during evolution, or, conversely, the constraints that they place on evolution. With the aim of steering the field in new directions, we focus on morphogen-mediated patterning and growth as a case study to demonstrate how conserved developmental mechanisms can adapt during evolution to drive morphological diversification and optimise functionality, and to illustrate how evolution algorithms and computational tools can be used alongside experiments to provide insights into how these conserved mechanisms can evolve. We first introduce key conserved properties of morphogen-driven patterning mechanisms, before summarising comparative studies that exemplify how changes in the spatiotemporal expression and signalling levels of morphogens impact the diversification of organ size, shape and patterning in nature. Finally, we detail how theoretical frameworks can be used in conjunction with experiments to probe the role of morphogen-driven patterning mechanisms in evolution. We conclude that morphogen-mediated patterning is an excellent model system and offers a generally applicable framework to investigate the evolution of developmental mechanisms.

Keywords: Evolution; GRNs; Morphogens; Patterning.


Conflict of interest statement

Competing interests The authors declare no competing or financial interests.

Figures

Figure 1
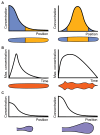
Figure 1. Conserved properties of morphogen-mediated patterning
A: Morphogens can pattern tissues in a concentration-dependent manner. (i) In the example shown, a local concentration above or below a threshold (dashed line) results in differentiation into different cell types (pink, yellow). This results in tissue patterning (below). (ii) When tissue size changes (from L1 in i to L2 in ii) but morphogen gradients do not scale, the proportions of the tissue pattern are distorted. In this example, the morphogen gradient remains completely unchanged following an increase in tissue length, reflected in an increase in the absolute size of only one cell type (yellow) and distortion of the pattern (relative size of pink or yellow regions). (iii) When the morphogen gradient scales, the boundaries that define cell types move proportionally to the tissue size, and pattern proportions are maintained when size changes. B: (i) The morphogen gradient in log scale for baseline (grey) and increased (black) production rates. A non-robust morphogen gradient exhibits a large shift Δx in the position of the cell type boundary it defines at a given concentration threshold (dashed line) following a shift in system parameters such as morphogen production. This is indicated by the same threshold in concentration (dashed line) reaching significantly different positions for the morphogen gradients shown in grey and black. (ii) Robust morphogen gradients can buffer changes in morphogen production so that cell type boundaries do not change in a target region far enough from the morphogen source. This corresponds to a value of Δx close to zero. C: A noisy morphogen gradient (black) and the positional errors corresponding to two specific concentration thresholds close to the morphogen source where the gradient is steep (positional error σ; orange), and further away where the gradient is shallow (positional error σ′; blue). The steeper the morphogen profile, the smaller the positional error and the more precise the morphogen readout.
Figure 2
Figure 2. Changes in morphogen expression and dynamics could impact developmental patterning and form.
Morphogens prescribe tissue patterning by specifying cell fate boundaries and tissue growth as a function of the spatial or temporal dynamics of morphogen signalling. A: The cartoon illustrates a tissue with a single boundary separating two cell fates (blue and yellow; left) as a response to a specific morphogen gradient. Changing the morphogen spatial expression and corresponding spatial morphogen signal (heterotopy) can lead to changes in the cell fate pattern (right). B: Variation in the temporal dynamics of morphogen signalling (heterochrony) can affect growth and patterning dynamics and the shape and patterning of tissues. The two cartoons indicate putative cases where changes in temporal dynamics in morphogen signalling alter tissue shape. C: Changes in the amplitude of the morphogen profile (heterometry) can influence tissue size, for example when up-regulation of the morphogen concentration leads to increased cell proliferation.
Figure 3
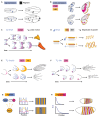
Figure 3. Examples where modulation of morphogen signalling maps to changes in patterning and form between species.
A: Spatial modulation of wg expression (blue) in developing Drosophila wings leads to variation in the spatial distribution of pigment (black), such as between the common ancestor of the D. quinaria and D. virilis species (upper) and the D. guttifera lineage (lower) (Werner et al., 2010). B: In Nymphalidae butterfly wings, WntA delineates the Central (CSS; pink) and Marginal Band Symmetry Systems (MBS; yellow) (Martin & Reed, 2014). Spatial modulation of wntA expression (blue) leads to changes in the position and shape of the Symmetry Systems between species. Examples indicative of Vanessa cardui (upper) and Agraulis incarnata (lower) are shown here (Hanly et al., 2023). C: Bmp4 (blue) specifies the spatiotemporal dynamics of Localised Growth Zones (LoGZ; pink) in the developing beak. Differences in the time of coalescence of LoGZ explain the morphology of the chick’s conical beak (upper) and duck’s broad beak (lower) (Wu et al., 2006). D: In the develop*-ing gut, Bmp2 (blue) expressed in the dorsal mesentery (DM; grey) regulates the growth (arrows) of the DM, thus perturbing the degree of differential growth between the DM and the gut tube (GT; yellow). Changes in Bmp2 expression levels lead to variation in the radius and wavelength of loops, such as between the mouse (upper) and zebra finch (lower) (Nerurkar et al., 2017). E: Increased Bmp2b activity (blue) promotes the persistence of the Apical Ectodermal Ridge (AER; pink) in the developing tetrapod limb (lower), inhibiting its transformation into an Apical Finfold (AF; yellow) and subsequent formation of rays as in the developing fin (upper) (Varga & Varga, 2022). F: Shh (blue) secreted from the Zone of Polarising Activity (ZPA; pink) acts to specify digits in mammals and lizards. Modulation of the spatiotemporal Shh activity affects the number of digits, for example more widespread up-regulation of Shh receptor Ptch1 in the mouse limb (upper) leads to a higher number of digits compared to the bovine limb (lower) (Lopez-Rios et al., 2014). G: Interactions between Wnt (blue) and its inhibitor (I; pink) can drive periodic patterns and underlie coat patterning in rodent species. Modulation of interactions between Wnt and I via the regulator Sfrp2 (yellow) can modulate the length-scale of Wnt expression that in turn impacts coat patterns. This model has been used to recapitulate the morphospace of spots and stripes observed across rodent species (Johnson et al., 2023). H: The decay length of Bcd (blue) scales with embryo size between higher Diptera species, leading to proportional patterning of the gap genes (yellow, orange, pink) between species of different sizes, such as D. melanogaster (upper) and D. busckii (lower) (Gregor et al., 2005).
Figure 4
Figure 4. Theoretical methods for studying the evolution of development.
A: Schematic example of a phase space analysis where two system parameters (a and b) are varied over significant ranges, and the areas where specific criteria or phenotypes are met are identified (blue, yellow and black). The parameters varied represent the ‘genotypes’, and can in theory be sampled from a high-dimensional phase space. B: Mutational studies explore how specific networks or mechanisms respond to mutation. Different colours represent different phenotypes accessible by varying the genotype. Genotypes that can access multiple phenotypes following a single mutation in any system parameter are highly evolvable (top right). Here, varying hypothetical system parameters a, b, c, d by small amounts Δa, Δb, Δc, Δd respectively lead to new genotypes G* that correspond to different phenotypes (pink, orange). These systems have reduced mutational robustness. Genotypes that cannot access multiple phenotypes (bottom right) are less evolvable as multiple mutations are required to change their phenotype. C: The general structure of an evolution algorithm. Following the generation of an initial system and its associated parameters, parameters are mutated and the system fitness is evaluated. Evolution is complete when the system reaches a pre-defined fitness threshold or when a mutation-selection balanced is reached so that no further improvement in fitness can be achieved. D: During Pareto evolution, the Pareto front (coloured triangles) represents the systems for which no property of interest (for example the hypothetical properties a and b) can be improved without worsening another. Pareto fronts are labelled for four different times during evolution (T1,2,3,4), with the arrow indicating the direction of system evolution perpendicular to the Pareto front. The values of properties are improved throughout evolution, and the final Pareto front (orange) defines the final co-optimised value of each system property at the end of evolution.

References

    1. Abzhanov A, Protas M, Grant BR, Grant PR, Tabin CJ. BMP4 and morphological variation of beaks in Darwin’s finches. Science. 2004;305(5689):1462–1465. - PubMed
    1. Adelmann JA, Vetter R, Iber D. Patterning precision under non-linear morphogen decay and molecular noise. eLife. 2023;12:e84757. doi: 10.7554/eLife.84757. - DOI - PMC - PubMed
    1. Adler M, Szekely P, Mayo A, Alon U. Optimal regulatory circuit topologies for fold-change detection. Cell Syst. 2017;4(2):171–181. - PubMed
    1. Aguilar-Hidalgo D, Werner S, Wartlick O, González-Gaitán M, Friedrich BM, Jülicher F. Critical point in self-organised tissue growth. Phys Rev Lett. 2018;120(19):198102. - PubMed
    1. Al-Mosleh S, Choi GP, Abzhanov A, Mahadevan L. Geometry and dynamics link form, function, and evolution of finch beaks. Proc Natl Acad Sci USA. 2021;118(46):e2105957118. doi: 10.1073/pnas.2105957118. - DOI - PMC - PubMed

LinkOut - more resources