Circulating Immune Cells from Early- and Late-onset Pre-eclampsia Displays Distinct Profiles with Differential Impact on Endothelial Activation
- PMID: 39302114
- PMCID: PMC11491498
- DOI: 10.4049/jimmunol.2400196
Circulating Immune Cells from Early- and Late-onset Pre-eclampsia Displays Distinct Profiles with Differential Impact on Endothelial Activation
Abstract
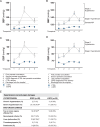
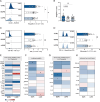
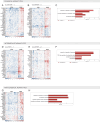
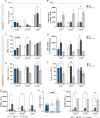
Pre-eclampsia (PE) affects 5-8% of pregnancies and has detrimental effects on maternal-fetal health. PE is characterized by de novo hypertension after 20 wk of gestation and end-organ damage. Systemic inflammatory imbalance has been associated with PE, but its contribution to the pathology is poorly understood. Our objective was to investigate maternal systemic immune changes in early-onset PE (EOPE) and late-onset PE (LOPE) versus uncomplicated pregnancies (control [CTRL]), and their contribution to endothelial activation, hallmark of hypertension. Blood samples were analyzed by flow cytometry, multiplex assay, intracellular cytokine staining, and single-cell RNA sequencing. We performed cocultures between circulating immune cells and HUVECs to assess endothelial activation. We found that EOPE had decreased regulatory T cells (4.64±0.33, p < 0.05) and monocytes (33.92±3.08, p < 0.01), whereas LOPE had decreased regulatory T cells (4.60±0.30, p < 0.05) and Th2 cells (7.50±0.62, p < 0.01) versus CTRL. Compared to CTRL, elevated cytokines/chemokines, and growth factors were observed in LOPE, whereas EOPE primarily showed decreased levels. Using intracellular cytokine staining, we observed more monocytes producing IL-12, TNF-α, and IL-1β (all p < 0.05) in LOPE versus CTRL. At the transcriptomic level, we found differentially expressed genes between EOPE and CTRL, predominantly related to upregulation of immune activation pathways. Lastly, EOPE PBMCs induced heightened endothelial activation in vitro observed by increased ICAM-1 and ET-1 (p < 0.05), whereas LOPE PBMCs required LPS stimulation. Although significant proteomic changes are observed in the LOPE group, the EOPE displayed changes mostly at the transcriptomic levels and could induce endothelial activation in vitro.
Copyright © 2024 by The American Association of Immunologists, Inc.
Conflict of interest statement
The authors have no financial conflicts of interest.
Figures


Similar articles
-
Comparison of the transcriptional profile in the decidua of early-onset and late-onset pre-eclampsia.J Obstet Gynaecol Res. 2020 Jul;46(7):1055-1066. doi: 10.1111/jog.14257. Epub 2020 Apr 12. J Obstet Gynaecol Res. 2020. PMID: 32281216
-
Vitamin D decreases cell death and inflammation in human umbilical vein endothelial cells and placental explants from pregnant women with preeclampsia cultured with TNF-α.Immunol Invest. 2022 Aug;51(6):1630-1646. doi: 10.1080/08820139.2021.2017452. Epub 2021 Dec 22. Immunol Invest. 2022. PMID: 34937520
-
Increased placental angiogenesis in late and early onset pre-eclampsia is associated with differential activation of vascular endothelial growth factor receptor 2.Placenta. 2014 Mar;35(3):207-15. doi: 10.1016/j.placenta.2014.01.007. Epub 2014 Jan 29. Placenta. 2014. PMID: 24508097
-
Mechanisms of Key Innate Immune Cells in Early- and Late-Onset Preeclampsia.Front Immunol. 2020 Aug 18;11:1864. doi: 10.3389/fimmu.2020.01864. eCollection 2020. Front Immunol. 2020. PMID: 33013837 Free PMC article. Review.
-
Global DNA methylation in placental tissues from pregnant with preeclampsia: A systematic review and pathway analysis.Placenta. 2020 Nov;101:97-107. doi: 10.1016/j.placenta.2020.09.004. Epub 2020 Sep 7. Placenta. 2020. PMID: 32942147
Cited by
-
Pre-eclampsia, gestational hypertension, and lipid levels during pregnancy: a systematic review and meta-analysis.Arch Gynecol Obstet. 2025 Aug;312(2):385-402. doi: 10.1007/s00404-025-08052-0. Epub 2025 May 23. Arch Gynecol Obstet. 2025. PMID: 40407883 Free PMC article. Review.
-
Trained innate immunity as a potential link between preeclampsia and future cardiovascular disease.Front Endocrinol (Lausanne). 2024 Dec 16;15:1500772. doi: 10.3389/fendo.2024.1500772. eCollection 2024. Front Endocrinol (Lausanne). 2024. PMID: 39741876 Free PMC article. Review.
References
-
- Magee, L. A., Brown M. A., Hall D. R., Gupte S., Hennessy A., Karumanchi S. A., Kenny L. C., McCarthy F., Myers J., Poon L. C., et al. . 2022. The 2021 International Society for the Study of Hypertension in Pregnancy classification, diagnosis & management recommendations for international practice. Pregnancy Hypertens. 27: 148–169. - PubMed
-
- Yang, C., Baker P. N., Granger J. P., Davidge S. T., Tong C.. 2023. Long-term impacts of preeclampsia on the cardiovascular system of mother and offspring. Hypertension 80: 1821–1833. - PubMed
-
- von Dadelszen, P., Magee L. A., Roberts J. M.. 2003. Subclassification of preeclampsia. Hypertens. Pregnancy 22: 143–148. - PubMed
-
- Staff, A. C., Benton S. J., von Dadelszen P., Roberts J. M., Taylor R. N., Powers R. W., Charnock-Jones D. S., Redman C. W. G.. 2013. Redefining preeclampsia using placenta-derived biomarkers. Hypertension 61: 932–942. - PubMed
MeSH terms
Substances
Grants and funding
LinkOut - more resources
Full Text Sources
Molecular Biology Databases
Miscellaneous

