

Soil nitrogen-related functional genes undergo abundance changes during vegetation degradation in a Qinghai-Tibet Plateau wet meadow
- PMID: 39302130
- PMCID: PMC11497797
- DOI: 10.1128/aem.00813-24
Soil nitrogen-related functional genes undergo abundance changes during vegetation degradation in a Qinghai-Tibet Plateau wet meadow
Abstract
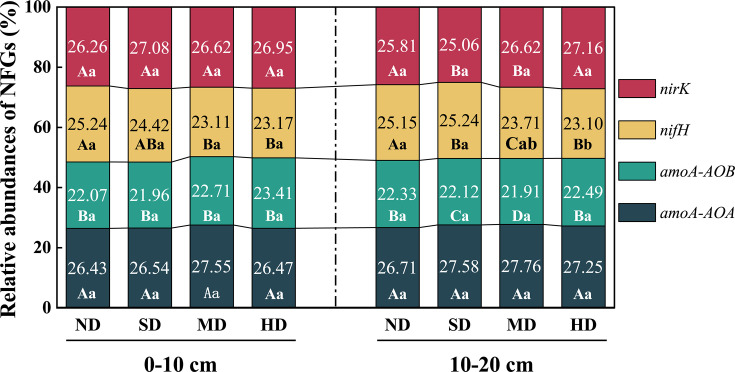
Climate change and anthropogenic activities have significantly contributed to the degradation of wet meadows on the Qinghai-Tibet Plateau (QTP). Soil nitrogen (N) availability is a crucial determinant of the productivity of wet meadow vegetation. Furthermore, soil microbial nitrogen functional genes (NFGs) are critical in the transformation of soil N. Nevertheless, the dynamics of NFGs in response to vegetation degradation, as well as the underlying drivers, remain poorly understood. In this study, wet meadows at varying levels of vegetation degradation on the QTP, categorized as non-degraded (ND), slightly degraded (SD), moderately degraded (MD), and heavily degraded (HD), were examined. Soil samples from depths of 0 to 10 cm and 10 to 20 cm were collected during different growth cycles (June 2020, August 2020, and May 2021). The analysis focused on NFGs involved in organic nitrogen fixation (nifH), archaeal and bacterial ammonia oxidation (amoA-AOA and amoA-AOB, respectively), and nitrite reduction (nirK), utilizing real-time fluorescence quantitative PCR. Our findings indicate a significant decline in the abundance of NFGs with intensified vegetation degradation, exhibiting notable spatial and temporal fluctuations. Specifically, the relative NFGs followed the pattern: nirK > amoA-AOA > amoA-AOB > nifH. Redundancy analysis revealed that vegetation cover was the primary regulator of NFGs abundance, accounting for 56.1%-57% of the variation. Additionally, soil total nitrogen, pH, and total phosphorus content were responsible for 38.5%, 28.2%, and 7% of the variability in NFGs, respectively. The (amoA-AOA + amoA-AOB + nirK) ratios associated with effective N transformation indicated that the vegetation degradation process moderately increased the nitrification potential.
Importance: Our research investigates how the degradation of meadows affects the tiny organisms in soil that help plants use nitrogen, which is essential for their growth. In the Qinghai-Tibet Plateau, a region known for its unique ecosystems, we found that as meadows deteriorate-due to climate change and human activities-the number of these beneficial organisms significantly decreases. This decline could reduce soil fertility, impacting plant life and the overall health of the ecosystem. Understanding these changes helps us grasp how environmental pressures influence soil and plant health. Such knowledge is crucial for developing strategies to preserve these vulnerable ecosystems and ensure they continue to sustain biodiversity and provide resources for local communities.
Keywords: nitrogen cycling; nitrogen functional genes; vegetation degradation process; wetland ecosystem.
Conflict of interest statement
The authors declare no conflict of interest.
Figures


References
-
- Axt JR, Walbridge MR. 1999. Phosphate removal capacity of palustrine forested wetlands and adjacent uplands in Virginia. Soil Sci Soc Am J 63:1019–1031. doi:10.2136/sssaj1999.6341019x - DOI
-
- Chon K, Chang J-S, Lee E, Lee J, Ryu J, Cho J. 2011. Abundance of denitrifying genes coding for nitrate (narG), nitrite (nirS), and nitrous oxide (nosZ) reductases in estuarine versus wastewater effluent-fed constructed wetlands. Ecol Eng 37:64–69. doi:10.1016/j.ecoleng.2009.04.005 - DOI
-
- Bai J, Cui B, Cao H, Li A, Zhang B. 2013. Wetland degradation and ecological restoration. Sci World J 2013:1–2. doi:10.1155/2013/523632 - DOI
-
- Davidson NC. 2014. How much wetland has the world lost? Long-term and recent trends in global wetland area. Mar Freshwater Res 65:934. doi:10.1071/MF14173 - DOI
MeSH terms
Substances
Grants and funding
- Carbon Seqestration and Sink Enhancement Technology in Degraded Wetlands in the Upper Reaches of The Yellow River in Gannan and Tanlent Cultivation
- 24ZYQA023/The Central Government Guide Local Science and Technology Development Funds In 2024
- 31860143/MOST | National Natural Science Foundation of China (NSFC)
- 2021CYZC-15/Gansu Provience Department of Education: Industrial Support Plan Project
LinkOut - more resources
Full Text Sources
