. 2024 Sep 16;16(18):12443-12472.
doi: 10.18632/aging.206111. Epub 2024 Sep 16.

Single housing of juveniles accelerates early-stage growth but extends adult lifespan in African turquoise killifish

Affiliations

Single housing of juveniles accelerates early-stage growth but extends adult lifespan in African turquoise killifish

Chika Takahashi et al. Aging (Albany NY). .

Abstract

Within the same species, individuals exhibiting faster growth tend to have shorter lifespans, even if their fast growth arises from early-life pharmacological interventions. However, in vertebrates, the impact of the early-life environment on the growth rate and lifespan has not been fully elucidated. In this study, by utilizing the short-lived African turquoise killifish, which is suitable for a comprehensive life-stage analysis in a brief timeframe, we explored the effects of housing density during the juvenile stage on holistic life traits. As a result, we found that lower housing densities resulted in faster growth, but led to longer adult lifespan, which was contrary to the common notion. Furthermore, the single-housed adult fish displayed a longer egg-laying period than did their group-housed counterparts. Our transcriptome analysis also demonstrated that, in terms of internal transcriptional programs, the life stage progression and aging process of single-housed fish were slower than those of group-housed fish. Collectively, our results suggest that sharing housing with others in early life might influence whole-life attributes, potentially leading to specific life history traits beyond the typical relationship between the growth rate and lifespan.

Keywords: African turquoise killifish; aging; growth; housing density; lifespan.


Conflict of interest statement

CONFLICTS OF INTEREST: The authors declare that they have no conflicts of interest.

Figures

Figure 1
Figure 1
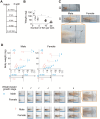
Lower housing densities in the juvenile stage accelerate body growth. (A) Schematic diagram showing the housing conditions. The hatched fish were kept at five different densities until three wph: 1, 2, 4, 10, and 40 fish per tank. (B) The graph shows their body weight at 3 wph under the housing conditions represented in (A). Each point represents an individual fish. The data were obtained for 13-28 fish at each density from a single experiment. The data are shown as the mean ± S.D. **, p < 0.01 by Tukey test. (C) Images are representative images of three-week-old fish under the group housing (40 fish per tank) and single housing (one fish per tank). The lower panels show higher magnification images of the boxed areas in the middle panels. The black arrows indicate fin coloration. The black lines in the images are drawn at 1 cm intervals. Blue scale bars, 1 cm. (D) Body weights at six different juvenile growth stages from 9 days posthatching (dph) to the onset of sexual maturity (group-housed fish; 35 dph, single-housed fish; 21 dph). The data were obtained from four samples at each stage. The data are shown as the mean ± S.D. Each point represents an individual fish. The blue and pink italic numbers represent the six weight-based stages of body growth in group- and single-housed fish, respectively (see methods section for detail). Representative images of fish at each weight-based growth stage under group housing (40 fish per tank) and single housing (one fish per tank). The black lines in the images are drawn at 1 cm intervals. Blue scale bars, 1 cm. Sex was confirmed by the expression level of a female-specific gene, zona pellucida sperm-binding protein 3 (XM_015945764.2). (AD) G: group-housed fish, S: single-housed fish.
Figure 2
Figure 2
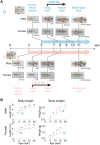
Body growth from the onset of sexual maturity to the old stage. (A) Representative images of male and female fish at the following four different life stages are shown: onset of sexual maturity, young adult, mature adult, and middle-aged adult. The numbers in the lower right corner of the images indicate the body length of the fish observed at each life stage. The arrows indicate fin coloration. The black lines in the images are drawn at 1 cm intervals. Blue scale bars, 1 cm. (B) Body length and body weight at each age after the onset of sexual maturity to the old stage (20 wph). The blue points indicate group-housed fish; the pink points indicate single-housed fish. Each point represents an individual fish. The data were obtained for 9-20 fish at each age from pooled data from one (group housing) and four (single housing) independent experiments. The data are shown as the mean ± S.D. *, p < 0.05; **, p < 0.01; ns, not significant by the Tukey test. (A, B) G: group-housed fish, S: single-housed fish.
Figure 3
Figure 3
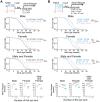
Lower housing densities in the juvenile stage extend adult lifespan. (A, B) The schemes for measuring the adult lifespan from reaching the young adult stage are shown at the top. The hatched fish were reared at a density of 1 or 40 fish per tank (A) or 1, 2, or 10 fish per tank (B) until 3 wph. After 3 wph, all the fish were reared individually. The age at which the fish reached the young adult stage was defined as zero weeks of adult age. The Kaplan–Meier survival curves (three independent experiments were pooled) of adult males (upper panel), females (middle panel), and both males and females (lower panel) are shown. The percentage indicates the rate of increase in the average lifespan. *, p < 0.05; **, p < 0.01 by log-rank test. The three lowest graphs show the mean lifespan. Each point represents the mean lifespan in each independent experiment. The data are shown as the mean ± S.D. *, p < 0.05; **, p < 0.01; ns, not significant by the log-rank test. G: group-housed fish, S: single-housed fish, N: number of fish analyzed.
Figure 4
Figure 4
Single-housed fish have a longer egg-laying period than group-housed fish. (A) Temporal changes in the number of eggs laid by group- and single-housed fish. Six breeding tanks were prepared one week after the fish reached the young adult stage, and the number of embryos was counted once a week. The left vertical axis represents the number of viable embryos. The thick lines represent the average number of embryos in the six experimental tanks; the thin lines represent the number of embryos in each tank. The thick, blue or pink horizontal lines labeled “H” represent a high fecundity period; the medium lines marked “M” represent a medium fecundity period; and the thin lines labeled “L” represent a low fecundity period. The right vertical axis and black dashed line represent the survival rate and the Kaplan–Meier survival curves of all the fish used in this experiment, respectively. (B) Cumulative number of live embryos obtained at high and medium fecundity levels. *, p < 0.05 by t-test. Each point represents an individual tank. (A, B) G: group-housed fish, S: single-housed fish.
Figure 5
Figure 5
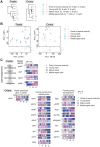
The rate of gonadal transcriptional change with life-stage progression in single-housed fish is slower than that in group-housed fish. RNA sequencing of testes and ovaries from group- and single-housed fish at the following four different life stages: onset of sexual maturity, young adult, mature adult, and middle-aged adult. The data were obtained from two or three samples at each life stage. (A) The dendrograms represent the hierarchical clustering of the samples based on the similarity of the changes in the average expression at each life stage for gene sets with TPM > 10 in at least one sample. (B) PCA plots prepared using VST values of the genes with TPM > 10 in at least one sample. Each number represents an individual sample at each growth stage. The black arrows in the left plot of the testis show the group- and single-housed fish at the young adult stage. *, p < 0.05 by t-test and Kruskal-Wallis test. (C) Changes in the individual expression of germ cell marker genes at each stage of spermatogenesis, early-oogenesis-related genes, oocyte-construction-related genes and female-gonad-development-related genes. piwil1, piwi-like RNA-mediated gene silencing 1; dazl, deleted in azoospermia-like; sycp3, synaptonemal complex protein 3; odf3b, outer dense fiber of sperm tails 3B; tdrd1, tudor domain containing 1; tdrd7a, tudor domain containing 7a; tdrd6, tudor domain containing 6; tdrd15, tudor domain containing 15; dctn2, dynactin 2; pld6, phospholipase D family, member 6; buc, bucky ball; pum1, pumilio RNA-binding family member 1; tdrkn, tudor and KH domain containing; figla, folliculogenesis specific bHLH transcription factor; ythdf2, YTH N6-methyladenosine RNA binding protein F2; lhcgr, luteinizing hormone/choriogonadotropin receptor; cyp19a1a, cytochrome P450, family 19, subfamily A, polypeptide 1a; pla2g4ab, phospholipase A2, group IVAb; fshr, follicle stimulating hormone receptor; ythdf3, YTH N6-methyladenosine RNA binding protein F3; pgrmc1, progesterone receptor membrane component 1. (AC) G: group-housed fish, S: single-housed fish.
Figure 6
Figure 6
Comparison of liver gene expression profiles between group- and single-housed fish in early and late adulthood. (A) Schematic diagram showing the sampling for RNA sequencing of livers at 7 and 14 wph. At each age, 9-10 fish were sampled. (B) Correlation coefficients between samples in the gene sets with TPM > 10 in at least one sample. (C) The upper panel shows a Venn diagram of the DEGs (> 1.5-fold change, padj < 0.01) between 7 wph and 14 wph in either group- or single-housed fish (1588 genes). The lower panel shows hierarchical clustering of the samples based on the similarity of the changes in expression of the 1588 age-related genes. (D, E) TPM values of cell senescence markers (D) and SASP factors (E). Each circle represents an individual sample. **, padj < 0.01 by DESeq2. p21, cyclin dependent kinase inhibitor 1A; p53, tumor protein p53; p16, cyclin dependent kinase inhibitor 2A; tfa, transferrin-a; serping1, serpin family G member 1; tmem176, transmembrane protein 176; g0s2, G0/G1 switch 2; serpina1, serpin family A member 1; apoeb, apolipoprotein Eb; cd302, CD302 molecule; cst3, cystatin C; psap, prosaposin; cxcl12a, chemokine (C-X-C motif) ligand 12a; fcer1g, Fc epsilon receptor IgFc epsilon receptor Ig; ctss2.1, cathepsin S, ortholog2, tandem duplicate 1; aif1, allograft inflammatory factor 1-like; il-8, interleukin-8; il-10, interleukin-10. (AE) G: group-housed fish, S: single-housed fish.
Figure 7
Figure 7
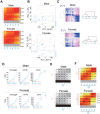
The rate of whole-body transcriptional change with the progression of the juvenile growth stage in single-housed fish is slightly slower than that in group-housed fish. RNA sequencing of the whole bodies of the juveniles (stages 1-6) shown in Figure 1D. The data were obtained from four samples at each stage. (A) Heatmaps showing the correlation coefficients between all samples for genes with TPM > 10 in at least one sample. The dashed squares show the correlation coefficients between group- and single-housed fish at the same growth stage. (B) PCA plots using VST values of the genes with TPM > 10 in at least one sample. Each italicized number represents an individual sample at each growth stage. Each circle represents a value of PC1/2 in an individual sample. (C) Heatmaps showing changes in the average expression at each growth stage for the common DEGs (stage 1/2 vs. stage 6) between group- and single-housed juveniles (See Venn diagrams in Supplementary Figures 5-6; males, 714 DEGs; females, 706 DEGs). The right dendrograms represent the hierarchical clustering of the samples based on the similarity of changes in expression (D) Examples of the expression of the immune response-related genes that were enriched among the common DEGs (stage 1/2 vs. stage 6) between group- and single-housed juveniles (See Venn diagrams in Supplementary Figures 5-6). The TPM values are shown. Each circle represents an individual sample. mhc2dgb, major histocompatibility complex class II DGB gene; cd74b, CD74 molecule; b2ml, beta-2-microglobulin, like. (E) Number of DEGs with > 4-fold (padj < 0.01) differences in at least one of the two-group comparisons among the genes with TPM > 50 in at least one sample. (F) Heatmaps showing the correlation coefficients between samples in genes whose expression changed substantially with body growth. (AF) G: group-housed fish, S: single-housed fish. The blue and pink italic numbers represent the six weight-based stages of body growth in group- and single-housed fish, respectively.

References

    1. Vijg J, Campisi J. Puzzles, promises and a cure for ageing. Nature. 2008; 454:1065–71. 10.1038/nature07216 - DOI - PMC - PubMed
    1. Marchionni S, Sell C, Lorenzini A. Development and Longevity: Cellular and Molecular Determinants - A Mini-Review. Gerontology. 2020; 66:223–30. 10.1159/000505327 - DOI - PubMed
    1. López-Otín C, Blasco MA, Partridge L, Serrano M, Kroemer G. Hallmarks of aging: An expanding universe. Cell. 2023; 186:243–78. 10.1016/j.cell.2022.11.001 - DOI - PubMed
    1. Wu Z, Qu J, Zhang W, Liu GH. Stress, epigenetics, and aging: Unraveling the intricate crosstalk. Mol Cell. 2024; 84:34–54. 10.1016/j.molcel.2023.10.006 - DOI - PubMed
    1. de Magalhães JP, Costa J, Church GM. An analysis of the relationship between metabolism, developmental schedules, and longevity using phylogenetic independent contrasts. J Gerontol A Biol Sci Med Sci. 2007; 62:149–60. 10.1093/gerona/62.2.149 - DOI - PMC - PubMed

Supplementary concepts