. 2024 Dec;49(12):3356-3366.
doi: 10.1007/s11064-024-04243-4. Epub 2024 Sep 20.

High-fat and High-sucrose Diet-induced Hypothalamic Inflammation Shows Sex Specific Features in Mice

Affiliations

High-fat and High-sucrose Diet-induced Hypothalamic Inflammation Shows Sex Specific Features in Mice

Gabriela C De Paula et al. Neurochem Res. 2024 Dec.

Abstract

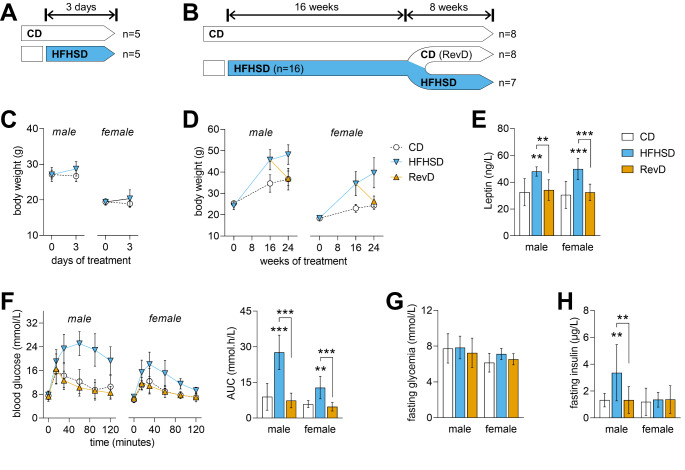
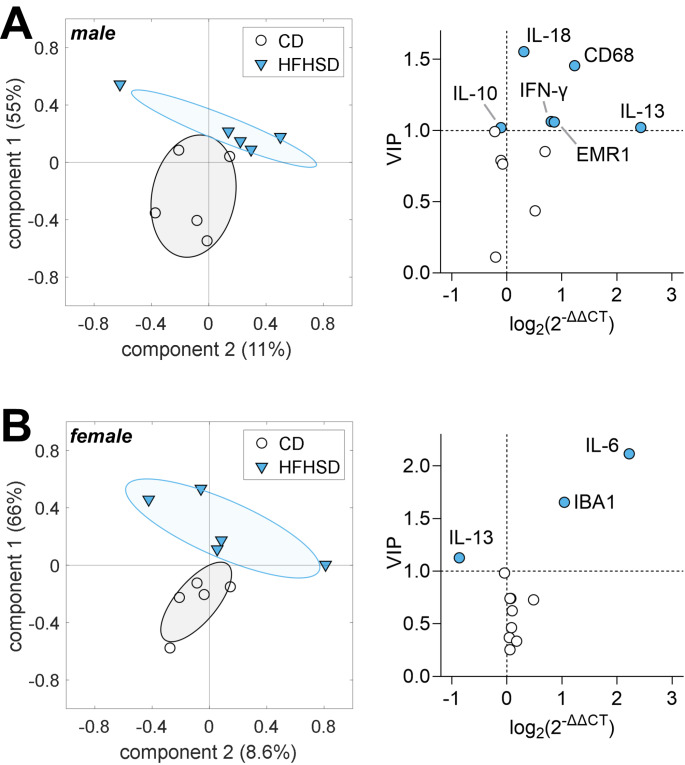
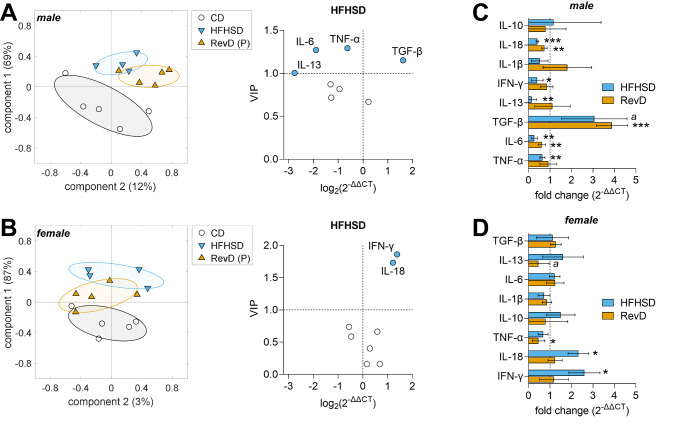
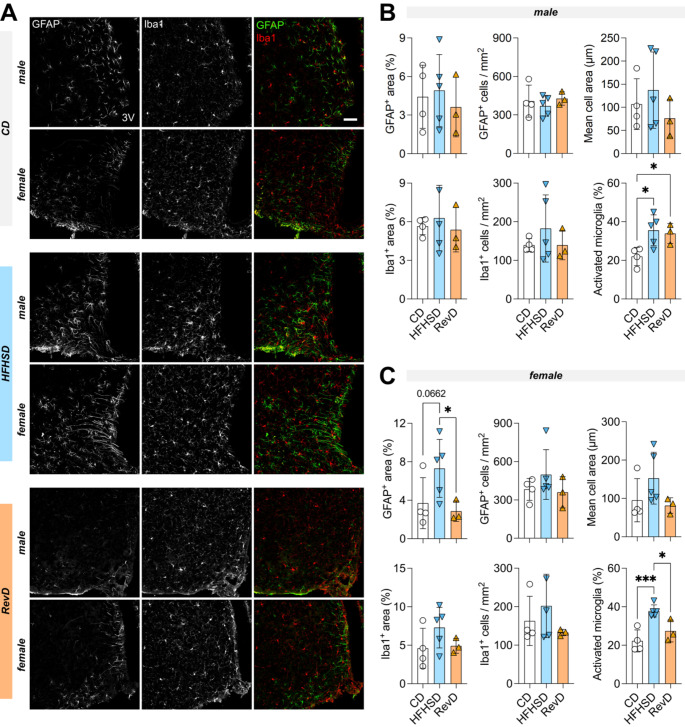
Hypothalamic inflammation underlies diet-induced obesity and diabetes in rodent models. While diet normalization largely allows for recovery from metabolic impairment, it remains unknown whether long-term hypothalamic inflammation induced by obesogenic diets is a reversible process. In this study, we aimed at determining sex specificity of hypothalamic neuroinflammation and gliosis in mice fed a fat- and sugar-rich diet, and their reversibility upon diet normalization. Mice were fed a 60%-fat diet complemented by a 20% sucrose drink (HFHSD) for 3 days or 24 weeks, followed by a third group that had their diet normalized for the last 8 weeks of the study (reverse diet group, RevD). We determined the expression of pro- and anti-inflammatory cytokines, and of the inflammatory cell markers IBA1, CD68, GFAP and EMR1 in the hypothalamus, and analyzed morphology of microglia (IBA-1+ cells) and astrocytes (GFAP+ cells) in the arcuate nucleus. After 3 days of HFHSD feeding, male mice showed over-expression of IL-13, IL-18, IFN-γ, CD68 and EMR1 and reduced expression of IL-10, while females showed increased IL-6 and IBA1 and reduced IL-13, compared to controls. After 24 weeks of HFHSD exposure, male mice showed a general depression in the expression of cytokines, with prominent reduction of TNF-α, IL-6 and IL-13, but increased TGF-β, while female mice showed over-expression of IFN-γ and IL-18. Furthermore, both female and male mice showed some degree of gliosis after HFHSD feeding for 24 weeks. In mice of both sexes, diet normalization after prolonged HFHSD feeding resulted in partial neuroinflammation recovery in the hypothalamus, but gliosis was only recovered in females. In sum, HFHSD-fed mice display sex-specific inflammatory processes in the hypothalamus that are not fully reversible after diet normalization.

Keywords: Cytokines; Gliosis; High fat; Neuroinflammation; Reverse diet; Sucrose.


Conflict of interest statement

The authors declare no competing interests.

Figures

Fig. 1
Fig. 1
Experimental study design and number of mice (n) per sex in the experimental group (A-B), body weight (C-D), and metabolic assessments after 24 weeks of dietary intervention (E-H). Body weight of male and female mice shows obesity development upon HFHSD feeding, and recovery after diet normalization (RevD) (D). Plasma leptin levels after 24 weeks of dietary intervention is increased by HFHSD and normalised in RevD (E). Glucose clearance in GTT was reduced by HFHSD feeding, and the area under the curve (AUC) of the GTT shows full recovery after diet normalization (F). Fasting glycemia (G) and plasma insulin levels (H) are indicative of HFHSD-induced insulin resistance in males but not females. Data shown as mean ± SD of n = 5-as depicted in (A-B); **P < 0.01, ***P < 0.001 for comparing HFHSD versus CD or as indicated
Fig. 2
Fig. 2
HFHSD feeding for 3 days induced gender-specific hypothalamic inflammation, that is, differential gene expression changes were observed in male (A) and female (B) mice. Graphs on the left show mouse grouping for components 1 and 2 of the PLS regression. Individual mice are represented by symbols, and group SD by ellipsoids. Variance explained by each component is shown in parenthesis. Graphs on the right show fold-change of gene expression, and VIP scores calculated from the resulting PLS model. Filled symbols represent VIP > 1. Data shown as mean ± SD of n = 5 for each group
Fig. 3
Fig. 3
HFHSD feeding for 24 weeks induced gender-specific hypothalamic inflammation, that is, differential gene expression changes were observed in male (A) and female (B) mice. PLS regression models were constructed for HFHSD and CD, and then used to calculate the component space for predicting effects of diet normalization in RevD (P). Graphs on the left show mouse grouping for components 1 and 2 of the PLS regression. Individual mice are represented by symbols, and group SD by ellipsoids. Variance explained by each component is shown in parenthesis. Graphs on the right show fold-change of gene expression for HFHSD and RevD relative to CD, and VIP scores calculated from the resulting PLS model. Filled symbols represent VIP > 1. Panels C and D show gene expression in HFHSD and RevD mice relative to control CD (mean ± SD of n = 5 for each group). Crescent VIP scores are represented from top to bottom. Significance for one sample t-test comparisons to 1 are indicated as follows *P < 0.05, **P < 0.01, ***P < 0.001 (aP = 0.07)
Fig. 4
Fig. 4
Astrogliosis and microgliosis in the arcuate nucleus of male and female mice. (A) representative micrographs of astrocytes (GFAP+ cells, green) and microglia (IBA1+ cells, red) cells in the arcuate nucleus (scale bar is 50 μm). Total GFAP stained area, number of GFAP+ cells or mean cell area were evaluated for astrogliosis while IBA1 stained area, number of IBA1+ cells or fraction of activated microglia (poorly ramified cells) were evaluated in male (B) and female (C) mice. Bars are mean ± SD of n = 4 (CD), n = 5 (HFHSD), n = 3 (RevD), and symbols represent individual mice. *p < 0.05, ***P < 0.001 from Fisher’s LSD test after significant ANOVA

References

    1. Collaboration NRF (2016) Trends in adult body-mass index in 200 countries from 1975 to 2014: a pooled analysis of 1698 population-based measurement studies with 19.2 million participants. Lancet 387(10026):1377–1396 - PMC - PubMed
    1. Wong MCS et al (2020) Global, regional and time-trend prevalence of central obesity: a systematic review and meta-analysis of 13.2 million subjects. Eur J Epidemiol 35(7):673–683. 10.1007/s10654-020-00650-3 - PMC - PubMed
    1. González-Muniesa P, Mártinez-González MA (2017) Obesity. Nat Rev Dis Primers 3:17034. 10.1038/nrdp.2017.34 - PubMed
    1. Williams EP, Mesidor M, Winters K, Dubbert PM, Wyatt SB (2015) Overweight and obesity: prevalence, consequences, and causes of a growing Public Health Problem. Curr Obes Rep 4(3):363–370. 10.1007/s13679-015-0169-4 - PubMed
    1. McAllister EJ, Dhurandhar NV, Keith SW et al (2009) Ten putative contributors to the obesity epidemic. Crit Rev Food Sci Nutr 49(10):868–913. 10.1080/10408390903372599 - PMC - PubMed

LinkOut - more resources