

Pharmacokinetics of once-daily darunavir/ritonavir in second-line treatment in African children with HIV
- PMID: 39302766
- PMCID: PMC11531812
- DOI: 10.1093/jac/dkae319
Pharmacokinetics of once-daily darunavir/ritonavir in second-line treatment in African children with HIV
Abstract
Background: Darunavir is a potent HIV protease inhibitor with a high barrier to resistance. We conducted a nested pharmacokinetic sub-study within CHAPAS-4 to evaluate darunavir exposure in African children with HIV, taking once-daily darunavir/ritonavir for second-line treatment.
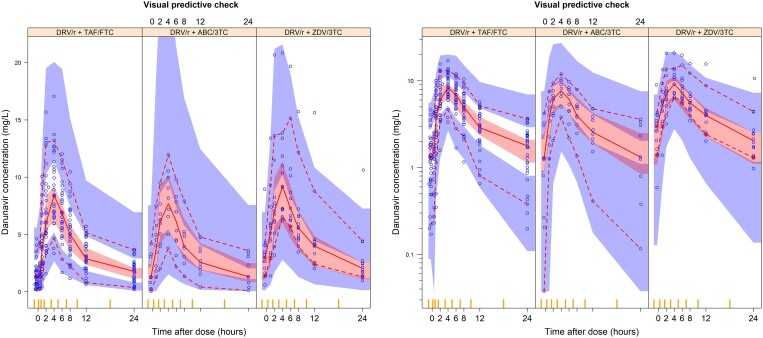
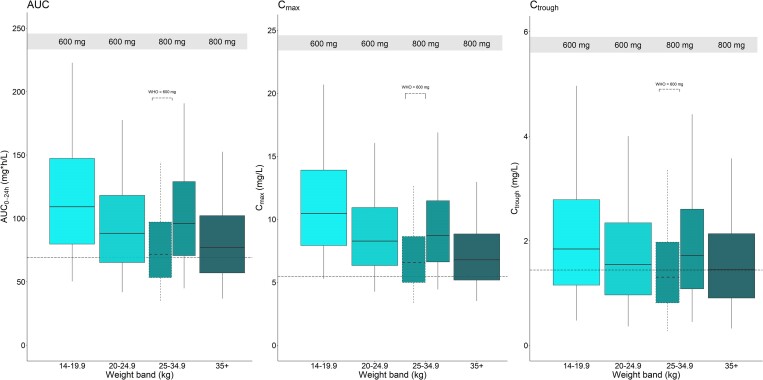
Methods: We used data from the CHAPAS-4 pharmacokinetic sub-study treating children with once-daily darunavir/ritonavir (600/100 mg if 14-24.9 kg and 800/100 mg if ≥25 kg) with either tenofovir alafenamide fumarate (TAF)/emtricitabine (FTC), abacavir/lamivudine or zidovudine/lamivudine. Steady-state pharmacokinetic sampling was done at 0, 1, 2, 4, 6, 8, 12 and 24 hours after observed darunavir/ritonavir intake. Non-compartmental and population pharmacokinetic analyses were used to describe the data and identify significant covariates. Reference adult pharmacokinetic data were used for comparison. We simulated the World Health Organization (WHO) recommended 600/100 mg darunavir/ritonavir dose for the 25-34.9 kg weight band.
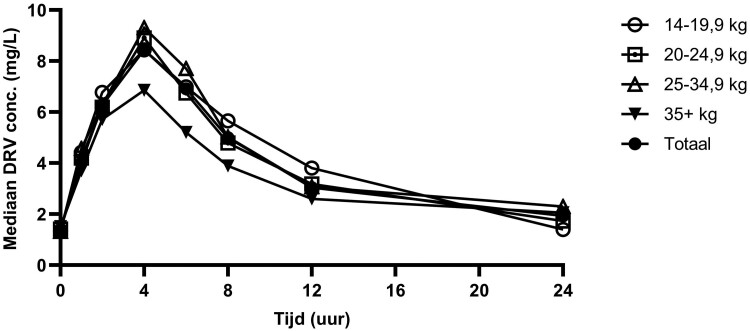
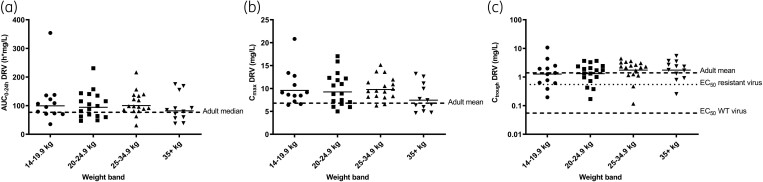
Results: Data from 59 children with median age and weight 10.9 (range 3.8-14.7) years and 26.0 (14.5-47.0) kg, respectively, were available. A two-compartment disposition model with transit absorption compartments and weight-based allometric scaling of clearance and volume best described darunavir data. Our population achieved geometric mean (%CV) darunavir AUC0-24h, 94.3(50) mg·h/L and Cmax, 9.1(35) mg/L, above adult reference values and Ctrough, 1.5(111) mg/L, like adult values. The nucleoside reverse-transcriptase inhibitor backbone was not found to affect darunavir concentrations. Simulated WHO-recommended darunavir/ritonavir doses showed exposures equivalent to adults. Higher alpha-1-acid glycoprotein increased binding to darunavir and decreased apparent clearance of darunavir.
Conclusions: Darunavir exposures achieved in our trial are within safe range. Darunavir/ritonavir can safely be co-administered with TAF/FTC. Both WHO-recommended 600/100 mg and CHAPAS-4 800/100 mg darunavir/ritonavir doses for the 25-34.9 kg weight band offer favourable exposures. The choice between them can depend on tablet availability.
© The Author(s) 2024. Published by Oxford University Press on behalf of British Society for Antimicrobial Chemotherapy.
Figures
References
-
- UNAIDS . Global HIV statistics. Global HIV & AIDS statistics — Fact sheet. Fact Sheet 2022; (June):1–3. UNAIDS.
-
- UNAIDS . UNAIDS Global AIDS Update — Confronting inequalities — Lessons for pandemic responses from 40 years of AIDS. Global AIDS Update. 2021; 3862021.
-
- World Health Organization . Consolidated Guidelines on HIV Prevention, Testing, Treatment, Service Delivery and Monitoring: Recommendations for a Public Health Approach. WHO, 2021; 548. - PubMed
Publication types
MeSH terms
Substances
Grants and funding
LinkOut - more resources
Full Text Sources
Medical
