. 2024 Oct 3;15(39):9871-9880.
doi: 10.1021/acs.jpclett.4c02352. Epub 2024 Sep 20.

Absolute Binding Free Energies with OneOPES

Affiliations

Absolute Binding Free Energies with OneOPES

Maurice Karrenbrock et al. J Phys Chem Lett. .

Abstract

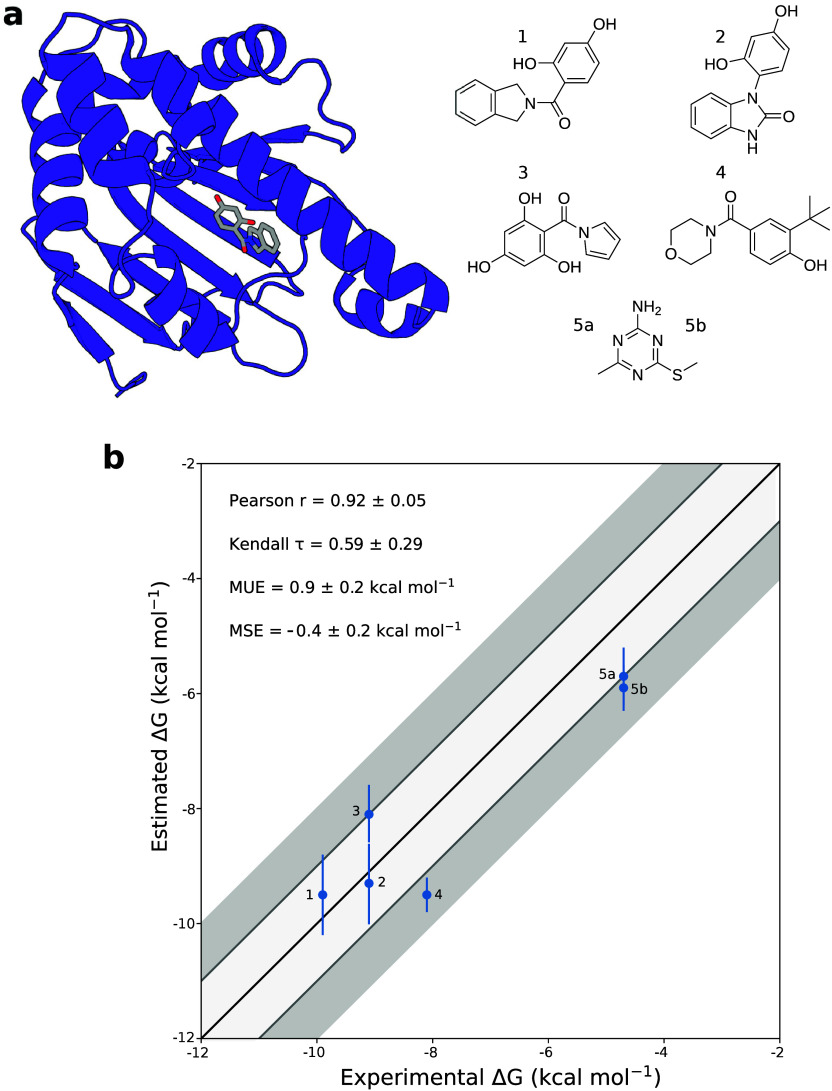
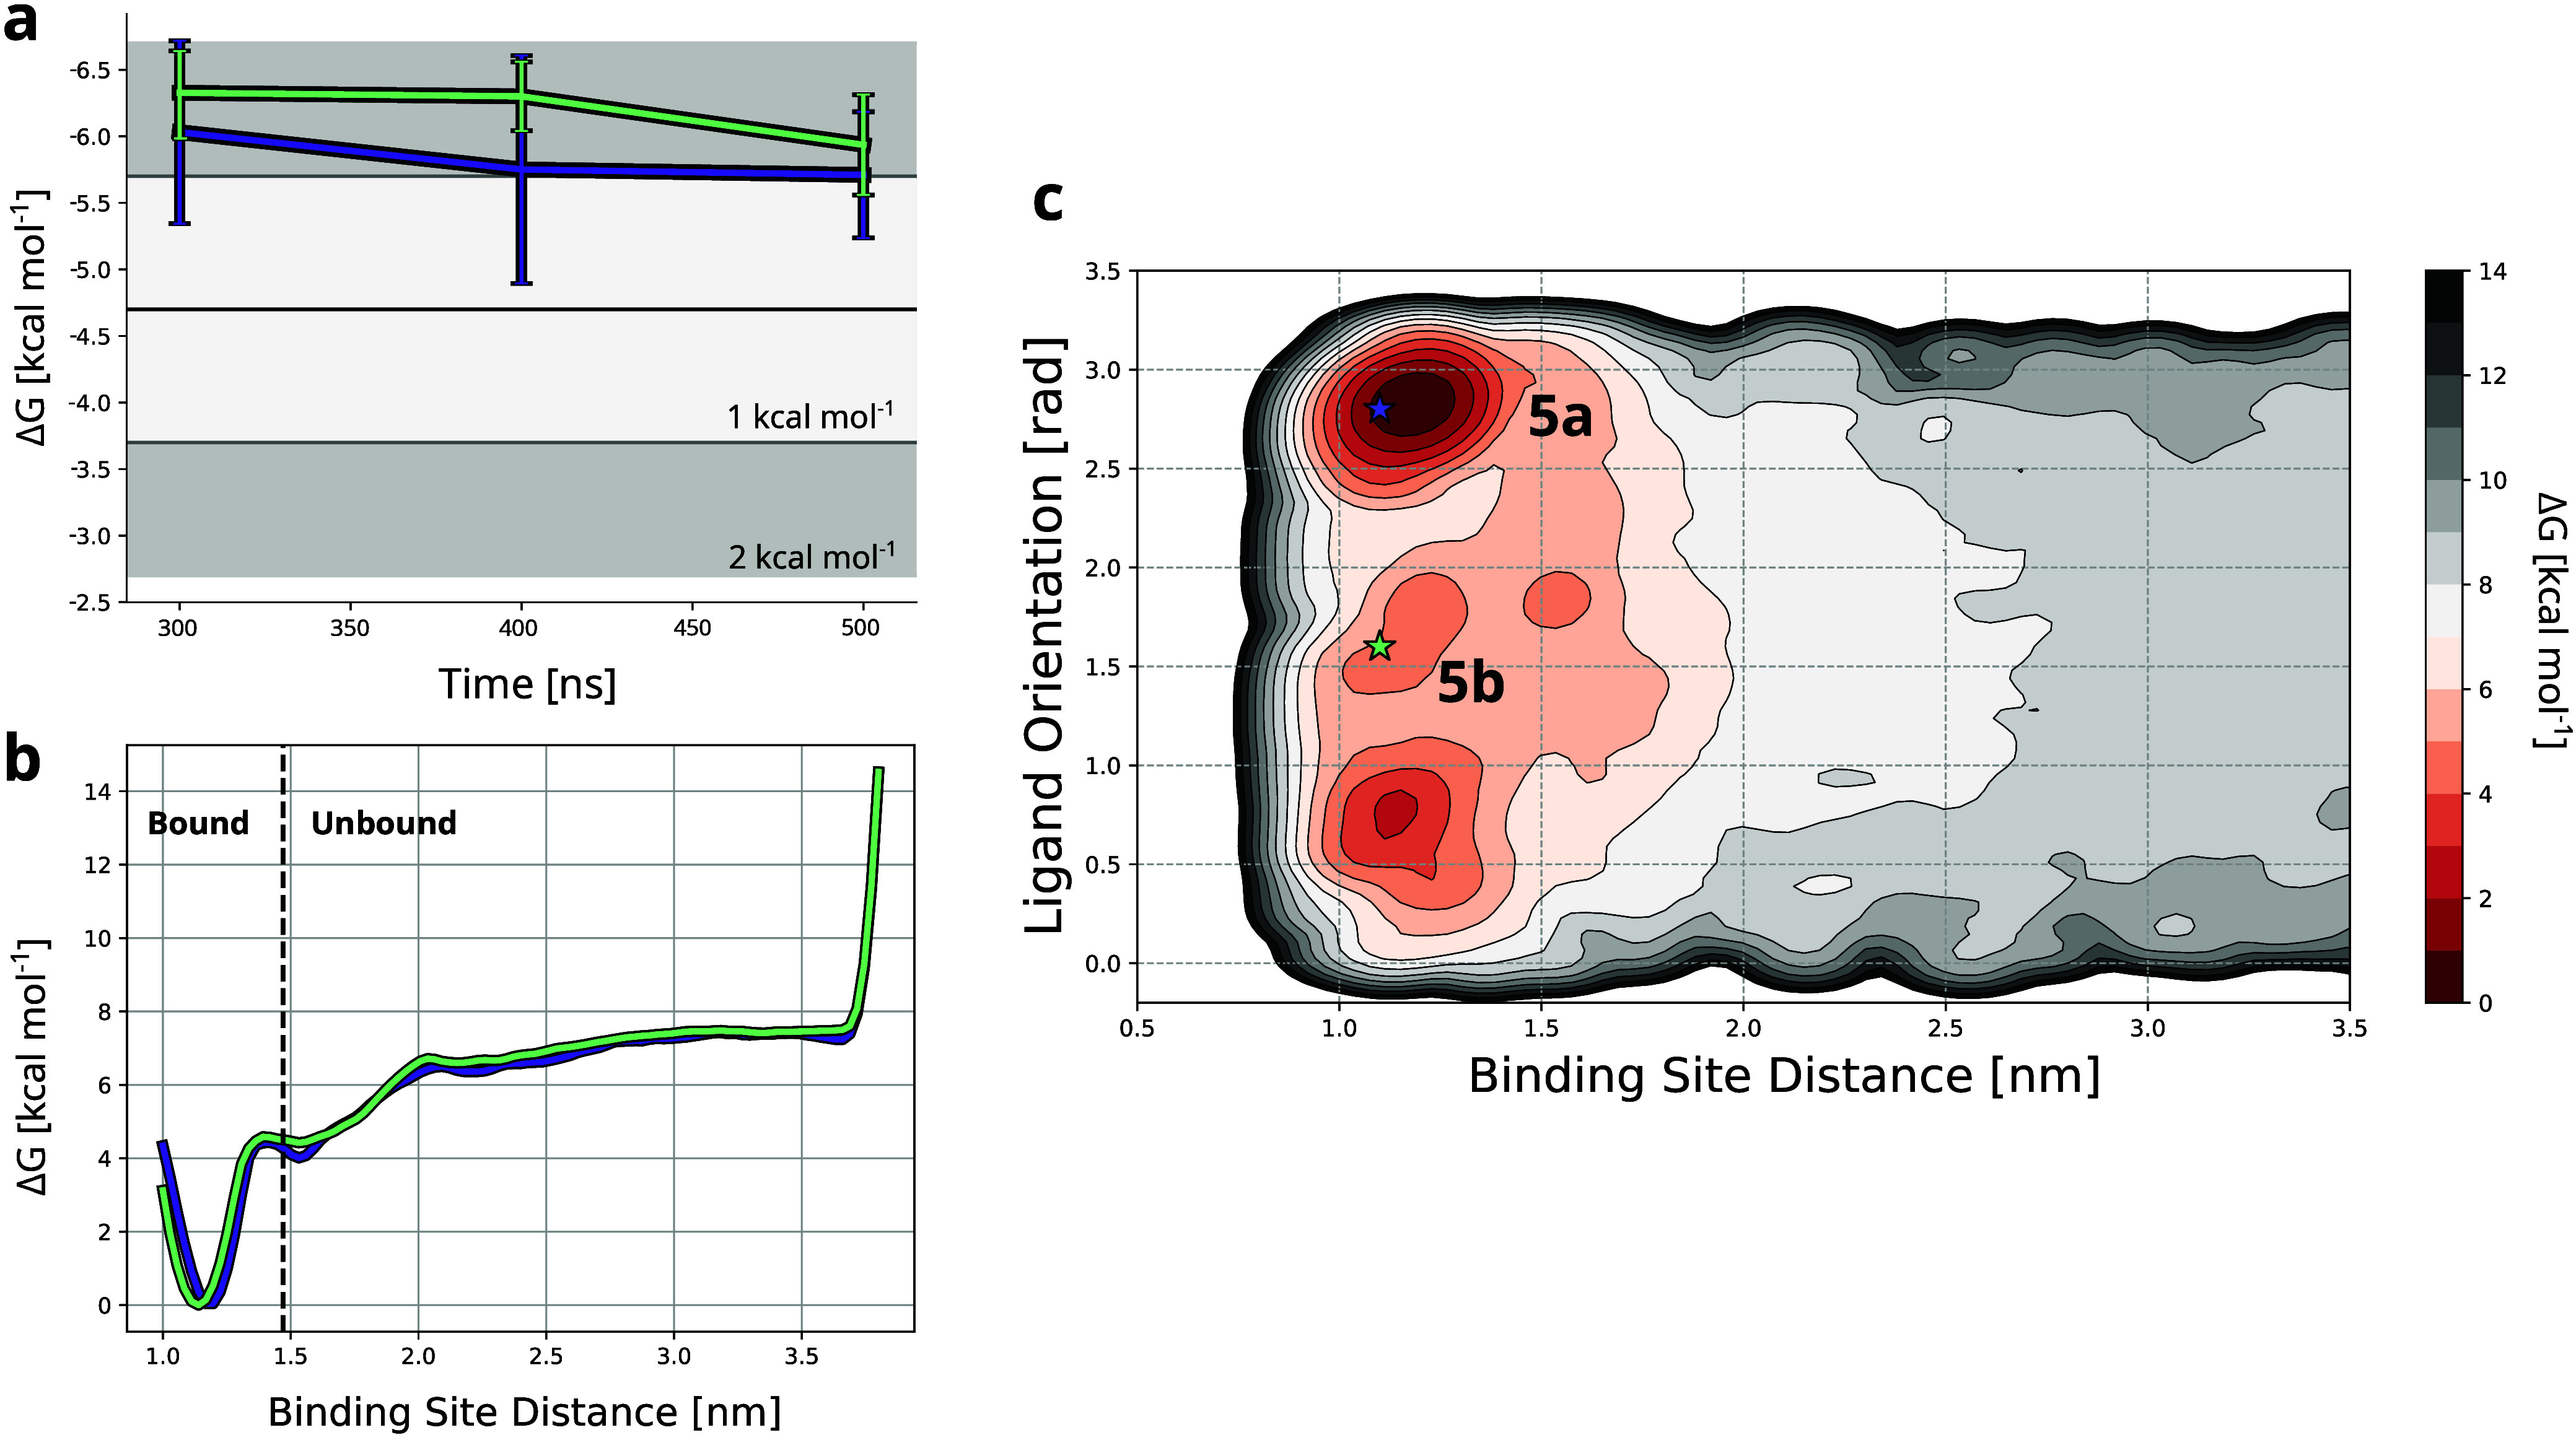
The calculation of absolute binding free energies (ABFEs) for protein-ligand systems has long been a challenge. Recently, refined force fields and algorithms have improved the quality of the ABFE calculations. However, achieving the level of accuracy required to inform drug discovery efforts remains difficult. Here, we present a transferable enhanced sampling strategy to accurately calculate absolute binding free energies using OneOPES with simple geometric collective variables. We tested the strategy on two protein targets, BRD4 and Hsp90, complexed with a total of 17 chemically diverse ligands, including both molecular fragments and drug-like molecules. Our results show that OneOPES accurately predicts protein-ligand binding affinities with a mean unsigned error within 1 kcal mol-1 of experimentally determined free energies, without the need to tailor the collective variables to each system. Furthermore, our strategy effectively samples different ligand binding modes and consistently matches the experimentally determined structures regardless of the initial protein-ligand configuration. Our results suggest that the proposed OneOPES strategy can be used to inform lead optimization campaigns in drug discovery and to study protein-ligand binding and unbinding mechanisms.


Conflict of interest statement

The authors declare no competing financial interest.

Figures

Figure 1
Figure 1
Schematic of our OneOPES strategy for protein–ligand binding.Top-left panel: example of the two main CVs biased with OneOPES, the protein–ligand distance, shown as a cyan line, and the protein–ligand contact map. A funnel-shaped restraint is applied along the protein–ligand distance vector. Bottom-left panel: examples of the auxiliary CVs accelerated with OneOPES, i.e., hydration sites, both within the protein binding site and some ligand atoms, and ligand torsions. Right panel: illustration of the replica exchange and the thermal gradient used in our OneOPES simulations. The combination of different enhanced sampling schemes allows for the exploration of several ligand binding modes, resulting in accurate binding free energy surfaces.
Figure 2
Figure 2
Structures of the BRD4-ligand complexes and free energy correlation plots.(a) Structural representation of a BRD4-ligand complex (left, PDB ID: 4OGJ) and chemical structure of the ligands presented in this work (right). The secondary structure of the protein is shown in cyan, and the ligand is shown as sticks. Carbon, nitrogen, oxygen, and sulfur ligand atoms are shown in gray, blue, red, and yellow, respectively. The different ligands are listed in decreasing order of affinity for the BRD4 binding site. (b) Correlation plots of experimental versus calculated binding free energies obtained using OneOPES and either the OPC (left) or TIP3P (right) water model. The dark gray shaded area represents a deviation of ±2 kcal mol–1 from the experimental values, while the light gray corresponds to a deviation of ±1 kcal mol–1. The ideal correlation is shown as a black line.
Figure 3
Figure 3
Structures of the Hsp90-ligand complexes and free energy correlation plots.(a) Structural representation of a Hsp90-ligand complex (left, PDB ID: 3K99) and chemical structure of the ligands presented in this work (right). The secondary structure of the protein is shown in purple, and the ligand is shown as sticks. Carbon, nitrogen, and oxygen ligand atoms are shown in gray, blue, and red, respectively. The different ligands are listed in descending order of affinity for the Hsp90 binding site. (b) Correlation plots of experimental versus calculated binding free energies obtained using OneOPES. The dark gray shaded area represents a deviation of ±2 kcal mol–1 from the experimental values, while the light gray corresponds to a deviation of ±1 kcal mol–1. The ideal correlation is shown as a black line.
Figure 4
Figure 4
Sampling of different ligand binding modes with OneOPES.(a) Binding free energy estimates as a function of different simulation times of the two binding poses of ligand 5. The purple and green lines correspond to two different OneOPES simulations starting from binding poses 5a and 5b, respectively. The first 200 ns of the simulation were considered as equilibration (see Table S5). The dark gray shaded area represents a deviation of ±2 kcal mol–1 from the experimental values, while the light gray corresponds to a deviation of ±1 kcal mol–1. The experimental binding free energy is shown as a black line. (b) 1D free energy projection on the ligand-binding site distance for the two simulations of binding poses 5a and 5b, shown in purple and green, respectively. The distance at which the ligand is considered unbound is indicated by the dashed black line. (c) 2D free energy map for the binding of ligand 5 to Hsp90, plotted as a function of the ligand’s distance from the binding site and its orientation. The minima corresponding to the two different binding modes are marked by purple and green stars, representing poses 5a and 5b, respectively. The free energy map was obtained from the simulation starting from binding pose 5a.

References

    1. Talele T.; Khedkar S.; Rigby A. Successful Applications of Computer Aided Drug Discovery: Moving Drugs from Concept to the Clinic. Current Topics in Medicinal Chemistry 2010, 10, 127–141. 10.2174/156802610790232251. - DOI - PubMed
    1. Schindler C. E. M.; Baumann H.; Blum A.; Böse D.; Buchstaller H.-P.; Burgdorf L.; Cappel D.; Chekler E.; Czodrowski P.; Dorsch D.; et al. Large-Scale Assessment of Binding Free Energy Calculations in Active Drug Discovery Projects. J. Chem. Inf. Model. 2020, 60, 5457–5474. 10.1021/acs.jcim.0c00900. - DOI - PubMed
    1. Michel J.; Essex J. W. Prediction of protein–ligand binding affinity by free energy simulations: assumptions, pitfalls and expectations. Journal of Computer-Aided Molecular Design 2010, 24, 639–658. 10.1007/s10822-010-9363-3. - DOI - PubMed
    1. Mobley D. L.; Gilson M. K. Predicting Binding Free Energies: Frontiers and Benchmarks. Annual Review of Biophysics 2017, 46, 531–558. 10.1146/annurev-biophys-070816-033654. - DOI - PMC - PubMed
    1. Cournia Z.; Allen B. K.; Beuming T.; Pearlman D. A.; Radak B. K.; Sherman W. Rigorous Free Energy Simulations in Virtual Screening. J. Chem. Inf. Model. 2020, 60, 4153–4169. 10.1021/acs.jcim.0c00116. - DOI - PubMed

LinkOut - more resources