. 2024 Sep 20;9(99):eadp3475.
doi: 10.1126/sciimmunol.adp3475. Epub 2024 Sep 20.

Subset-specific mitochondrial stress and DNA damage shape T cell responses to fever and inflammation

Affiliations

Subset-specific mitochondrial stress and DNA damage shape T cell responses to fever and inflammation

Darren R Heintzman et al. Sci Immunol. .

Abstract

Heat is a cardinal feature of inflammation, yet its impacts on immune cells remain uncertain. We show that moderate-grade fever temperatures (39°C) increased murine CD4 T cell metabolism, proliferation, and inflammatory effector activity while decreasing regulatory T cell suppressive capacity. However, heat-exposed T helper 1 (TH1) cells selectively developed mitochondrial stress and DNA damage that activated Trp53 and stimulator of interferon genes pathways. Although many TH1 cells subjected to such temperatures died, surviving TH1 cells exhibited increased mitochondrial mass and enhanced activity. Electron transport chain complex 1 (ETC1) was rapidly impaired under fever-range temperatures, a phenomenon that was specifically detrimental to TH1 cells. TH1 cells with elevated DNA damage and ETC1 signatures were also detected in human chronic inflammation. Thus, fever-relevant temperatures disrupt ETC1 to selectively drive apoptosis or adaptation of TH1 cells to maintain genomic integrity and enhance effector functions.


Conflict of interest statement

Competing interests: J.C.R. is a founder and scientific adviser for Sitryx Therapeutics. All other authors declare that they have no competing interests.

Figures

Fig. 1.
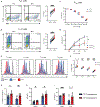
Fig. 1.. CD4 T cell function is broadly altered at febrile temperatures.
(A) IFN-γ expression by TH1 cells after 3 to 4 days of culture at 37° or 39°C (n = 8). (B) IL-17A expression by TH17 cells after 3 to 4 days of culture at 37° or 39°C (n = 10). (C) FOXP3 expression of iTregs cultured in an hTGF-β dilution series (n = 4). (D) Suppression assay of activated CD8 T cells performed at 37°C, cocultured with CD4+ iTregs previously cultured at 37° or 39°C (n = 4). (E) CTV staining of CD4 T cell subsets cultured for 3 days at 37° (blue) or 39°C (red). Naïve (gray) CD4 T cells served as a nonproliferating control. (F) Division index calculated using CTV data in (E) (n = 4). (G to I) CD45.2+ OT-II CD4 T cells were activated, cultured in vitro for 3 days at 37° or 39°C, and then transferred intravenously into CD45.1 hosts. Recipient animals were then immunized intraperitoneally with ovalbumin in CFA, and spleens and mLNs were analyzed after an additional 4 days (n = 12 for 37°C and n = 10 for 39°C pretreatment). (G) Percentage of CD45.2+ cells measured in spleens and mLNs. (H) Ki67 mean fluorescence intensity (MFI) of CD45.2-expressing cells in the spleens and mLNs of CD45.1+-recipient mice. (I) Percentage of IFN-γ+ cells of total CD45.2+ adoptively transferred cells in the spleens and mLNs. All biological replicates (n) are shown with SDs and means and are representative of at least two independent experiments, unless otherwise stated. *P < 0.05; **P < 0.01; ***P < 0.001; ****P < 0.0001. Paired t test [(A), (B), and (F)] and unpaired t test [(D) and (G) to (I)].
Fig. 2.
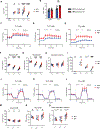
Fig. 2.. CD4 T cells rely on altered, differential metabolic programming at febrile temperatures.
(A) Glut1 expression on T cell subsets after 3 to 4 days of culture at 37° or 39°C as measured by flow cytometry (n = 7). (B) Glut1 MFI of CD45.2-expressing cells in the spleens and mLNs of CD45.1-recipient mice, outlined in Fig. 1 (G) to (I) (n = 12, 37°C pretreatment; n = 9, 39°C pretreatment). (C to E) ECAR of representative bioreplicates of TH1 cells, TH17 cells, and iTregs after 3 to 4 days of culture at 37° or 39°C (n = 8). (F to H) TH1 cells, TH17 cells, and iTregs were cultured for 3 to 4 days at 37° or 39°C, and (F) basal ECAR, (G) maximal ECAR, and (H) glycolytic reserve were measured. (I) Lactate secretion in naïve cells, TH1 cells, TH17 cells, and iTregs cultured at 37° and 39°C (n = 4). (J to L) OCR of representative bioreplicates of (J) TH1 cells, (K) TH17 cells, and (L) iTregs after 3 to 4 days of culture at 37° or 39°C (n = 8). (M to O) TH1 cells, TH17 cells, and iTregs were cultured for 3 to 4 days at 37° or 39°C, and (M) basal OCR, (N) maximal OCR, and (O) SRC were measured (n = 8). All biological replicates (n) are shown with SDs and means and are representative of at least two independent experiments, unless otherwise stated. *P < 0.05; **P < 0.01; ***P < 0.001; ****P < 0.0001. Paired t test [(A), (F) to (I), and (M) to (O)] and unpaired t test (B) were used. ns, not significant.
Fig. 3.
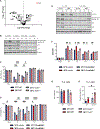
Fig. 3.. TH1 mitochondrial dysfunction leads to differential response to heat stress.
(A) Representative EM images of naïve and TH1 mitochondria after 3 days at 37° and 39°C (scale bars, 500 nm). (B) Quantification of mitochondrial cross-sectional areas in EM images of naïve, TH1 cells, TH17 cells, and iTregs (n = 3). (C to E) TH1 cells, TH17 cells, or iTregs were analyzed by flow cytometry over the course of 3 days at 37° or 39°C for (C) MitoTracker Green, (D) MitoSox, and (E) γΗ2ΑΧ. Cells were isolated from mice each day and activated and then analyzed on day 3 (n = 4). (F) HSP70, HSP90, and β-actin expression levels were assessed by protein immunoblot on day 3. (G) Viability was measured on day 3 using live-dead exclusion dye by flow cytometry and quantified by live cells as a percentage of total events (n = 10 naïve and TH0 cells, n = 15 TH1 cells, TH17 cells, and iTregs). All biological replicates (n) are shown with SDs and means and are representative of at least two independent experiments, unless otherwise stated. *P < 0.05; **P < 0.01; ***P < 0.001; ****P < 0.0001. Paired t tests [(B) to (E) and (G)] were used.
Fig. 4.
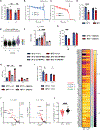
Fig. 4.. Effects of heat stress activate p53-mediated cell death in TH1 cells.
(A) Cell death–focused CRISPR screen of TH1 reveals genes providing a selection advantage (right of center line) and disadvantage (left of center line) after culture at 39°C. (B) Representative protein immunoblots of phospho-p53 (Ser15), p53, and p21 in subsets cultured at 37° or 39°C for 3 days. (C) Viability of WT or Trp53−/− T cells was assessed by flow cytometry on day 3 when cultured at 37° or 39°C (n = 4). (D) Viability of subsets cultured at 37° or 39°C was assessed after 3 days of culture with addition or omission of NAC (n = 4). (E) Representative protein immunoblots of markers of cell stress (p-P53–serine 15, HSP70, p21) with addition or omission of NAC in culture. (F) γΗ2ΑΧ measured by flow cytometry in cells cultured for 3 days with or without NAC at 37° or 39°C (n = 4). (G and H) WT or Trp53−/− TH1 cells were cultured at 37° or 39°C for 4 days, at which point live cells were sorted and 1000× whole-exome deep-sequenced to identify total mutational burden including single nucleotide variants (G) and mutational insertions (H) (n = 3). All biological replicates (n) are shown with SDs and means and are representative of at least two independent experiments, unless otherwise stated. *P < 0.05; **P < 0.01; ***P < 0.001; ****P < 0.0001. Two-way analysis of variance (ANOVA) [(C), (D), and (F)] and two-way ANOVA [(G) and (H)].
Fig. 5.
Fig. 5.. The cGAS-STING pathway is activated in TH1 cells at 39°C.
(A) TH1 supernatant was collected, and the presence of IFN-α and IFN-β was assayed by ELISA (n = 3 for each condition). (B) TH1 and TH17 cell cytosolic fractions were taken and assessed for the presence of mitochondrial and nuclear DNA by qPCR. Biological replicates are shown with SDs and means (n = 8). (C) TH1 and TH17 cells were cultured for 3 days at 37° or 39°C, upon which cells were lysed and protein immunoblotting was performed to assess expression of cGAS, STING, and phospho-STING (Ser365). Protein immunoblots show n = 3 biological replicates. (D) TH1 WT or Sting1−/− cells were cultured for 3 days at 37° or 39°C, upon which cells were lysed and protein immunoblotting was performed to assess phosphorylation of TBK1. Protein immunoblots and quantification are representative of n = 4 biological replicates. (E) Viability of TH1 and TH17 cells was assessed by flow cytometry. IFN-γ production in TH1 cells is expressed as the percentage of IFN-γ+ cells by flow cytometry. IL-17A production in TH17 cells is expressed as the percentage of IL-17A+ cells by flow cytometry. Biological replicates are shown with SDs and means (n = 8). (F) mitoROS and γH2AX intensity were assessed in TH1 and TH17 cells under 39° and 37°C culture conditions (n = 4). Data are representative of two independent experiments. (G) WT, Sting1−/−, and Trp53−/− T supernatants were taken for analysis by ELISA. IFN-β concentration was normalized by cell count taken before collection of supernatants (n = 5). All biological replicates (n) are shown with SDs and means and are representative of at least two independent experiments, unless otherwise stated. *P < 0.05; **P < 0.01; ***P < 0.001; ****P < 0.0001. Paired t test (A), two-way ANOVA [(B) and (F) to (G)], and one-way ANOVA [(D) and (E)].
Fig. 6.
Fig. 6.. IFN-γ–producing CD4 T cells in inflammatory diseases are associated with cell stress.
(A) Murine colitis gene expression (GSE27302) was analyzed to identify signs of heat stress response, TH1 signatures (Ifng), p53 activation (Cdkn1a), and STING pathway activity (Tmem173, MRE11). (B) An in vivo cell death CRISPR screen was applied to TH1 cells in a mouse model of IBD to identify proteins providing a survival advantage in inflammatory conditions. Results from the spleen are shown. (C) A 1:1 mix of congenically marked WT and Trp53−/− T cells was intraperitoneally injected into Rag1−/− mice to test for competitive advantage in an adoptive transfer mouse model of IBD. After 5 weeks, the ratio of Trp53−/− cells to WT cells was assessed in spleens. Percentages were calculated as the percentage of Trp53−/− cells compared with total CD4 cells. (D to G) Absolute number of WT or Trp53−/− cells that were (D) IFN-γ+ in the spleen, (E) IFN-γ+ in the mLN, (F) IL-17A+ in the spleen, and (G) IL-17A+ in the mLN. Data are normalized to reflect the number of cells per 20,000 CD4 T cells (n = 5). (H to K) Analysis of CD4 T cell groups in published human Crohn’s disease scRNA-seq data (GSE157477). (L to O) Analysis of CD4 T cell groups in published human RA scRNA-seq data (ImmPort SDY998). All biological replicates (n) are shown with SDs and means and are representative of at least two independent experiments, unless otherwise stated. *P < 0.05; ***P < 0.001; ****P < 0.0001. Two-way ANOVA (A) and paired t test [(C) to (G)].
Fig. 7.
Fig. 7.. ETC1 is temperature sensitive, and TH1 cells have greater reliance on ETC1 than TH17 cells.
(A) TH1 and TH17 cells were analyzed for ETC1-dependent respiration. (B to D) TH1 and TH17 cells were differentiated at 37°C, and ETC1-dependent respiration (ETC1 activity) was measured over time. Representative plots (of n = 6) are shown in (B) for 37°C and (C) for 39°C. (D) Replicates were quantified at 40 min as a percentage of OCR at T = 0. (E) ETC1 pathway analysis in CD4 T cell groups of published human Crohn’s disease scRNA-seq data. (F) TH1 cells were cultured at 37° or 39°C with MitoQ or NAC, and mitochondrial superoxide was measured (n = 8). (G) Cell viability was measured after culture with a low dose (5 nM) of the ETC1 inhibitor rotenone. Viability is represented as a percentage of vehicle (n = 4). (H) HSP70 levels in TH1 and TH17 cells cultured as described in (G) (n = 4). (I) The ETC2 inhibitor TTFA was added after 3 days of culture, and cells were analyzed after an additional 48 hours. Viability is represented as a percentage of vehicle (n = 4). (J) An ETC-focused CRISPR screen of TH1 and TH17 cells revealed genes providing a selection advantage and disadvantage after culture at 39°C. ETC1 genes are highlighted in red. (K) CRISPR screen results depicted by heatmap when analyzed for relative gRNA depletions (n = 3). (L) Quantification of log2-fold difference between TH1 and TH17 (TH1 – TH17) values obtained in (J) for ETC1 genes versus all other ETC genes screened. All biological replicates (n) are shown with SDs and means and are representative of at least two independent experiments, unless otherwise stated. *P < 0.05; **P < 0.01; ***P < 0.001; ****P < 0.0001. Two-way ANOVA [(A), (D), and (G) to (I)], one-way ANOVA (F), and unpaired t test (L).

References

    1. Heintzman DR, Fisher EL, Rathmell JC, Microenvironmental influences on T cell immunity in cancer and inflammation. Cell. Mol. Immunol. 19, 316–326 (2022). - PMC - PubMed
    1. Michalek RD, Gerriets VA, Jacobs SR, Macintyre AN, MacIver NJ, Mason EF, Sullivan SA, Nichols AG, Rathmell JC , Cutting edge: Distinct glycolytic and lipid oxidative metabolic programs are essential for effector and regulatory CD4+ T cell subsets. J. Immunol. 186, 3299–3303 (2011). - PMC - PubMed
    1. Daniel RM, Danson MJ, Eisenthal R, Lee CK, Peterson ME, The effect of temperature on enzyme activity: New insights and their implications. Extremophiles 12, 51–59 (2008). - PubMed
    1. Segale M, The temperature of acutely inflamed peripheral tissue. J. Exp. Med. 29, 235–249 (1919). - PMC - PubMed
    1. Gatt A, Mercieca C, Borg A, Grech A, Camilleri L, Gatt C, Chockalingam N, Formosa C, Thermal characteristics of rheumatoid feet in remission: Baseline data. PLOS ONE 15, e0243078 (2020). - PMC - PubMed

Publication types