. 2024 Sep 20;10(38):eado0016.
doi: 10.1126/sciadv.ado0016. Epub 2024 Sep 20.

Fusobacterium nucleatum extracellular vesicles are enriched in colorectal cancer and facilitate bacterial adhesion

Affiliations

Fusobacterium nucleatum extracellular vesicles are enriched in colorectal cancer and facilitate bacterial adhesion

Xin Zheng et al. Sci Adv. .

Abstract

Fusobacterium nucleatum in colorectal cancer (CRC) tissue is implicated at multiple stages of the disease, while the mechanisms underlying bacterial translocation and colonization remain incompletely understood. Herein, we investigated whether extracellular vesicles derived from F. nucleatum (FnEVs) have impacts on bacterial colonization. In mice with colitis-related CRC, a notable enrichment of FnEVs was observed, leading to a significant increase in intratumor colonization by F. nucleatum and accelerated progression of CRC. The enrichment of FnEVs in clinical CRC tissues was demonstrated. Subsequently, we revealed that FnEVs undergo membrane fusion with CRC cells, leading to the transfer and retention of FomA on recipient cell surfaces. Given its ability to facilitate F. nucleatum autoaggregation through interaction with FN1441, the presence of FomA on CRC cell surfaces presents a target for bacterial adhesion. Collectively, the findings unveil a mechanism used by EVs to prepare a niche conducive for bacterial colonization in distal organs.


Figures
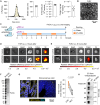
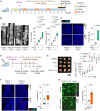
Fig. 1.
Fig. 1.. The presence of FnEVs is significantly augmented in CRC tissue.
(A and B) Characterization and representative transmission electron microscope (TEM) images of FnEVs. n = 7 biological replicates from three independent experiments. (C) Experimental design of investigating the tissue distribution of FnEVs in AOM/DSS-induced CRC model. The experiment was independently performed twice. i.p., intraperitoneal injection. p.o., oral administration. (D and E) Representative images of tissue distribution of DiR-labeled FnEVs, taken 2 hours [(D) n = 4 mice in control group and 6 in AOM/DSS group] and 8 hours [(E) n = 4 mice in control group and 5 in AOM/DSS group] after oral administration of FnEVs. (F) FnEV proteins were electrophoresed on an SDS–polyacrylamide gel electrophoresis (SDS-PAGE) gel and stained with Coomassie brilliant blue. FomA in an ~40-kDa band was identified using MS. M, the marker. (G) Representative images and quantification of FnEVs (2 hours after oral administration) uptake by CRC and paired noncancerous colon tissue in mice. n = 7 mice in each group from two independent experiments. A.U., absorbance unit. NCC, noncancerous colon. (H) Western blotting of FomA in EVs purified from clinical CRC tissue and paired adjacent normal tissue (NT). M, the marker. n = 5 patients. The experiment was independently performed twice. The data are presented as means ± SD in (A). Each triangle represents an individual sample in (A) and (G). The P value was determined by Mann-Whitney test in (G). DAPI, 6-diamidino-2-phenylindole.
Fig. 2.
Fig. 2.. FnEVs facilitate F. nucleatum adhesion and exacerbate CRC progression.
(A) Experimental design of investigating the effects of FnEVs and F. nucleatum (Fn) on CRC progression in AOM/DSS model. The experiment was independently performed twice. i.p., intraperitoneal injection. p.o., oral administration. CFU, colony forming unit. (B) Representative stitched stereomicroscope images and quantitative evaluation of AOM/DSS-induced CRC in four groups. n = 6 mice in each group. (C) Representative images and quantification of F. nucleatum stained with FISH in AOM/DSS-induced CRC. n = 6 mice in each group. (D) Experimental design of evaluating the effects of FnEVs and F. nucleatum on CRC progression in xenograft model. The experiment was independently performed twice. (E) Representative images of xenografts and the monitoring of tumor volume of “Vehicle” (n = 6), “FnEV” (n = 7), “Fn” (n = 7), and “FnEV + Fn” (n = 6) groups. (F and G) Representative images and quantification of F. nucleatum stained with FISH in xenografts (F) or in coculture with DLD-1 [pretreated with PBS or FnEVs (5 μg/ml)] (G). (F) n = 6 mice in “FnEV (−) Fn (+)” group and seven mice in “FnEV (+) Fn (+)” group. (G) n = 6 biological samples in each group from three independent experiments. The data are presented as median with interquartile range in (B), (C), and (F) and as means ± SD in (E) and (G). Each triangle represents an individual sample in (B), (C), (F), and (G). The P values were determined by one-way analysis of variance (ANOVA) test [(B) and (E)], Mann-Whitney test [(C) and (F)], or Welch’s t test (G).
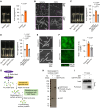
Fig. 3.
Fig. 3.. The membrane fusion and surface proteins of FnEVs are indispensable for promoting F. nucleatum adhesion.
(A) Spectrofluorimetric analysis after addition of DLD-1 to R18-labeled FnEVs. In Hanks’ balanced salt solution (HBSS) control group, fluorescence increased only after disruption of FnEVs with TX (dequenching). DLD-1 cells were pretreated with 15 μM filipin [dimethyl sulfoxide (DMSO) as vehicle control] to inhibit the membrane fusion of FnEVs. Two independent experiments were performed with similar results. The data of one representative assay with three replicates (means ± standard error of the mean) are shown. FD%, percentage of fluorescence dequenching level. (B) Representative fluorescent images depicting the membrane fusion of R18-labeled FnEVs with DLD-1. n = 8 biological replicates in each group from three independent experiments. A.U., absorbance unit. (C and D) Representative images and quantification of F. nucleatum stained with FISH in coculture with DLD-1. (C) Cells were pretreated with DMSO or 15 μM filipin, followed by treatment FnEVs (5 μg/ml), and then infected with F. nucleatum for 1 hour, n = 6 biological replicates in each group from three independent experiments. (D) FnEVs were pretreated with PBS, or ProK (2 μg/ml) alone, or 1% TX alone, followed by inactivation of ProK with 200 μM phenylmethylsulfonyl fluoride. n = 6 biological replicates in each group from three independent experiments. (E) Proteins of pretreated FnEVs were separated on an SDS-PAGE gel and visualized using silver staining. FomA in an ~40-kDa band and fusolisin in an ~70-kDa band were identified using MS. The experiment was independently performed twice. M, the marker. The data are presented as means ± SD in (B) to (D). Each triangle represents an individual sample in (B) to (D). The P values were determined by Mann-Whitney test (B), Welch’s ANOVA test (C), or one-way ANOVA test (D). GFP, green fluorescent protein.
Fig. 4.
Fig. 4.. FomA is required for FnEV to promote adhesion of F. nucleatum.
(A) Representative images and quantification of F. nucleatum stained with FISH in coculture with DLD-1. FnEVs were pretreated with rabbit immunoglobulin G (IgG) or the homemade anti-FomA rabbit polyclonal antibody (αFomA). n = 6 biological replicates in each group from three independent experiments. (B) Experimental design of assessing the impacts of αFomA-pretreated FnEVs on tumor progression and F. nucleatum adhesion in xenograft model. The experiment was independently performed twice. (C) Representative images of xenografts and the monitoring of tumor volume of “PBS + Fn” (n = 8), “IgG FnEV + Fn” (n = 8), and “αFomA FnEV + Fn” (n = 8) groups. (D) Representative images and quantification of F. nucleatum stained with FISH in xenografts. n = 8 mice in each group. The data are presented as median with interquartile range in (D) and as means ± SD in (A) and (C). Each triangle represents an individual sample in (A) and (D). The P values were determined by Welch’s ANOVA test [(A) and (C)] or Kruskal-Walli’s test (D).
Fig. 5.
Fig. 5.. FomA retains on CRC cell surface via FnEV membrane fusion and mediates adhesion of F. nucleatum.
(A) Immunofluorescence staining of FomA. Cells were pretreated with DMSO or 15 μM filipin, followed by treatment of FnEVs (5 μg/ml). As a negative control, the cells were not treated with anything. (B) Mean intensity of FomA was calculated in the region of interest (ROI), which is defined as the periphery surrounding GFP-expressing cells. Each triangle represents a datum of a single cell. The data were collected from five biological replicates in “FnEV + DMSO” and “FnEV + filipin” groups, and from two biological replicates in “No FnEV” group. The experiment was independently performed twice. (C) Western blotting of FomA in DLD-1 treated with FnEVs and/or filipin. Mem, protein fraction of plasm membrane. Cytosol, protein fraction of cytosol. E-cadherin and α-tubulin were selected as the marker for cell membrane protein and cytosolic protein, respectively. The experiment was independently performed twice. (D to F) Heterologous expression of FomA in DLD-1 cells. The membrane localization of FomA was confirmed by Western blotting (D) and immunofluorescence staining (E). DAPI and DiO (3,3'-dioctadecyloxycarbocyanine chlorates)-dye were used to visualize the nuclei and plasm membrane, respectively. The experiment was independently performed twice. (F) Representative images and quantification of F. nucleatum stained with FISH in coculture with DLD-1. n = 6 biological replicates in each group from three independent experiments. The data are presented as means ± SD in (B) and (F). Each triangle represents an individual sample in (F). The P values were determined by Kruskal-Walli’s test (B) or Student’s t test (F).
Fig. 6.
Fig. 6.. FomA is indispensable for FnEVs facilitating F. nucleatum adhesion on CRC cells.
(A and B) Characterization and representative TEM imaging of EVs generated by ΔgalKT ATCC23726 (Parent FnEVs) or ΔgalKTΔfomA ATCC23726 (ΔfomA FnEVs). n = 6 biological replicates from three independent experiments. (C) Western blotting of FomA in Parent FnEVs and ΔfomA FnEVs. The experiment was independently performed twice. M, the marker. (D) Representative images and quantification of ΔgalKT ATCC23726 (Parent Fn) stained with FISH in coculture with DLD-1. Cells were pretreated with Parent FnEVs (5 μg/ml) or ΔfomA FnEVs. n = 6 biological replicates in each group from three independent experiments. (E) Experimental design of assessing the impacts of Parent FnEVs or ΔfomA FnEVs on tumor progression and Parent Fn adhesion in xenograft model. The experiment was independently performed twice. (F) Representative images of xenografts and the monitoring of tumor volume of “PBS + Parent Fn” (n = 8), “Parent FnEV+Parent Fn” (n = 8), and “ΔfomA FnEV+Parent Fn” (n = 8) groups. (G) Representative images and quantification of Parent Fn stained with FISH in xenografts. n = 8 mice in each group. The data are presented as median with interquartile range in (G) and as means ± SD in (A), (D), and (F). Each triangle represents an individual sample in (A), (D), and (G). The P values were determined by Student’s t test (A), one-way ANOVA test [(D) and (F)], or Kruskal-Walli’s test (G).
Fig. 7.
Fig. 7.. FomA in FnEVs mediates autoaggregation of F. nucleatum.
(A) Representative pictures and quantification of autoaggregation of F. nucleatum ATCC25586. One microgram FnEVs (in 5 μl of PBS) was added when indicated. n = 5 biological replicates from three independent experiments. (B) Representative SEM images showing the autoaggregation of F. nucleatum, with or without FnEV treatment. The experiment was independently performed three times. (C and D) Representative pictures and quantification of autoaggregation of Parent Fn (ΔgalKT ATCC23726) treated with indicated FnEV. n = 5 biological replicates from three independent experiments. (E) Representative SEM images showing the autoaggregation of Parent Fn and ΔfomA Fn (ΔgalKTΔfomA ATCC23726). The experiment was independently performed three times. (F) Representative images and quantification of Syto-9–labeled Parent Fn and ΔfomA Fn biofilm. n = 6 biological replicates from three independent experiments. (G) Schematic representation of the workflow for capturing biotinylated surface proteins of F. nucleatum ATCC25586 and FomA-binding surface proteins. (H) Biotinylated surface proteins of F. nucleatum ATCC25586 were pulled down with GST-FomA, separated on an SDS-PAGE gel, and visualized using silver staining. The experiment was independently performed twice. (I) GST pull-down assay with GST-FN1441 as the bait. The FomA protein in the protein lysis of F. nucleatum (input) and the eluted proteins (pull-down) was quantified by Western blotting. The experiment was independently performed twice. The data are presented as means ± SD in (A), (C), (D), and (F). Each triangle represents an individual sample in (A), (C), (D), and (F). The P values were determined by Student’s t test [(A) and (F)], Kruskal-Walli’s test (C), or one-way ANOVA test (D).

References

    1. Wong C. C., Yu J., Gut microbiota in colorectal cancer development and therapy. Nat. Rev. Clin. Oncol. 20, 429–452 (2023). - PubMed
    1. Sepich-Poore G. D., Zitvogel L., Straussman R., Hasty J., Wargo J. A., Knight R., The microbiome and human cancer. Science 371, (2021). - PMC - PubMed
    1. Wang N., Fang J. Y., Fusobacterium nucleatum, a key pathogenic factor and microbial biomarker for colorectal cancer. Trends Microbiol. 31, 159–172 (2023). - PubMed
    1. Brennan C. A., Garrett W. S., Fusobacterium nucleatum - Symbiont, opportunist and oncobacterium. Nat. Rev. Microbiol. 17, 156–166 (2019). - PMC - PubMed
    1. Jiang S. S., Xie Y.-L., Xiao X.-Y., Kang Z.-R., Lin X.-L., Zhang L., Li C.-S., Qian Y., Xu P.-P., Leng X.-X., Wang L.-W., Tu S.-P., Zhong M., Zhao G., Chen J.-X., Wang Z., Liu Q., Hong J., Fusobacterium nucleatum-derived succinic acid induces tumor resistance to immunotherapy in colorectal cancer. Cell Host Microbe 31, 781–e789 (2023). - PubMed

Publication types

Substances