. 2024 Sep 20;10(38):eado8107.
doi: 10.1126/sciadv.ado8107. Epub 2024 Sep 20.

Structural insights into polyamine spermidine uptake by the ABC transporter PotD-PotABC

Affiliations

Structural insights into polyamine spermidine uptake by the ABC transporter PotD-PotABC

Zhu Qiao et al. Sci Adv. .

Abstract

Polyamines, characterized by their polycationic nature, are ubiquitously present in all organisms and play numerous cellular functions. Among polyamines, spermidine stands out as the predominant type in both prokaryotic and eukaryotic cells. The PotD-PotABC protein complex in Escherichia coli, belonging to the adenosine triphosphate-binding cassette transporter family, is a spermidine-preferential uptake system. Here, we report structural details of the polyamine uptake system PotD-PotABC in various states. Our analyses reveal distinct "inward-facing" and "outward-facing" conformations of the PotD-PotABC transporter, as well as conformational changes in the "gating" residues (F222, Y223, D226, and K241 in PotB; Y219 and K223 in PotC) controlling spermidine uptake. Therefore, our structural analysis provides insights into how the PotD-PotABC importer recognizes the substrate-binding protein PotD and elucidates molecular insights into the spermidine uptake mechanism of bacteria.


Figures

Fig. 1.
Fig. 1.. Structures of the apo form and Spd-bound PotABC complexes.
(A) Cryo-EM map of the apo form PotABC complex. The two PotA molecules are colored pink (PotA) and purple (PotA′); the PotB and PotC molecules are colored wheat and lime, respectively. The protein molecules are colored consistently in all figures unless stated otherwise. The gray lines indicate the inner membrane location, and the transmembrane (TM) region is shown. (B) Cartoon representation of PotB and PotC alignment. The two termini are indicated by N and C. The extra helix in PotB is marked with a dashed circle. (C) PotB and PotC assemble with a twofold pseudosymmetry. The symmetry axis is indicated with a black dot, and the transmembrane helices are numbered as in (D). (D) Topological diagrams of PotB and PotC. The three periplasmic loops are indicated by P1, P2, and P3, and the coupling helix is indicated by an arrow. (E) Detailed interactions between the coupling helix of PotA and PotB. The interacting residues are shown as sticks, the same as the below. (F) Detailed interactions between the coupling helix of PotA and PotC. The hydrogen bonds are shown as dashed lines, the same as the ones below. (G) Cryo-EM map of the Spd-bound PotABC complex. (H) Two views showing the detailed interactions between Spd and PotB/PotC. Spd is shown in sticks and colored salmon, with the electron density shown as salmon surface. The residues (PotB F164 and L213; and PotC F142 and L191) blocking the exit of Spd from the membrane translocation pathway are also shown in sticks.
Fig. 2.
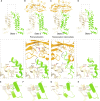
Fig. 2.. Structure of the PotD-PotABC complex in the pretranslocation state.
(A) Overall architecture of the PotD-PotABC complex in the pretranslocation state. Two views from 90° angles are shown. The Spd-binding protein PotD is colored orange. (B) The interaction interfaces of PotD with the PotABC complex. For clarity, the figures showing the three interfaces on the PotD and PotABC complex are generated separately but with the same view. The three distinct interaction interfaces of PotD and PotBC are shown in red, blue, and purple, and labeled 1, 2, and 3, respectively. The N- and C-lobes of PotD (on the top) are indicated as well. (C to E) Detailed interactions of the three distinct interaction interfaces [from (B)] are shown with the interacting residues shown in sticks and labeled. The hydrogen bonds are shown as dashed lines.
Fig. 3.
Fig. 3.. Structure of the PotD-PotABC complex in the translocation intermediate state.
(A) Cryo-EM map of the PotD-PotABC complex in the translocation intermediate state (left). The corresponding atomic model is shown in cartoon (right), with the two bound ATP molecules shown as spheres. (B) The overall structure of PotD and PotBC in the translocation intermediate state. (C) A close-up view of the scoop loop (periplasmic loop 3) protruding into the Spd binding pocket. PotC K233 in the scoop loop directly interacts with the residues W34, Y37, N213, W229, W255, and Y293 in PotD. The hydrogen bond formed between K223 and Y293 is indicated by a dashed line. (D) A close-up view of the cavity formed by PotB and PotC. Following conformational changes in the PotD-PotABC complex upon ATP binding, a cavity (shown as gray surface) at the periplasmic side is formed between PotB and PotC. The residues implicated in Spd binding are labeled and shown as sticks. (E) The ATP binding sites in PotA. Two views from 90° angles are shown. The signature motifs Walker A, Walker B, and LSGGQ are indicated and colored cyan, pale green, and slate, respectively. ATP molecules are shown in sticks, with carbon, oxygen, nitrogen, and phosphate atoms colored pink, red, blue, and orange, respectively. The bound Mg2+ ions are shown as green spheres. (F) A close-up view of the ATP-binding pocket. ATP molecule is coordinated by residues from both PotA and PotA′ protomers. The residues involved in ATP binding are shown in sticks and labeled. The catalytic residue D172 is also shown. Hydrogen bonds are shown as gray dashed lines.
Fig. 4.
Fig. 4.. Conformational changes of the PotD-PotABC complex.
(A) Structural comparison of PotD-PotABC in the translocation intermediate state (right) with that in the pretranslocation state (labeled as “Pre” and left) reveals changes. The NBDs move closer because of the ATP binding, with the shift direction indicated by black arrows. The NBDs are shown as surface representations when viewed from the periplasmic side. The two bound ATP molecules are shown as spheres. (B) Conformational changes of the regulation domain from the pretranslocation (Pre) state to the translocation intermediate state viewing from the cytosol side. The regulation domains are shown as surface representations. The gray dashed lines indicate the surface pockets. The rotation is also indicated. (C) The narrowing of the transmembrane pathway during transitioning from the Pre state (left) to the translocation intermediate state (right). The distances between the PotB K178 Cα atom and the PotC R157 Cα atom (with the two residues shown as spheres) in the two coupling helices are indicated. (D) Comparison of the orientation of PotB and PotC transmembrane helices (TMs) in the Pre state (gray) and translocation intermediate state (wheat and lime) viewed from the “top.” The TMs are numbered as in Fig. 1. (E) A cross-sectional surface view of the PotD from the PotD-PotABC complex in the Pre state (left) and translocation intermediate state (right). The PotD surface is clipped to reveal the Spd binding pocket and bound Spd. (F) The conformational changes in PotD from the Pre state (gray) to the translocation intermediate state (orange). PotD Spd binding residues and Spd are shown as sticks and labeled. The PotC scoop loop is shown in cartoon. The shifts of PotD W34, W255, and PotB K223 from the Pre state to the translocation intermediate state are indicated by the dashed arrows, with the distance indicated.
Fig. 5.
Fig. 5.. The conformational changes in the Spd translocation pathway.
(A to D) Structural comparison of the PotBCD interaction interfaces of the four states along the Spd translocation pathway reveals significant conformational changes. The four states are as follows: state 1, apo PotABC; state 2, PotD-PotABC pretranslocation state; state 3, PotD-PotABC translocation intermediate state; state 4, Spd-bound PotABC. The periplasmic gating residues, the cytosolic side gating residues, and the Spd-interacting residues in PotD are shown in sticks and labeled. Close-up views of the gating residues on the periplasmic side are shown below. The conformational changes of the key residues compared with those in the following state are indicated by black arrows. (E to H) Top view of the periplasmic gates in the four states. The gating residues are shown as sticks. The TMs are shown as tubes.
Fig. 6.
Fig. 6.. Proposed Spd uptake mechanism of the PotD-PotABC transporter.
PotD binds free Spd and subsequently associates with the transmembrane PotABC complex (state 1), thus forming the Spd-bound PotD-PotABC complex (state 2). Two ATP molecules bind to the NBDs of PotA and PotA′ protomers, thereby inducing conformational changes in the PotABC translocation pathway (state 3). The PotB Y223 moves from the inward-facing conformation to the outward-facing conformation, along with the opening of the periplasmic gate formed by residues in PotB (F222, D226, and K241) and PotC (Y219 and K223). The scoop loop of PotC protrudes into the Spd binding pocket. Spd is then released to the transmembrane passage. ATP hydrolysis provides the energy for switching from the outward-facing conformation to the inward conformation (state 4). PotD, phosphate, and adenosine diphosphate (ADP) dissociate from the PotABC complex. Last, the Spd is released into the cytosol.

References

    1. Igarashi K., Kashiwagi K., Modulation of cellular function by polyamines. Int. J. Biochem. Cell Biol. 42, 39–51 (2010). - PubMed
    1. Sim S. I., von Bulow S., Hummer G., Park E., Structural basis of polyamine transport by human ATP13A2 (PARK9). Mol. Cell 81, 4635–4649.e8 (2021). - PMC - PubMed
    1. Michael A. J., Polyamines in eukaryotes, bacteria, and archaea. J. Biol. Chem. 291, 14896–14903 (2016). - PMC - PubMed
    1. Wu D., Lim S. C., Dong Y., Wu J., Tao F., Zhou L., Zhang L. H., Song H., Structural basis of substrate binding specificity revealed by the crystal structures of polyamine receptors SpuD and SpuE from Pseudomonas aeruginosa. J. Mol. Biol. 416, 697–712 (2012). - PubMed
    1. Michael A. J., Polyamine function in archaea and bacteria. J. Biol. Chem. 293, 18693–18701 (2018). - PMC - PubMed

MeSH terms

Substances

LinkOut - more resources