. 2024 Sep 20;10(38):eadn2806.
doi: 10.1126/sciadv.adn2806. Epub 2024 Sep 20.

Defining metabolic flexibility in hair follicle stem cell induced squamous cell carcinoma

Affiliations

Defining metabolic flexibility in hair follicle stem cell induced squamous cell carcinoma

Carlos Galvan et al. Sci Adv. .

Abstract

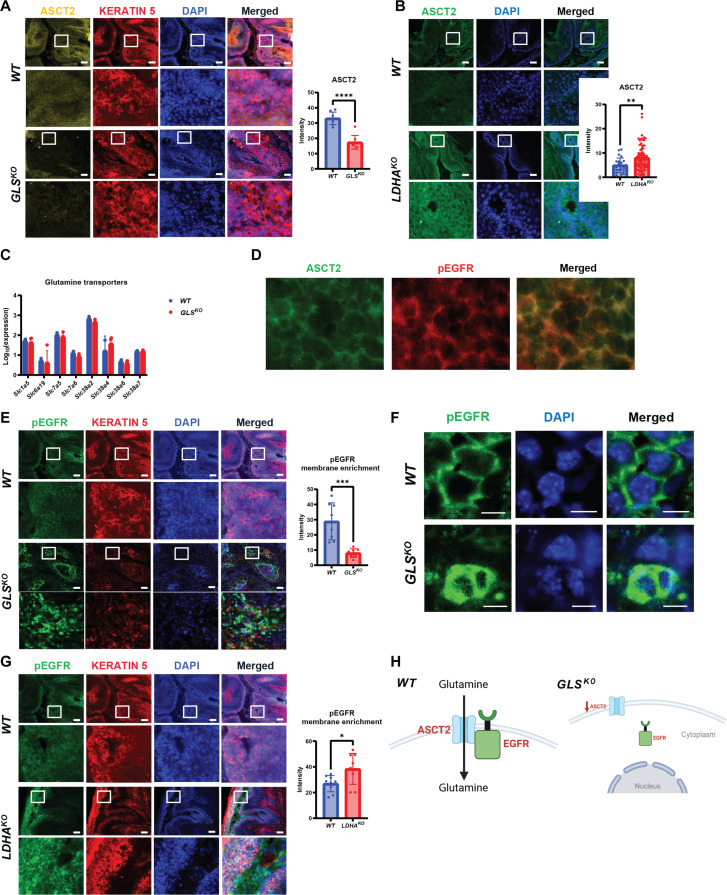
We previously showed that inhibition of glycolysis in cutaneous squamous cell carcinoma (SCC)-initiating cells had no effect on tumorigenesis, despite the perceived requirement of the Warburg effect, which was thought to drive carcinogenesis. Instead, these SCCs were metabolically flexible and sustained growth through glutaminolysis, another metabolic process frequently implicated to fuel tumorigenesis in various cancers. Here, we focused on glutaminolysis and genetically blocked this process through glutaminase (GLS) deletion in SCC cells of origin. Genetic deletion of GLS had little effect on tumorigenesis due to the up-regulated lactate consumption and utilization for the TCA cycle, providing further evidence of metabolic flexibility. We went on to show that posttranscriptional regulation of nutrient transporters appears to mediate metabolic flexibility in this SCC model. To define the limits of this flexibility, we genetically blocked both glycolysis and glutaminolysis simultaneously and found the abrogation of both of these carbon utilization pathways was enough to prevent both papilloma and frank carcinoma.


Figures

Fig. 1.
Fig. 1.. Glutamine metabolism is up-regulated in SCC.
(A) Schematic showing metabolic reprogramming in glutamine metabolism from normal skin to SCC. Glutamine is metabolized into TCA cycle, and ATP is synthesized from TCA cycle–derived glutamine. ASCT2 (SLC1A5), GLS, and GOT2 gene expression in skin (n = 5) and SCC (n = 6). Statistical significance (*P < 0.05, **P < 0.01, and ***P < 0.001) was calculated using a two-tailed t test. (B) Ontological analysis from metabolomics workbench for metabolic substrates increased in SCC compared to normal skin. THF, tetrahydrofolate. (C) Metabolomic pool volcano plot of normal skin versus papilloma (benign tumor) initiated by DMBA/TPA skin chemical carcinogenesis. Dashed lines indicate adjusted P ≤ 0.05 or log2(fold change) of ≥0 or ≤0. Colored dots represent metabolites significantly increasing (red) or decreasing (green) during the skin to tumor transition. (D) Schematic of enzymes used in glycolysis, lactate production, and glutaminolysis. (E) Tumors from WT and LDHAKO mice stained for hematoxylin and eosin (H&E). Scale bars, 10 μm. (F) Schematic of fully labeled glutamine isotopomer conversion. Data represent percent of M5-labeled glutamine and M5-labeled glutamate in tumors [n = 3 (WT), n = 9 (LDHAKO)] after 13C5-glutamine infusion. Metabolic pool data representing relative amounts of glutamine and glutamate in tumors [n = 9 (WT), n = 27 (LDHAKO)]. Statistical significance (*P < 0.05, **P < 0.01, ***P < 0.001, and ****P < 0.0001) was calculated using a two-tailed t test. Figure 1 (A, D, and F) were produced using BioRender.
Fig. 2.
Fig. 2.. Loss of GLS does not affect SCC initiation, progression, or pathology.
(A) Schematic of transgenic mice used to knock out GLS in HFSCs coupled with topical SCC chemical carcinogenesis using DMBA and TPA. Figures 2A was produced using BioRender. (B) Dorsal tumors from WT and GLSKO mice stained for H&E. Scale bars, 50 μm. (C) Quantification of time to papilloma [n = 40 (WT), n = 88 (GLSKO)] initiation and SCC [n = 12 (WT), n = 29 (GLSKO)] formation. Each data point represents a tumor of that genotype. Quantification of volume of papilloma [n = 11 (WT), n = 25 (GLSKO)] and SCC [n = 8 (WT), n = 26 (GLSKO)]. Each data point represents a tumor of that genotype. Quantification of the number of papilloma [n = 6 (WT), n = 10 (GLSKO)] and SCC [n = 6 (WT), n = 10 (GLSKO)] formed per mice. Each data point represents a mouse of that genotype. Data shown represent tumors present at the end of the experiment. Quantification of percent and types of tumors formed per genotype: WT (papilloma = 48%; SCC = 30%; regress = 23%; necrotic = 0%) and GLSKO (papilloma = 57%; SCC = 30%; regress = 8%; necrotic = 6%). Data shown represent tumor quantifications from the beginning to the end of the experiment.
Fig. 3.
Fig. 3.. Loss of GLS in tumors alters glutamine and glucose metabolism.
(A) WT or GLSKO SCC immunostaining for GLS and KERATIN 5, an epidermal marker. Cell nuclei were stained with 4′,6-diamidino-2-phenylindole (DAPI). Quantification of mean intensity epithelial GLS fluorescence in WT (n = 15) and GLSKO (n = 15) SCCs. GLS activity in WT (n = 2) and GLSKO (n = 6) SCC lysates. (B) Schematic of fully labeled glutamine isotopomer conversion. Data represent percent of M5-labeled glutamine and M2-labeled asparagine in papilloma [n = 4 (WT), n = 3 (GLSKO)] and SCC [n = 5 (WT), n = 8 (GLSKO)] after 13C5-glutamine infusion. OAA, oxaloacetate. (C) Schematic of fully labeled glucose isotopomer conversion. Data represent percent of M3-labeled pyruvate and M3-labeled lactate in papilloma [n = 6 (WT), n = 6 (GLSKO)] and SCC [n = 2 (WT), n = 5 (GLSKO)] after 13C6-glucose infusion. (D) WT or GLSKO SCC immunostaining for glucose transporter, GLUT1. Cell nuclei were stained with DAPI. Quantification of mean intensity GLUT1 fluorescence in WT (n = 91) and GLSKO (n = 56) SCCs. Scale bars, 100 μm. (E) Mean 18F-FDG SUV signal of papilloma [n = 7 (WT), n = 12 (GLSKO)] and SCC [n = 4 (WT), n = 15 (GLSKO)]. H, heart; Br, brain; K, kidneys; L, liver; B, bladder. (F) RNA-seq data of WT (n = 2) or GLSKO (n = 5) tumors showing transcription levels of proliferation, HFSC, epithelial, and mesenchymal markers. Figure 3 (B and C) was produced using BioRender. Statistical significance (*P < 0.05, **P < 0.01, ***P < 0.001, and ****P < 0.0001) for (A) to (F) was calculated using a two-tailed t test.
Fig. 4.
Fig. 4.. Increased lactate transporter and uptake in GLSKO SCC.
(A) Schematic of fully labeled lactate isotopomer conversion. Data represent percent of M3-labeled lactate, M2-labeled citrate/isocitrate, M2-labeled succinate, M2-labeled fumarate, and M2-labeled malate in SCCs [n = 3 (WT), n = 5 (GLSKO)] after 13C3-lactate infusion. Statistical significance (***P < 0.001) was calculated using a two-tailed t test. CoA, coenzyme A. Figure 4A was produced using BioRender. (B) WT or GLSKO SCC immunostaining for lactate transporter, MCT1. Cell nuclei were stained with DAPI. Quantification of mean intensity MCT1 fluorescence in WT (n = 39) and GLSKO (n = 36) SCCs. ns, not significant. Scale bars, 100 μm. (C) WT or GLSKO SCC immunostaining for lactate transporter, MCT4. Cell nuclei were stained with DAPI. Quantification of mean intensity MCT4 fluorescence in WT (n = 33) and GLSKO (n = 27) SCCs. Statistical significance (****P < 0.0001) was calculated using a two-tailed t test. Scale bars, 100 μm. (D) RNA-seq data of WT (n = 2) or GLSKO (n = 5) tumors showing transcription levels of lactate transporters.
Fig. 5.
Fig. 5.. Posttranscriptional increased glucose transporter at the cell surface.
(A) Schematic of glycolysis, lactate production, and glutaminolysis. (B) Schematic of fully labeled glucose isotopomer conversion. Data represent percent of M6-labeled glucose and M3-labeled lactate in tumors [n = 8 (WT), n = 7 (LDHAKO)] after 13C6-glucose infusion. Metabolic pool data representing relative amounts of glucose and lactate in tumors [n = 24 (WT), n = 21 (LDHAKO)]. (C) Metabolic pool data representing relative amounts of glucose, lactate, glutamine, and glutamate in tumors [n = 6 (WT), n = 9 (MPCKO)]. (D) WT or MPCKO SCC immunostaining for glucose transporter, GLUT1. Cell nuclei were stained with DAPI. Quantification of mean intensity GLUT1 fluorescence in WT (n = 56) and MPCKO (n = 49) SCCs. Scale bars, 100 μm. (E) WT or LDHAKO SCC immunostaining for glucose transporter, GLUT1. Cell nuclei were stained with DAPI. Quantification of mean intensity GLUT1 fluorescence in WT (n = 61) and LDHAKO (n = 65) SCCs. Scale bars, 100 μm. (F) RNA-seq data of WT (n = 5) or LDHAKO (n = 5) tumors showing transcription levels of glucose transporters. (G) Schematic of TXNIP inhibiting GLUT1. (H) WT, LDHAKO, or MPCKO tumor serial sections were probed for TXNIP and GLUT1. Lines in zoomed images mark boundaries of tissue structures and highlight anticorrelation between TXNIP and GLUT1. Quantification of TXNIP expression [n = 3 (WT), n = 3 (LDHAKO)] and [n = 4 (WT), n = 6 (MPCKO)] SCCs. Quantification of GLUT1 expression [n = 3 (WT), n = 4 (LDHAKO)] and [n = 4 (WT), n = 6 (MPCKO)] SCCs. Scale bars, 50 μm. Figure 5 (A, B, and G) was produced using BioRender. Statistical significance (*P < 0.05, **P < 0.01, ***P < 0.001, and ****P < 0.0001) for (B) to (E) and (H) was calculated using a two-tailed t test.
Fig. 6.
Fig. 6.. Inhibition of the Warburg effect drives increase in glutamine transporter and uptake.
(A) WT or GLSKO SCC immunostaining for glutamine transporter, ASCT2. Cell nuclei were stained with DAPI. Quantification of mean intensity ASCT2 fluorescence in WT (n = 8) and GLSKO (n = 8) SCCs. Statistical significance (****P < 0.0001) was calculated using a two-tailed t test. Scale bars, 100 μm. (B) WT or LDHAKO SCC immunostaining for glutamine transporter, ASCT2. Cell nuclei were stained with DAPI. Quantification of mean intensity ASCT2 fluorescence in WT (n = 23) and LDHAKO (n = 74) SCCs. Statistical significance (**P < 0.01) was calculated using a two-tailed t test. Scale bars, 100 μm. (C) RNA-seq data of WT (n = 2) or GLSKO (n = 5) tumors showing transcription levels of glutamine transporters. (D) Confocal microscopy for WT SCC immunostaining for ASCT2 and pEGFR. Scale bar, 20 μm. (E) WT or GLSKO SCC immunostaining for pEGFR. Cell nuclei were stained with DAPI. Quantification of pEGFR membrane enrichment in WT (n = 8) and GLSKO (n = 8) SCCs. Statistical significance (***P < 0.001) was calculated using a two-tailed t test. Scale bars, 100 μm. (F) Confocal microscopy of WT or GLSKO SCC immunostaining for pEGFR. Scale bar, 10 μm. (G) WT or LDHAKO SCC immunostaining for pEGFR. Cell nuclei were stained with DAPI. Quantification of pEGFR membrane enrichment in WT (n = 9) and LDHAKO (n = 9) SCCs. Statistical significance (*P < 0.05) was calculated using a two-tailed t test. Scale bars, 100 μm. (H) Schematic proposing ASCT2 and EGFR localizations in WT and GLSKO SCCs. Figure 6H was produced using BioRender.
Fig. 7.
Fig. 7.. Targeting both glutaminolysis and glycolysis in SCC.
(A) Schematic of transgenic mice used to knock out GLS and LDHA in HFSCs coupled with topical SCC chemical carcinogenesis using DMBA and TPA. (B) Quantification of time to papilloma n = 40 (WT), n = 88 (GLSKO), n = 15 (LDHAKO), and n = 12 (GLSKOLDHAKO) initiation. Each data point represents a tumor of that genotype. Quantification of the number of papilloma [n = 6 (WT), n = 10 (GLSKO), n = 6 (LDHAKO), n = 5 (GLSKOLDHAKO)] and SCC [n = 6 (WT), n = 10 (GLSKO), n = 6 (LDHAKO), n = 5 (GLSKOLDHAKO)]. Each data point represents a mouse of that genotype. Data shown represent tumors present at the end of the experiment. Quantification of percent and types of tumors formed per genotype: WT (papilloma = 48%; SCC = 30%; regress = 23%; necrotic = 0%), GLSKO (papilloma = 57%; SCC = 30%; regress = 8%; necrotic = 6%), LDHAKO (papilloma = 41%; SCC = 55%; regress = 4%; necrotic = 0%), and GLSKOLDHAKO (papilloma = 0%; SCC = 0%; regress = 67%; necrotic = 33%). (C) Necrotic tumors from GLSKOLDHAKO mice stained for H&E. Scale bar, 50 μm. Images of GLSKOLDHAKO mouse over time undergoing papilloma regression. (D) Schematic of summary of phenotypic results for GLSKOLDHAKO mice. (E) Tumor rates for WT (n = 26) and GLSKO (n = 73) tumors during DMBA/TPA chemical carcinogenesis. (F) Tumor rates for WT (n = 11) and GLSKO (n = 45) tumors treated with AZD0095 on day 137. Rates quantified before and after AZD0095 treatments. (G) Schematic of proposed mechanisms of metabolic flexibility in LDHAKO and GLSKO HFSC-induced SCCs. Figure 7 (A, C, D, and G) was produced using BioRender.

Update of

References

    1. Nassar D., Latil M., Boeckx B., Lambrechts D., Blanpain C., Genomic landscape of carcinogen-induced and genetically induced mouse skin squamous cell carcinoma. Nat. Med. 21, 946–954 (2015). - PubMed
    1. Anderson J. A., Irish J. C., Ngan B. Y., Prevalence of RAS oncogene mutation in head and neck carcinomas. J. Otolaryngol. 21, 321–326 (1992). - PubMed
    1. Pierceall W. E., Mukhopadhyay T., Goldberg L. H., Ananthaswamy H. N., Mutations in the p53 tumor suppressor gene in human cutaneous squamous cell carcinomas. Mol. Carcinog. 4, 445–449 (1991). - PubMed
    1. van der Schroeff J. G., Evers L. M., Boot A. J., Bos J. L., Ras oncogene mutations in basal cell carcinomas and squamous cell carcinomas of human skin. J. Invest. Dermatol. 94, 423–425 (1990). - PubMed
    1. White A. C., Tran K., Khuu J., Dang C., Cui Y., Binder S. W., Lowry W. E., Defining the origins of Ras/p53-mediated squamous cell carcinoma. Proc. Natl. Acad. Sci. U.S.A. 108, 7425–7430 (2011). - PMC - PubMed

Publication types

MeSH terms