. 2024 Sep 20;10(38):eadp5636.
doi: 10.1126/sciadv.adp5636. Epub 2024 Sep 20.

CheB localizes to polar receptor arrays during repellent adaptation

Affiliations

CheB localizes to polar receptor arrays during repellent adaptation

Hajime Fukuoka et al. Sci Adv. .

Abstract

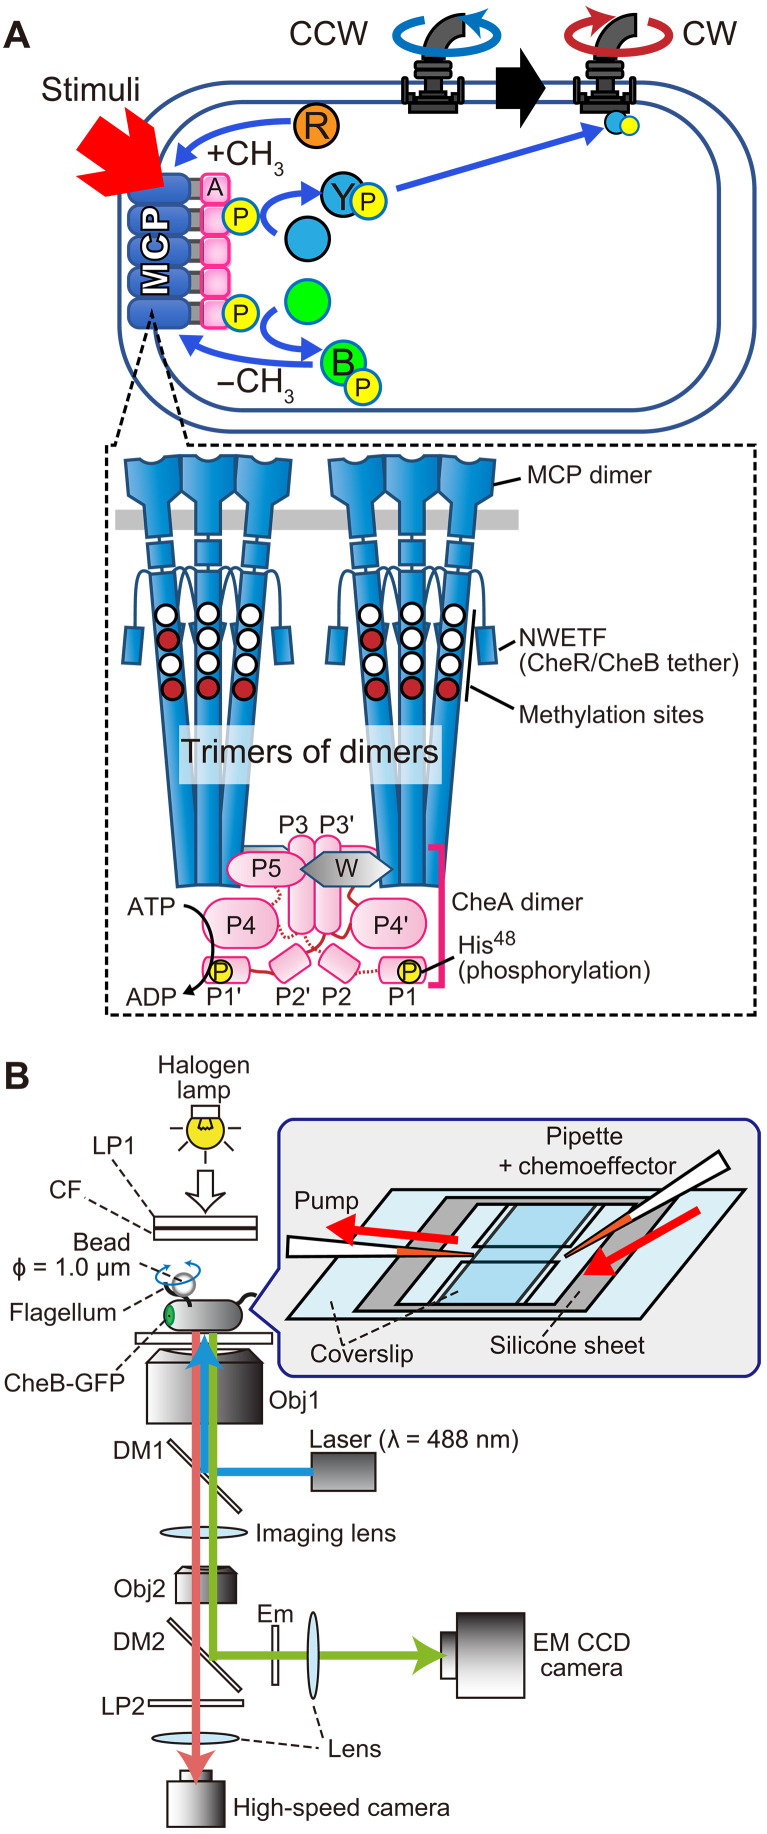
Adaptation of the response to stimuli is a fundamental process for all organisms. Here, we show that the adaptation enzyme CheB methylesterase of Escherichia coli assembles to the ON state receptor array after exposure to the repellent l-isoleucine and dissociates from the array after adaptation is complete. The duration of increased CheB localization and the time of highly clockwise-biased flagellar rotation were similar and depended on the strength of the stimulus. The increase in CheB at the receptor array and the decrease in cytoplasmic CheB were both ~100 molecules, which represents 15 to 20% of the total cellular content of CheB. We confirmed that the main binding site for CheB in the ON state array is the P2 domain of phosphorylated CheA, with a second minor site being the carboxyl-terminal pentapeptide of the serine chemoreceptor. Thus, we have been able to quantify the regulation of the signal output of the receptor array by the intracellular dynamics of an adaptation enzyme.


Figures

Fig. 1.
Fig. 1.. An overview of the E. coli sensory adaptation system and the method used to follow the localization of CheB-GFP and the switching of flagellar motors.
(A) E. coli sensory adaptation system. The signaling activity of the polar chemoreceptor (MCP) array at the cell pole modulates the autophosphorylation of the His48 residue in the P1 domain of the CheA (A) dimer, which, in turn, donates its phosphoryl groups (P) to CheY (Y-P) and CheB (B-P). CheY-P interacts with the flagellar motors to promote CW rotation. CheB deamidates and demethylates adaptation-site residues in the receptor signaling domain; phosphorylation of CheB enhances these activities. CheB preferentially acts on receptors in the kinase-ON state to shift their output toward the OFF state. CheR (R) preferentially methylates available adaptation sites on receptors in the kinase-OFF state to shift their output toward the ON state. CheW (W) is a scaffolding protein that couples CheA activity to receptor control. ADP, adenosine 5′-diphosphate. (B) Schematic diagram of the microscope and method used for simultaneously viewing polar-localized CheB-GFP and flagellar motor rotation. Cells were stuck to a coverslip via sticky flagellar filaments, and polystyrene beads (ϕ = 1.0 μm) were allowed to attach to the stubs of freely rotating sticky flagellar filaments extending into the medium. The angular velocity of each motor could be determined from the movement of the attached bead. Obj, objective lens; LP, long-pass filter; CF, cold filter; DM, dichroic mirror; Em, emission filter.
Fig. 2.
Fig. 2.. Simultaneous visualization of CheB-GFP and flagellar motor rotation after addition of 25 mM l-isoleucine.
(A) Sequential fluorescence images of an EFS073 cell harboring plasmids pPA114 [wild-type Tsr (WTTsr)] and pFSRB-GFP (CheR and CheB-GFP) before and after the addition of isoleucine. The arrowhead indicates increased CheB-GFP localization at a cell pole. Scale bar, 1 μm. The average images for every 10 s are shown. (B) Time traces of fluorescence intensities at the cell pole (red) and cytoplasm (blue) and the rotational velocity (green) of the cell shown in (A). The plus and the minus values in the rotational velocity represent CCW and CW rotation, respectively. The vertical dashed line marks the time of isoleucine addition. In this trial, the rotation of the motor stalled for a few seconds during the flow that introduced isoleucine. a.u., arbitrary units. (C) The gray lines represent the change in FI at the pole of individual 20 cells. Each trace was filtered by moving average, using an analytical window of 20 data points, which corresponds to 1 s; the red line shows the average of those traces. In these traces, the x-axis values were adjusted so that the start of the increase in FI was 0 s. All the time traces were adjusted so that the average intensity before addition of isoleucine (maximum of 20 s) was zero. (D) Sequential fluorescence images of an EFS073 cell carrying plasmids pUCI30a (TsrΔNWETF) and pFSRB-GFP before and after the addition of isoleucine. Scale bar, 1 μm. (E) Time traces of fluorescence intensities at the cell pole and in the cytoplasm and of the rotational velocity of the cell shown in (D). The rotation stalled briefly several times by the flow that introduced isoleucine. (F) The change in FI at the pole of 22 individual cells (gray) and the average of those traces (red).
Fig. 3.
Fig. 3.. Relationship between the strength of the repellent stimulus and the magnitude of the response.
(A) Duration of CheB-GFP localization (top) and CW rotation (bottom) of EFS073 cells harboring plasmids pPA114 (wild-type Tsr) and pFSRB-GFP (CheR and CheB-GFP) as a function of isoleucine concentration: 1 mM (pink; n = 8 cells), 5 mM (red; n = 13 cells), 15 mM (yellow ochre; n = 19 cells), 25 mM (green; n = 20 cells), 50 mM (light blue; n = 22 cells), and 100 mM (violet; n = 14 cells). Each data point represents a single cell. Blue diamonds show the average of duration in each isoleucine concentration. P > 0.05 [not significant (ns)], *P < 0.05, **P < 0.01, and ***P < 0.001 by Welch’s t test. (B) The relationship between the CW duration and the duration of localization. Colors are the same in (A). The black line shows the best-fit slope of the plot of the duration of polar localization against the duration of CW rotation. The slope of the approximate line and SE were 0.97 and 0.027. The Pearson’s correlation coefficient between these durations was 0.96.
Fig. 4.
Fig. 4.. Number of CheB-GFP molecules at cell pole and in the cytoplasm before and after the addition of 25 mM l-isoleucine.
Average numbers of CheB-GFP molecules at the cell pole (left) and in the cytoplasm (right) in EFS073 cells harboring plasmids pPA114 (wild-type Tsr) and pFSRB-GFP (CheR and CheB-GFP) are shown (n = 22 cells). Gray and blue represent before and after the addition of isoleucine, respectively. The error bar shows the SE. **P < 0.01 and ***P < 0.001 by Welch’s t test.
Fig. 5.
Fig. 5.. CheB localization in cells expressing mutant variants of Tsr or CheA.
A) Comparison of the increase in the CheB localization (ΔFI) between EFS073 cells producing wild-type Tsr and EFS073 cells producing TsrΔNWETF. The light blue and orange show the results with cells expressing wild-type Tsr (n = 20 cells) or TsrΔNWETF (n = 22 cells). The data are taken from Fig. 2 (C and F). Each data point represents the ΔFI of an individual cell. Bar graphs and error bars indicate the means and SDs, respectively. P > 0.05 (ns) by Welch’s t test. (B) Sequential 10-s fluorescence images (the average images every 10 s) of cells producing CheB-GFP and different CheA mutant proteins before and after stimulation with 25 mM isoleucine. Top: An EFS119 (CheAΔP2) cell producing wild-type Tsr showed weak localization (arrowhead). Middle: An EFS119 (CheAΔP2) cell producing TsrΔNWETF showed no localization. Bottom: An EFS121 cell (CheA-H48Q) cell producing wild-type Tsr showed no localization. Scale bars, 1 μm. See figs. S6 to S8 for time traces of fluorescence intensities at the cell pole and in the cytoplasm and the rotational velocity of the cells shown in (B). (C) Comparison of the FI at the cell pole before and after the addition of 25 mM isoleucine. The intensity at each cell pole was normalized by the average FI immediately before the addition of isoleucine (20 s at most), shown by the black dashed line. The average FI values at the poles of individual cells during the first 10 s after the addition of isoleucine are plotted. P > 0.05 (ns) and *P < 0.05 by Welch’s t test.
Fig. 6.
Fig. 6.. Response to isoleucine in cells producing GFP-CheR.
(A) Sequential fluorescence images (the average images every 10 s) of an EFS073 cell carrying plasmids pPA114 (wild-type Tsr) and pFSGFPRB1 (GFP-CheR and CheB) before and after the addition of 25 mM isoleucine. The arrowhead points to GFP-CheR localized at a cell pole. Scale bar, 1 μm. (B) The time traces of fluorescence intensities at the cell pole (red) and cytoplasm (blue) and the rotational velocity (green) of the cell shown in (A). The vertical dashed line indicates the time of isoleucine stimulation. (C) Gray lines indicate the normalized FI at the cell pole of eight individual cells. In these traces, the values on the x axis were adjusted so that the addition of isoleucine was at 0 s. Time traces of the FI at the cell pole were normalized to the average value for 20 s immediately before stimulation. The red line shows the average of the traces for individual cells. (D) FI at the cell pole after the addition of isoleucine. The average intensities of the first 10 s immediately after stimulation of cells producing GFP-CheR (blue; n = 8 cells) and CheB-GFP (gray; n = 20 cells). The black dashed line represents the average intensity before the addition of isoleucine.
Fig. 7.
Fig. 7.. CheB localization depends on the activity of the receptor array.
(Top) Steady state before the addition of isoleucine. The kinase activity of receptor array blinks between the OFF and ON states due to the oscillations at the methylation level (magenta circles in cytoplasmic domain of Tsr) by the interplay of CheB (green circle marked B) and CheR (orange circle marked R) action. Weak localization is observed because CheB binds only to CheA in the ON state array. (Middle) Active state. (1) When the repellent isoleucine binds to Tsr (red diamond), the receptor array is strongly biased toward the kinase-ON state. His48 in CheA is phosphorylated by ATP. (2) Phosphorylation induces a conformational change in CheA, which allows CheB to bind to CheA-P2 domain, and CheB is phosphorylated by CheA. This step is observed as majority of the increase in the polar localization of CheB after the addition of isoleucine. (3) CheB-P is released from CheA. (4) CheB-P is then free to interact with the NWETF pentapeptide of Tsr to perform demethylation of Tsr. The cycle from (1) to (4) would be repeated during the demethylation process. (5) Progressive demethylation of the MCP reduces the activity of the receptor array; therefore, the localization of CheB decreases. (Bottom) Steady state after adaptation. When adaptation is complete, the receptor array resumes the blinking of the array’s activity even in the presence of isoleucine. Because of demethylation by CheB, the methylation level of the receptor array is low compared to the top panel. CheR binds to the C-terminal NWETF pentapeptide of Tsr with a constant affinity regardless of the activity state of the receptor array.

References

    1. Wadhams G. H., Armitage J. P., Making sense of it all: Bacterial chemotaxis. Nat. Rev. Mol. Cell Biol. 5, 1024–1037 (2004). - PubMed
    1. R. Macnab, “Flagela and motility” in Eschericia coli and Salmonella, F. C. Neidhardt, Ed. (American Society for Microbiology, 1996), pp.123–145.
    1. Parkinson J. S., Hazelbauer G. L., Falke J. J., Signaling and sensory adaptation in Escherichia coli chemoreceptors: 2015 update. Trends Microbiol. 23, 257–266 (2015). - PMC - PubMed
    1. Turner L., Ryu W. S., Berg H. C., Real-time imaging of fluorescent flagellar filaments. J. Bacteriol. 182, 2793–2801 (2000). - PMC - PubMed
    1. Liu J., Hu B., Morado D. R., Jani S., Manson M. D., Margolin W., Molecular architecture of chemoreceptor arrays revealed by cryoelectron tomography of Escherichia coli minicells. Proc. Natl. Acad. Sci. U.S.A. 109, E1481–E1488 (2012). - PMC - PubMed

MeSH terms

Substances

LinkOut - more resources