. 2024 Sep 19;187(19):5431-5452.e20.
doi: 10.1016/j.cell.2024.07.022.

Microbial colonization programs are structured by breastfeeding and guide healthy respiratory development

Affiliations

Microbial colonization programs are structured by breastfeeding and guide healthy respiratory development

Liat Shenhav et al. Cell. .

Abstract

Breastfeeding and microbial colonization during infancy occur within a critical time window for development, and both are thought to influence the risk of respiratory illness. However, the mechanisms underlying the protective effects of breastfeeding and the regulation of microbial colonization are poorly understood. Here, we profiled the nasal and gut microbiomes, breastfeeding characteristics, and maternal milk composition of 2,227 children from the CHILD Cohort Study. We identified robust colonization patterns that, together with milk components, predict preschool asthma and mediate the protective effects of breastfeeding. We found that early cessation of breastfeeding (before 3 months) leads to the premature acquisition of microbial species and functions, including Ruminococcus gnavus and tryptophan biosynthesis, which were previously linked to immune modulation and asthma. Conversely, longer exclusive breastfeeding supports a paced microbial development, protecting against asthma. These findings underscore the importance of extended breastfeeding for respiratory health and highlight potential microbial targets for intervention.

Keywords: asthma; breastfeeding; computational biology; development; early life; gut microbiome; human milk; machine learning; microbial dynamics; microbiome development; nasal microbiome; respiratory health.


Conflict of interest statement

Declaration of interests M.B.A. receives research funding from the Canadian and US governments, the Bill and Melinda Gates Foundation, and the Garfield Weston Foundation. She holds a Canada Research Chair in Early Nutrition and the Developmental Origins of Health and Disease and is a fellow of the CIFAR Humans and the Microbiome program. She has consulted for DSM Nutritional Products, serves on the scientific advisory board for TinyHealth, and has received speaking honoraria from Prolacta Biosciences. She has contributed without remuneration to online courses on breast milk and the infant microbiome produced by Microbiome Courses. L.B. receives research funding from the United States National Institutes of Health and the Bill and Melinda Gates Foundation. L.B. is the UC San Diego Chair of Collaborative Human Milk Research endowed by the Family Larsson-Rosenquist Foundation in Switzerland. V.B. is currently an employee of F. Hoffman-La Roche Ltd.; however, the published work was done prior to her employment and does not involve/promote any of Roche’s materials or point of view.

Figures

Figure 1.
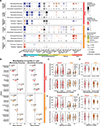
Figure 1.. Study design and nasal and gut microbiota composition in early-life in the CHILD cohort.
A) Timeline of early-life exposures, infant nasal and gut microbiome data, and respiratory phenotypes in the CHILD Cohort, and hypothesis testing across 3 axes: (axis-1) microbiome development and respiratory health, (axis-2) breastfeeding and microbiome development and (axis-3) breastfeeding and respiratory health. Sample sizes shown are after all preprocessing filters have been applied (see Fig. S1). B & C) Average relative abundances (%) of genera (defined by 16S rRNA gene sequencing) present in at least 70% of samples at either 3-months and/or 1-year of age for B) Nasal microbiota (3-month [n=2227], 1-year [n=1869]) and C) Gut microbiota (3-month [n=744], 1-year [n=728]). Numbers in brackets represent the number of samples used to calculate the average relative abundances.
Figure 2.
Figure 2.. Nasal and gut microbiome profiles and trajectories are associated with breastfeeding, preschool asthma, and other maternal, infant, and environmental factors.
A) Associations between early-life factors and infant nasal and gut microbiota analyzed by 16S rRNA gene sequencing at two time points (3 months [n=2227 for nasal, 744 for gut] and 1 year [n=1868 for nasal and n=728 for gut]) and as a trajectory (change from 3 months to 1 year [n=1545 for nasal and n=555 for gut]). Showing variation explained as the R2 of the linear model [richness (observed OTUs), diversity (Shannon index) and trajectories (change in richness and diversity from 3 months to 1 year)], or R2 of the redundancy analysis [microbiota composition]. P-values were adjusted using BH correction. Abbreviations: ‘Antibiotics, 1y’, any antibiotics given within the first year of life; ‘Antibiotics, Birth’, intrapartum antibiotics given to the mother; ‘BMI’, maternal pre-pregnancy body mass index. B) Associations between breastfeeding at sample collection and measures of microbiota richness and diversity, tested using multivariate linear regression. Adjusted models include the following covariates: older siblings, antibiotics, R/E virus, colds, maternal asthma, prenatal smoke exposure, Cesarean section, study center and exact age at 3-month sample collection. Estimates refer to exclusively breastfed vs. no longer breastfed at 3 months for 3-month and trajectory models and breastfed vs. no longer breastfed for 1-year models. Partially breastfeed infants were included to maximize sample sizes: Nasal 3 months, nasal 1 year, and nasal trajectory (n = 1545), gut 3 months, gut 1 year, and gut trajectory (n = 555). The same dataset was used for all models to ensure comparability. C-F) Within nasal and gut niches, microbiota richness and diversity compared between 3 months and 1 year of age (C & E) and microbiota richness and diversity trajectories (i.e., change between 3-months and 1-year) (D & F), for infants exclusively breastfed (Exclusive, nasal n=794, gut n=271 ) and those no longer breastfed (No BM, nasal n=234, gut n=79) at the 3-month sample collection (C-D), and for infants that did (nasal n= 80, gut n=56) and did not (nasal n=1236, gut n=421) develop asthma by 3 years (E-F). Comparisons tested using Mann-Whitney U test. *p<0.05; **p<0.001. BM, breastmilk.
Figure 3.
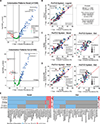
Figure 3.. Nasal and gut microbiota colonization patterns and their associations with breastfeeding and asthma.
A) Showing the difference in prevalence of microbiota between 3 months and 1 year in percent, for infants with 16S rRNA gene sequence data for nasal samples (n=170 taxa, n=1545 infants) or gut samples (n=115 taxa, n=555 infants; McNemar test) at both timepoints. The horizontal line indicates the p-value threshold (pBH<0.001), and vertical lines indicate the effect size thresholds (−7% and 7%) used to define early (more prevalent at 3 months), persistent (similar prevalence at both timepoints) and late (more prevalent at 1 year) colonizers. The 3 early and late colonizers with the highest effect sizes are annotated. BHadj, Benjamini-Hochberg adjusted p-values. Also see Table S3. B) Graphical legend for the Prevalence trajectory coordinate system (PreTCO system) C-D) Prevalence trajectory coordinate analyses comparing the change in prevalence of microbiota (1 year – 3-month prevalence in percent; Methods) between healthy infants (nasal n=1236, gut n=421), and those diagnosed with asthma at 3 years (nasal n=80, gut n=56) (C), and between exclusively breastfed infants (Exclusive BM, nasal n=794, gut n=271) and those no longer breastfed at 3-month sampling (No BM, nasal n=234, gut n=79) (D). The 4 OTUs with the largest effect size are labeled for each comparison. The overall prevalence across both timepoints is shown as point size. Also see Table S4. E) Nasal and gut microbiota that were significantly later (blue) or earlier (pink) colonizers in infants without vs. with asthma at 3 years, showing whether these taxa were also found later or earlier in infants 1) exclusively breastfed (nasal n=794, gut n=271) vs. no longer breastfed (nasal n=234, gut n=79) at 3-month sampling, 2) without asthma at 3 and 5 years (nasal n=1038, gut n=347) vs. with asthma at 3 and 5 years (nasal n=53, gut n=35). The annotation bar to the right shows the fraction of the 36 nasal and 36 gut taxa found later in infants without asthma that were also found later in the other comparisons. Significance of later compared to earlier colonization was determined using a permutation test. Only microbiota with prevalence trajectories that differed between infants with and without asthma with p<0.05 are shown. BM, breast milk.
Figure 4.
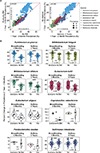
Figure 4.. Timing of acquiring microbial functions in the first year of life is associated with breastfeeding and asthma.
A) PreTCO system analyses comparing the change in prevalence of enzyme-catalyzed reaction pathways, based on EC numbers from metagenomic data (1 year – 3-month prevalence in percent; Methods) between 1) infants exclusively breastfed (n = 658) and those no longer breastfed at 3 months (n = 202); and 2) healthy infants (n=1075), and those later diagnosed with asthma at 3 years (n=79). Each point represents an EC annotation from the taxa listed in the key to the right, differentiated by color. The median (IQR) change in prevalence of each group is shown on the group’s axis. Overall significance was tested using a Mann-Whitney U test. The overall prevalence across both timepoints is shown as point size. Replicated for EggNOG orthologs (see Fig. S7). B) Percent change in prevalence of EC orthologs, stratified by species. Significance was tested using a Wilcoxon signed-rank test. Each point represents a single function from the focal species. As an effect size, the median of the difference in the trajectory measure (percent change in prevalence) is shown. Sample sizes for this test are the number of functions (differs per species, as annotated in the plot). *p(fdr)<0.05; **p(fdr)<0.001. Replicated for EggNOG orthologs and sample size sensitivity analysis (see Fig. S7).
Figure 5.
Figure 5.. Premature acquisition of specific R.gnavus functions are linked to early breastfeeding cessation, increased asthma risk, and tryptophan metabolite variations.
A) Overlap in the EC annotations stratified by species introduced significantly later in exclusively breastfed infants (Exclusive BM) compared to those no longer breastfed at 3 months sampling (No BM), and later in infants that did not develop asthma (No Asthma) compared to those that did at 3 years (p < 0.01). Significance of individual pathway was tested using a permutation test. B) Percent change in prevalence between 3 months and 1 year within each phenotype, for 12 EC that were significantly later in infants that did not develop asthma at 3 years (p<0.01, permutation test). Only showing the percent change in prevalence where p<0.01 (gray indicates p>0.01). EC names: 2.4.2.18 = Anthranilate phosphoribosyltransferase, 1.11.1.1 = NADH peroxidase, 3.2.1.22 = Alpha-galactosidase, 2.7.7.7 = DNA-directed DNA polymerase, 5.99.1.2 = DNA topoisomerase, 3.5.1.2 = Glutaminase, 1.3.1.76 = Precorrin-2 dehydrogenase, 3.5.1.24 = Choloylglycine hydrolase, 1.1.1.38 = Malate dehydrogenase, 1.4.1.16 = Diaminopimelate dehydrogenase, 2.1.1.144 = Trans-aconitate 2-methyltransferase, 2.7.8.26 = Cobalamin synthase C) Comparing normalized concentrations of Tryptophan, Tryptamine and Indoe over time (3 months and 1 year) among exclusively breastfed infants (n=127) and those no longer breastfed at 3-month sampling (n=140) and healthy infants (n=393) compared to those that develop asthma at 3 years (n=34). D) Differences in SCFAs (butyrate, propionate, valerate and acetic acid) between exclusively breastfed infants (n=69) and those no longer breastfed at 3-month sampling (n=134), suggesting an early weaning reaction in the latter group; tested using Mann-Whitney U test. Also showing change in SCFAs between 3 months and 1 year within exclusively breastfed infants (n=63) and those no longer breastfed at 3 months (n=112); tested using Wilcoxon signed-rank test for infants with data at both 3 months and 1 year. *pBH<0.05; **pBH<0.001
Figure 6.
Figure 6.. High prediction accuracy for asthma at 3 years based on nasal and gut microbiome colonization patterns and human milk components.
A machine learning model, gradient-boosted decision trees, trained to differentiate between children that were diagnosed with asthma at 3 years (N = 80 for nasal and 56 for gut) and healthy controls (N = 1327 for nasal and 479 for gut). Prediction accuracy was evaluated by using held-out samples unused during training. A) receiver operating characteristic curves using different combinations of predictor variables as shown (see supplementary Table S5 for true vs. predicted values). B) Feature importance plot for the “nasal microbiome trajectories” prediction of asthma at 3 years (red curve in panel A), colored by phylum; circle size corresponds to the prevalence of this feature in the data. C) receiver operating characteristic curves using the gut microbiome at 3 months, gut microbiome at 1-year, gut microbiome trajectories and gut microbiome trajectories with milk components (HMOs, fatty acids, immune factors). D) Feature importance plot for the “gut microbiome trajectories” prediction of asthma at 3 years (red curve in panel C), colored by phylum; circle size corresponds to the prevalence of this feature in the data.
Figure 7.
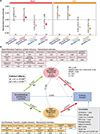
Figure 7.. Nasal and gut colonization patterns are associated with breastfeeding exclusivity and asthma in multivariate models and mediate the association between breastfeeding exclusivity and asthma.
A) Standardized beta-estimates with 95% confidence intervals for unadjusted and adjusted regression models for associations between a nasal or gut microbiota trajectory latent variable and 1) breastfeeding (nasal: exclusive n=794, partial n=517, No BM =234, gut: exclusive n=271, partial=205, No BM=79), and 2) asthma (nasal: healthy n=1236, asthma n=80, gut: healthy n=421, asthma n=56).The following potential confounders were included in adjusted models: antibiotics in the first year of life, older siblings, prenatal smoke, birth mode, maternal asthma, study center, R/E virus at 1 year, colds in the first 3 months, and infant age at 3-month sampling. Variable selection for latent constructs was informed based on univariate associations with both asthma and breastfeeding (Methods).. *p<0.05, **p<0.001 B) A structural equation model showing the mediating effects of nasal and gut microbiota trajectories on the association between breastfeeding exclusivity at 3 months and asthma at 3 years. Standardized beta-coefficients are reported, adjusted for all covariates listed, with p-values denoted by: *p<0.05, **p<0.001. Positive associations with microbiota trajectories indicate delayed microbiota colonization (Later), whereas negative associations indicate earlier colonization. Variable selection for latent constructs is done similarly to Fig. 7a (Methods). We included infants with data on both nasal and gut microbiota (34 infants with asthma, and 307 infants without asthma diagnosed at 3 years), and breastfeeding exclusivity was an ordered variable (exclusive, partial or no human milk at 3-month sampling). See Table S6 and Figure S9 for details, including both standardized and unstandardized estimates, and separate nasal and gut microbiota models.

References

    1. Abrams GD, Bauer H, and Sprinz H (1963). Influence of the normal flora on mucosal morphology and cellular renewal in the ileum. A comparison of germ-free and conventional mice. Lab. Invest. 12, 355–364. - PubMed
    1. Bouskra D, Brézillon C, Bérard M, Werts C, Varona R, Boneca IG, and Eberl G (2008). Lymphoid tissue genesis induced by commensals through NOD1 regulates intestinal homeostasis. Nature 456, 507–510. - PubMed
    1. Charbonneau MR, Blanton LV, DiGiulio DB, Relman DA, Lebrilla CB, Mills DA, and Gordon JI (2016). A microbial perspective of human developmental biology. Nature 535, 48–55. - PMC - PubMed
    1. Rao C, Coyte KZ, Bainter W, Geha RS, Martin CR, and Rakoff-Nahoum S (2021). Multi-kingdom ecological drivers of microbiota assembly in preterm infants. Nature 591, 633–638. - PMC - PubMed
    1. Derrien M, Alvarez A-S, and de Vos WM (2019). The Gut Microbiota in the First Decade of Life. Trends Microbiol. 27, 997–1010. - PubMed