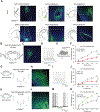
. 2024 Nov 20;112(22):3750-3767.e7.
doi: 10.1016/j.neuron.2024.08.013. Epub 2024 Sep 19.

An amygdalar oscillator coordinates cellular and behavioral rhythms

Affiliations

An amygdalar oscillator coordinates cellular and behavioral rhythms

Qiang Liu et al. Neuron. .

Abstract

Circadian rhythms are generated by the master pacemaker suprachiasmatic nucleus (SCN) in concert with local clocks throughout the body. Although many brain regions exhibit cycling clock gene expression, the identity of a discrete extra-SCN brain oscillator that produces rhythmic behavior has remained elusive. Here, we show that an extra-SCN oscillator in the lateral amygdala (LA) is defined by expression of the clock-output molecule mWAKE/ANKFN1. mWAKE is enriched in the anterior/dorsal LA (adLA), and, strikingly, selective disruption of clock function or excitatory signaling in adLAmWAKE neurons abolishes Period2 (PER2) rhythms throughout the LA. mWAKE levels rise at night and promote rhythmic excitability of adLAmWAKE neurons by upregulating Ca2+-activated K+ channel activity specifically at night. adLAmWAKE neurons coordinate rhythmic sensory perception and anxiety in a clock-dependent and WAKE-dependent manner. Together, these data reveal the cellular identity of an extra-SCN brain oscillator and suggest a multi-level hierarchical system organizing molecular and behavioral rhythms.

Keywords: SCN; anxiety; circadian; clock; lateral amygdala; local clock; mWAKE; rhythm; touch.


Conflict of interest statement

Declaration of interests The authors declare no competing interests.

Figures
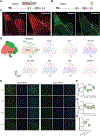
Figure 1.
Figure 1.. LAmWake neuron identity and core clock rhythms
(A) Schematic for the mWake(Cre) transgene showing the genomic locus of mWake and replacement of exon 5 with a tdTomato-P2A-Cre-stop cassette. (B) Schematic for the mWake(V5) transgene showing the genomic locus of mWake and insertion of an in-frame V5 tag at the C-terminus. (C) Representative confocal images of anterior and posterior LA showing native tdTomato signal in an mWake(Cre/+) mouse (left) and anti-V5 immunostaining in an mWake(V5/V5) mouse (right), with “BA” (basal amygdala), “CeA” (central amygdala), “adLA” (anterior dorsal LA), “pvLA” (posterior ventral), and “Pericapsular” regions indicated. Scale bars represent 200 μm. (D) Schematic (left) and UMAP (Uniform Manifold Approximation and Projection) plots (right) showing 2 primary mWake-positive neuronal clusters in the LA (adLA and pvLA) and distribution of various marker genes across these clusters. Abbreviations: Cck (cholecystokinin), GRP (gastrin-releasing peptide), Myl4 (myosin light chain 4), Otof (otoferlin), Slc17a7 (VGLUT1), Slc17a6 (VGLUT2), and Slc32a1 (VGAT). (E) Representative confocal images of PER2 immunostaining in the adLA and pvLA regions at CT1, CT7, CT13 and CT19 in wild-type (WT) mice. DAPI and merged channels are also shown. Scale bars denote 50 μm. (F and G) Relative levels of PER2 intensity in the adLA region (F) (represented as a fold-change relative to CT1) at CT1 (n=23), CT7 (n=21), CT13 (n=22), and CT19 (n=18) and pvLA region (G) at CT1 (n=17), CT7 (n=13), CT13 (n=17), and CT19 (n=13) in WT mice. Data represented as simplified boxplots showing median with 1st and 3rd quartile boxes. n represents total number of sections, collected from 3–4 mice at each time point; JTK cycle test. In this figure and the following, error bars represent SEM and “*”, “**”, and “***” denote P<0.05, P<0.01, and P<0.001, respectively. (H) Relative levels of PER2 intensity in adLA and pvLA regions at CT1 condition (represented as a fold-change relative to adLA). Data represented as simplified boxplots showing median with 1st and 3rd quartile boxes; Mann-Whitney U test. Data in (H) are from the same dataset shown in (F and G). See also Figure S1 and Table S1 and S2.
Figure 2.
Figure 2.. adLAmWAKE neurons organize molecular rhythms in the LA
(A) Schematics illustrating design of the Clock dominant negative (Clock-DN) construct (top) and Cre-dependent Clock-DN virus (bottom). (top) 17 aa from the DNA-binding basic region of Clock (Lys31-Arg47) are deleted in the Clock-DN construct. The helix-loop-helix (HLH) and PAS domains are indicated by orange and blue boxes, respectively. (bottom) The AAV-DIO-Clock-DN-P2A-EYFP sequence includes an EF1α promoter, an inverted Clock-DN-P2A-EYFP cassette flanked by a pair of loxP (orange) and lox2722 (purple) sites with inward orientation, a woodchuck hepatitis virus post-transcriptional regulatory element (WPRE), and polyA signal. (B) Schematic image showing the injection of AAV-DIO-Clock-DN-P2A-EYFP or AAV-FLEX-Cas9-sgVGLUT1-sgVGLUT2 virus into the adLA of mWake(Cre/+) mice. (C) Representative confocal images of native EYFP and tdTomato or PER2 immunostaining in the adLA region at CT1 vs CT13 in mWake(Cre/+) mice with either AAV-DIO-EYFP (top) or AAV-DIO-Clock-DN-P2A-EYFP (bottom) injected bilaterally into the adLA. Merged channels are also shown. Scale bars denote 50 μm. (D and E) Relative levels of PER2 intensity in mWAKE-positive (red) and mWAKE-negative (blue) cells in adLA at CT1 vs CT13 from mWake(Cre/+) mice injected with either AAV-DIO-EYFP (D) (CT1, n=21; CT13, n=13) or AAV-DIO-Clock-DN-P2A-EYFP (E) (CT1, n=19; CT13, n=16) injected bilaterally into the LA. Data represented as simplified boxplots showing median with 1st and 3rd quartile boxes. n represents total number of sections, collected from 3–4 mice for each condition. Data represented as a fold-change relative to the signal for mWAKE-positive cells under control CT1 condition; Mann-Whitney U tests with Bonferroni correction. (F) Representative confocal images of native tdTomato and PER2 or Cas9 immunostaining in the adLA region at CT1 vs CT13 in mWake(Cre/+) mice with either control AAV-FLEX-Cas9-sgLacZ or AAV-FLEX-Cas9-sgVGLUT1-sgVGLUT2 injected bilaterally into the adLA. Merged channels are also shown. Scale bars denote 50 μm. (G and H) Relative levels of PER2 intensity in mWAKE-positive (yellow) and mWAKE-negative (purple) cells in the adLA region at CT1 vs CT13 in mWake(Cre/+) mice with either AAV-FLEX-Cas9-sgLacZ (CT1, n=12; CT13, n=13) (G) or AAV-FLEX-Cas9-sgVGLUT1-sgVGLUT2 (CT1, n=28; CT13, n=26) (H) injected bilaterally into the adLA. Data represented as simplified boxplots showing median with 1st and 3rd quartile boxes. n represents number of sections, and 4 mice were used for each condition. Data represented as a fold-change relative to the signal in control mWAKE-positive neurons at CT1; Mann-Whitney U tests with Bonferroni correction. (I) Model. mWAKE-positive neurons are enriched in the adLA, which exhibits PER2 cycling. adLA neurons project to themselves and to the pvLA, and this excitatory signaling is required for PER2 rhythms in the adLA and pvLA. See also Figure S2 and S3, Table S3 and S4.
Figure 3.
Figure 3.. Cycling of mWAKE and neuronal excitability in adLAmWAKE neurons
(A and B) Representative immunoblot (A) and relative levels of mWAKE-V5 normalized to a β-actin loading control (B) from Western blot analyses of mWake(V5/V5) LA tissue using anti-V5 antibodies at CT1, CT7, CT13, and CT19 (n=7 mice for all time points); JTK cycle test. (C) Representative membrane potential traces from whole-cell patch-clamp recordings of adLAmWAKE neurons following current injection of −40 pA and 100 pA in mWake(Cre/+) and mWake(Cre/Cre) mice at ZT0–2 and ZT12–14. (D) f-I curves for adLAmWAKE neurons from mWake(Cre/+) (blue, left) or mWake(Cre/Cre) (red, right) mice at ZT0–2 (open circles) vs ZT12–14 (closed circles) (n=10–13 cells for each group from 3–4 animals); two-way ANOVA with post-hoc Sidak. (E and F) Rheobase (minimum current amplitude to trigger an action potential) (E) and input resistance (Rin) (F) for adLAmWAKE neurons in mWake(Cre/+) (blue) or mWake(Cre/Cre) (red) mice at ZT0–2 vs ZT12–14. Data are from the same cells shown in (D); two-way ANOVA with post-hoc Sidak. (G) Representative membrane potential traces from whole-cell patch-clamp recordings of mWAKE-negative LA neurons following current injection of −40 pA or 100 pA at ZT0–2 and ZT12–14. (H-J) f-I curves (H), rheobase (I), and input resistance (J) for mWAKE-negative adLA neurons from mWake(Cre/+) mice at ZT0–2 (green) vs ZT12–14 (magenta) (n=7 cells for each group from 3 animals); two-way ANOVA post-hoc Sidak. (K) Averaged traces of BK current in adLAmWAKE neurons from mWake(Cre/+) (top) and mWake(Cre/Cre) (bottom) at ZT0–2 (orange) vs ZT12–14 (blue). (L) Average BK current at different voltage steps in adLAmWAKE neurons from mWake(Cre/+) (left) and mWake(Cre/Cre) (right) at ZT0–2 (orange) vs ZT12–14 (blue). (n=7–10 cells from 3 animals). Shading denotes SEM. (M) Peak amplitude of BK current in adLAmWAKE neurons from mWake(Cre/+) and mWake(Cre/Cre) at ZT0–2 (orange) vs ZT12–14 (blue). Data are from the same dataset as in (L); two-way ANOVA post-hoc Sidak. See also Figure S4 and Table S3.
Figure 4.
Figure 4.. adLAmWAKE neurons inhibit mechanical sensitivity via projections to S2
(A) Schematics and representative confocal images of native GFP signal following injection of AAV1-FLEX-EGFP virus into the adLA of an mWake(Cre/+) mouse showing cell bodies in adLA and terminal projections in NAc core (nucleus accumbens core), S2 (secondary somatosensory cortex), BNST (bed nucleus of the stria terminals), ACx (auditory cortex), and SN (substantia nigra). Scale bars represent 200 μm. (B) Schematic showing bilateral injections of AAV-DIO-ChR2-EYFP virus and optical fiber implantation into the adLA of mWake(Cre/+) mice. (C) Representative confocal image of YFP native fluorescence in the adLA (dashed outline) following injection of the virus described in (B). Location of optical fiber (solid line) is shown. Scale bar represents 100 μm. (D) Representative membrane potential trace from a whole-cell patch-clamp recording of an adLAmWAKE neuron showing action potentials triggered by adLA optogenetic stimulation. Recordings were obtained from in vitro tissue slices. Blue boxes indicate 5 ms blue light pulses. (E) Schematic depicting the mechanical sensitivity assay applying Von Frey filaments to deliver touch stimuli of different strengths, while activating the circuit using wireless optogenetic stimulation. (F) Average hind foot withdrawal (%) in response to mechanical stimuli delivered using von Frey filaments of different strengths in the presence of 20 Hz optogenetic stimulation of adLAmWAKE neurons in mWake(Cre/+) mice injected with AAV-DIO-ChR2-EYFP (n=4, red) or control AAV-DIO-EYFP (n=5, gray); two-way ANOVA with post-hoc Sidak. (G) Schematics showing bilateral injections of AAV-DIO-ChR2-EYFP into the adLA (left) and optical fiber implantation into the S2 region (right) of mWake(Cre/+) mice. (H) Representative confocal image of YFP native fluorescence in S2 (dashed outline) for the mouse shown in (G). Location of optical fiber (solid line) is shown. Scale bar represents 100 μm. (I) Representative membrane potential trace from a whole-cell patch-clamp recording of an S2 neuron near adLAmWAKE terminals showing action potentials triggered by S2 optogenetic stimulation. Recordings were obtained from in vitro tissue slices. Blue boxes indicate 5 ms blue light pulses. (J) Average hind foot withdrawal (%) in response to mechanical stimuli delivered using von Frey filaments of different strengths in the presence of 20 Hz optogenetic stimulation of the S2 terminals of adLAmWAKE neurons in mWake(Cre/+) mice injected with AAV-DIO-ChR2-EYFP (n=5, red) or control AAV-DIO-EYFP (n=6, gray); two-way ANOVA with post-hoc Sidak. (K) Schematics showing bilateral injections of AAV-DIO-eNpHR3.0-EYFP into the adLA (left) and optical fiber implantation into the S2 region (right) of mWake(Cre/+) mice. (L) Representative confocal image of YFP native fluorescence in S2 (dashed outline) for the mouse shown in (K). Location of optical fiber (solid line) is shown. Scale bar represents 100 μm. (M) Representative membrane potential trace from a whole-cell patch-clamp recording of an S2 neuron near adLAmWAKE terminals showing the decrease in action potential frequency induced by S2 optogenetic inhibition. Recording was obtained from an in vitro tissue slice. The green line indicates 10 s (20 Hz, 5 ms) green LED stimulation. (N) Average hind foot withdrawal (%) in response to mechanical stimuli delivered using von Frey filaments of different strengths in the presence of 20 Hz optogenetic stimulation (yellow light) of the S2 terminals of adLAmWAKE neurons in mWake(Cre/+) mice injected with AAV-DIO-eNpHR3.0-EYFP (n=4, green) or control AAV-DIO-EYFP (n=5, gray); two-way ANOVA with post-hoc Sidak. See also Figure S5 and S6 and Table S3.
Figure 5.
Figure 5.. adLAmWAKE neurons enhance anxiety via projections to NAc core
(A) Schematic showing bilateral injections of AAV-DIO-ChR2-EYFP virus and optical fiber implantation into the adLA of an mWake(Cre/+) mouse. (B and C) Representative locomotor activity tracks (B) and average time (s) spent in the LED light-stimulating side in 5 min bins (C) during a 20 min place preference/avoidance test during for the mice described in (A), injected with AAV-DIO-ChR2-EYFP (n=5, red) or control AAV-DIO-EYFP (n=6, black). 20 Hz optogenetic stimulation of adLAmWAKE neurons was delivered when the mouse entered the “on” side and stopped when it entered the “off” side. (D) Schematics showing bilateral injections of AAV-DIO-ChR2-EYFP into the adLA (left) and optical fiber implantation into the NAc core region (right) of mWake(Cre/+) mice. (E) Representative confocal image of YFP native fluorescence in NAc core (dashed outline) for the mouse shown in (D). Location of optical fiber (solid line) is shown. Scale bar represents 100 μm. (F) Representative membrane potential trace from a whole-cell patch-clamp recording of a NAc core neuron near adLAmWAKE terminals showing action potentials triggered by NAc core optogenetic stimulation. Blue boxes indicate 5 ms blue light pulses. (G) Average time (s) spent in the LED light stimulating side in 5 min bins during a 20 min place preference/avoidance test for mWake(Cre/+) mice injected with AAV-DIO-ChR2-EYFP (n=4, red) or control AAV-DIO-EYFP (n=4, black). 20 Hz optogenetic stimulation of the NAc terminals of adLAmWAKE neurons was delivered when the mouse entered the “on” side and stopped when it entered the “off” side. (H and I) Representative locomotor activity tracks (H) and average time (s) spent in center zone (I) in open field assay during 5 min 20 Hz optogenetic stimulation of mWake(Cre/+) mice injected with AAV-DIO-ChR2-EYFP (n=4, red) or control AAV-DIO-EYFP (n=5, gray) into the adLA with optical fibers implanted in the NAc core. Center zone is indicated by yellow square; unpaired t-test, two-tailed. (J and K) Representative locomotor activity tracks (J) and average time (s) spent in open arm (K) during elevated plus maze assays during 5 min 20 Hz optogenetic stimulation of mWake(Cre/+) mice injected with AAV-DIO-ChR2-EYFP (n=5, red) or control AAV-DIO-EYFP (n=5, gray) into the adLA with optical fibers implanted in NAc. Closed and open arms indicated with thick black lines and thin yellow lines, respectively; unpaired t-test, two-tailed. See also Figure S6 and Table S3.
Figure 6.
Figure 6.. A local clock in adLAmWAKE neurons is required for rhythmic regulation of mechanical sensitivity and anxiety.
(A) Schematic showing bilateral injection of Cre-dependent Clock-DN virus (AAV-DIO-Clock-DN-P2A-EYFP) in the adLA of mWake(Cre/+) mice. (B and C) Average hind foot withdrawal (%) in response to mechanical stimuli delivered using von Frey filaments of different strengths at CT0–2 (gray) or CT12–14 (red) for mWake(Cre/+) mice injected with control AAV-DIO-EYFP (B) (CT0–2, n=5; CT12–14, n=8) or AAV-DIO-Clock-DN-P2A-EYFP (C) (CT0–2, n=5; CT12–14, n=5) into the adLA; two-way ANOVA with post-hoc Sidak. (D and E) Representative locomotor activity tracks in open field assays at CT0–2 or CT12–14 for mWake(Cre/+) mice injected with control AAV-DIO-EYP (EYFP) (D) or AAV-DIO-Clock-DN-P2A-EYFP (Clock-DN) (E) into the adLA. Center zone is indicated by yellow square. (F and G) Average time (s) spent in center zone in open field assay at CT0–2 vs CT12–14 for mWake(Cre/+) mice injected with control AAV-DIO-EYFP (F) (EYFP: CT0–2, n=7 (blue); CT12–14, n=6 (red)) or AAV-DIO-Clock-DN-P2A-EYFP (G) (Clock-DN: CT0–2, n=6 (cyan); CT12–14, n=5 (pink)) into the adLA; unpaired t-test, two-tailed. (H and I) Representative locomotor activity tracks for elevated plus maze assays at CT0–2 vs CT12–14 for mWake(Cre/+) mice injected with control AAV-DIO-EYFP (H) (EYFP) or AAV-DIO-Clock-DN-P2A-EYFP (I) (Clock-DN) into the adLA. Closed and open arms indicated with thick black lines and thin yellow lines, respectively. (J and K) Average time (s) spent in open arm during elevated plus maze assays at CT0–2 vs CT12–14 for mWake(Cre/+) mice injected with control AAV-DIO-EYFP (J) (CT0–2, n=7 (blue); CT12–14, n=7 (red)) or AAV-DIO-Clock-DN-P2A-EYFP (K) (CT0–2, n=6 (cyan); CT12–14, n=5 (pink)) into the adLA; unpaired t-test, two-tailed. (L) Representative confocal images of PER2 immunostaining in the adLA region at CT1 vs CT13 in WT mice in the presence (right) or absence (left) of pulsed TMT exposure across 4 days. DAPI and merged channels are also shown. Scale bars denote 50 μm. (M) Relative levels of PER2 intensity (represented as a fold-change relative to CT1 in controls) at CT1 vs CT13 in WT mice in the presence (TMT, purple; CT1, n=22; CT13, n=23) or absence (Control, green; CT1, n=20; CT13, n=22) of TMT. Data represented as simplified boxplots showing median with 1st and 3rd quartile boxes. N represents number of sections, and 3–4 mice were used for each condition; Mann-Whitney U tests with Bonferroni correction. See also Figure S6 and S7 and Table S3.
Figure 7.
Figure 7.. mWAKE mediates rhythmic control of mechanical sensitivity and anxiety
(A) Schematic showing bilateral injections of AAV-Cre-EGFP into the adLA of mWake(flox/−) mice. (B) Representative confocal image of the adLA for the mouse shown in (A), showing native GFP and DAPI signals. Scale bar denotes 50 μm. (C and D) Average hind foot withdrawal (%) in response to mechanical stimuli delivered using von Frey filaments of different strengths at CT0–2 (gray) or CT12–14 (red) for mWake(flox/−) mice injected with control AAV-EGFP (CT0–2, n=7; CT12–14, n=8) (C) or AAV-Cre-EGFP (CT0–2, n=9; CT12–14, n=8) (D) into the adLA; two-way ANOVA with post-hoc Sidak. (E and F) Representative locomotor activity tracks for elevated plus maze assays at CT0–2 vs CT12–14 for mWake(flox/−) mice injected with control AAV-EGFP (E) (EGFP) or AAV-Cre-EGFP (F) (Cre) into the adLA. Closed and open arms indicated with thick black lines and thin yellow lines, respectively. (G and H) Average time spent in open arm during elevated plus maze assays at CT0–2 vs CT12–14 for mWake(flox/−) mice injected with control AAV-EGFP (G) (CT0–2, n=7 (blue); CT12–14, n=10 (red)) or AAV-Cre-EGFP (H) (CT0–2, n=9 (yellow); CT12–14, n=10 (rose)) into the adLA; unpaired t-test, two-tailed. (I) Model. mWAKE expression defines a subset of LA neurons that function as an extra-SCN circadian oscillator. mWAKE levels rise at night under clock control. mWAKE, in turn, upregulates BK current at night, thus inhibiting the excitability of mWAKE-positive neurons (red circles), but not mWAKE-negative neurons (empty circles), at that time. This electrical cycling promotes greater activity of adLAmWAKE neurons in the daytime and reduced activity of these cells in the nighttime. adLAmWAKE neurons inhibit mechanical sensitivity and promote anxiety via projections to S2 and NAc, respectively. Thus, during the day, this circuit mechanism leads to a CLOCK- and mWAKE-dependent increase in anxiety (encouraging mice to seek shelter) and decrease in sensory perception (enhancing sleep amount or quality). Conversely, during their active period at night, these processes result in reduced anxiety (encouraging mice to explore) and enhanced sensory perception while engaging with the environment. Taken together with their function in regulating regional clock gene rhythms (Figure 2I), these findings suggest that adLAmWAKE neurons play a privileged role in organizing cellular and behavioral rhythms. Images of awake and sleeping mice were obtained from https://www.figdraw.com. See also Figure S7 and Table S3.

References

    1. Mohawk JA, Green CB, and Takahashi JS (2012). Central and peripheral circadian clocks in mammals. Annu Rev Neurosci 35, 445–462. 10.1146/annurev-neuro-060909-153128. - DOI - PMC - PubMed
    1. Herzog ED (2007). Neurons and networks in daily rhythms. Nat Rev Neurosci 8, 790–802. 10.1038/nrn2215. - DOI - PubMed
    1. Ukai H, and Ueda HR (2010). Systems biology of mammalian circadian clocks. Annu Rev Physiol 72, 579–603. 10.1146/annurev-physiol-073109-130051. - DOI - PubMed
    1. Weaver DR (1998). The suprachiasmatic nucleus: a 25-year retrospective. J Biol Rhythms 13, 100–112. 10.1177/074873098128999952. - DOI - PubMed
    1. Begemann K, Neumann AM, and Oster H (2020). Regulation and function of extra-SCN circadian oscillators in the brain. Acta Physiol (Oxf) 229, e13446. 10.1111/apha.13446. - DOI - PubMed

Substances

LinkOut - more resources