. 2024 Sep 20;7(12):e202402719.
doi: 10.26508/lsa.202402719. Print 2024 Dec.

PRDM16 determines specification of ventricular cardiomyocytes by suppressing alternative cell fates

Affiliations

PRDM16 determines specification of ventricular cardiomyocytes by suppressing alternative cell fates

Jore Van Wauwe et al. Life Sci Alliance. .

Abstract

PRDM16 is a transcription factor with histone methyltransferase activity expressed at the earliest stages of cardiac development. Pathogenic mutations in humans lead to cardiomyopathy, conduction abnormalities, and heart failure. PRDM16 is specifically expressed in ventricular but not atrial cardiomyocytes, and its expression declines postnatally. Because in other tissues PRDM16 is best known for its role in binary cell fate decisions, we hypothesized a similar decision-making function in cardiomyocytes. Here, we demonstrated that cardiomyocyte-specific deletion of Prdm16 during cardiac development results in contractile dysfunction and abnormal electrophysiology of the postnatal heart, resulting in premature death. By combined RNA+ATAC single-cell sequencing, we found that PRDM16 favors ventricular working cardiomyocyte identity, by opposing the activity of master regulators of ventricular conduction and atrial fate. Myocardial loss of PRDM16 during development resulted in hyperplasia of the (distal) ventricular conduction system. Hence, PRDM16 plays an indispensable role during cardiac development by driving ventricular working cardiomyocyte identity.


Conflict of interest statement

The authors declare that they have no conflict of interest.

Figures

None
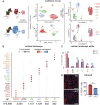
Graphical abstract
Figure S1.
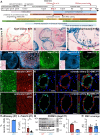
Figure S1.. Prdm16 expression profile and specificity/efficiency of the knockout strategy in the P7 heart.
(A) Timeline of embryonic cardiac development including time points of Sm22α promoter activity, PRDM16 expression, and multiome profiling (in red). A, atrium; V, ventricle; AV, atrioventricular; E, embryonic day; VCS, ventricular conduction system; SMC, smooth muscle cell; P, postnatal day. (B, C, D) PRDM16 expression (in blue) reported by LacZ staining in E9.5 (B) and E10.5 (C, D) mouse embryos. Black and green arrowheads in (D) indicate trabecular and compact cardiomyocytes (CMs), respectively. NFR, nuclear fast red counterstaining. Dashed lines separate atria and ventricles. (E) Cross-section of the heart of an E14.5 embryo (the level shown on a schematic picture of the entire embryo), with the nuclei stained with Hoechst (blue). Middle inset (i) shows the combined staining with ENDOMUCIN (in red; to delineate the trabecular (T)/compact (C) border marked by a dotted white line). The right inset (i′) shows the serial section stained with PRDM16 (in green). Lu, lung. (F) Cross-section of the heart of an E17.5 embryo (the level shown on a schematic picture of the entire embryo), with the nuclei stained with Hoechst (blue). Inset (i) shows staining with PRDM16 (in green). The trabecular (T)/compact (C) border is marked by a dotted white line. Lu, lung. (G) PRDM16/PCM1 fluorescence staining in P7 mouse hearts (ventricles) showing the expression of PRDM16 in ventricular CMs. (H) PRDM16 (in green)/SMC α-actin (αSMA; in red) fluorescence staining in P7 WT mouse hearts showing the expression of PRDM16 in SMCs and endothelial cells in coronary arteries. The dashed white line separates intima and media. Nuclei are stained (blue) with TO-PRO-3. (I) PRDM16 (in green)/PCM1 (in red) fluorescent protein staining in P7 Prdm16-deficient (cKO) mouse hearts (ventricles) showing the loss of PRDM16 in ventricular CMs. (J) PRDM16 (in green)/αSMA (in red) fluorescence staining in P7 Prdm16-deficient (cKO) mouse hearts showing the loss of PRDM16 in SMCs but retained the expression of endothelial cells in coronary arteries. Nuclei are stained (blue) with TO-PRO-3. (K) Diagram showing KO efficiency (expressed as % of recombined cells) in CMs (n = 4). (L) Diagram showing Prdm16 expression determined by RT–qPCR on cDNA from P7 WT or cKO ventricles (n = 7/7). (M) Immunoblot (left) for PRDM16 (top) and loading control β-TUBULIN (bottom) on ventricles of P7 WT (n = 3) and cKO mice (n = 3) and corresponding quantification (right) expressed as arbitrary units (AU, normalized to a loading control). (N) Analysis of the SMC coverage of the coronary arteries in P7 hearts of WT versus cKO mice. The area was corrected for vessel size (n = 12/8). Quantitative data are expressed as the mean ± SEM; *P < 0.05 by a t test. Scale bars: 25 μm (D, H, J), 50 μm (B, G, I), 100 μm (C), 200 μm (E, F). Source data are available for this figure.
Figure S2.
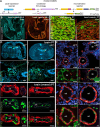
Figure S2.. Mouse models and specificity of the Prdm16 deletion strategy in P7 organs.
(A) Schematic diagrams showing the genetic mouse models used in this study. Model 1 (top), Prdm16 reporter mouse using a β-galactosidase cassette introduced into the Prdm16 locus to recapitulate Prdm16 expression. Model 2 (middle), conditional Prdm16 knockout strategy by inter-crossing an Sm22α-Cre driver line with mice harboring two floxed Prdm16 exon 9 alleles, resulting in Prdm16lox/lox;Sm22α-CreTg/+ or Prdm16lox/lox;Sm22α-Cre+/+ offspring (referred to as Prdm16cKO mice and Prdm16WT littermate controls, respectively). Model 3 (bottom), Sm22α promoter activity reporter strategy by inter-crossing with eGFP reporter mice. β-Geo, β-galactosidase–neomycin phosphotransferase; Chr, chromosome; pr, promoter; KO, knockout; ex, exon; Cre, Cre recombinase; eGFP, enhanced green fluorescent protein; CAG, CMV early enhancer/chicken β-actin; Rosa, reverse orientation splice acceptor. (B, C) eGFP staining showing Sm22α promoter activity in Sm22α reporter mice at E9.5 ((B), left) and P7 ((C), left). Cardiomyocytes are identified by DESMIN fluorescence staining (in red; (B), right and (C), right). Combined staining on Cre-negative littermates is shown in (C), right. (D) Cross-section of the brain of a P7 WT (left column) or conditional Prdm16 knockout (cKO; right column) mouse. The top row shows the overview with nuclei stained with Hoechst (in blue). The insets (i; delineated by a dashed white box) on the bottom row show prominent staining for PRDM16 (in green) in the choroid plexus (Cp). (E) Combined PRDM16 (P16; green) and smooth muscle cell α-actin (αSMA) staining (red), on cross-sections of the brain of a P7 WT (left column) or conditional Prdm16 knockout (cKO; right column) mouse showing an artery (art; intima/media border lined by a white dotted line). The top panels show the separate channels, whereas the bottom row shows the merged pictures. (F) Combined PRDM16 (P16; green) and αSMA staining (red), on cross-sections of the lungs of a P7 WT (left column) or conditional Prdm16 knockout (cKO; right column) mouse. The top row shows an overview, the second row zooms in on the bronchiole (Br), and the two bottom rows zoom in on the artery (art; intima/media border lined by a white dotted line). In some panels, nuclei are stained with Hoechst (in blue). Scale bars: 10 μm ((C, E, F) showing artery), 40 μm ((F) showing overview or bronchi), 50 μm (B), 100 μm ((D), insets), 1,000 μm ((D), overviews).
Figure 1.
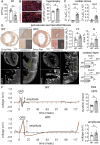
Figure 1.. PRDM16 loss during cardiac development causes early-onset cardiomyopathy.
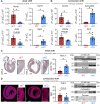
(A) Ejection fraction (EF) of 7-d-old (P7) mouse pups expressed in % (n = 12/12). WT, wild-type; cKO, Prdm16 conditional knockout. (B) Representative pictures of cross-sections stained with LAMININ (red) and TO-PRO-3 (blue) and quantitative analysis of the cardiomyocyte size of P7 hearts expressed in μm2 (n = 7/6). (C) mRNA levels of cardiac stress markers Nppa (n = 8/11) and Nppb (n = 7/12), measured in P7 heart apex. (D) Representative images of Sirius Red–stained cross-sections revealing fibrosis in P7 mouse hearts, insets showing perivascular (PV; brightfield, top) and interstitial (IS; brightfield, bottom left; polarized light, bottom right) fibrosis, and bar graphs showing the quantitative analysis of PV and IS fibrosis. PV fibrotic area was corrected for the smooth muscle cell area of the vessel and expressed in arbitrary units (AU; n = 11/7). (E) Representative images of Natriuretic Peptide Receptor 3–stained transversal sections marking the endocardial lining and quantitative analysis of the compact myocardial wall thickness expressed in μm (right); level 1 represents the base, and level 2 represents the apex of the left ventricle (LV; n = 3/4). The yellow line delineates the trabecular (T)/compact (C) border. RV: right ventricle. (F) Average surface electrocardiogram measured in P7 mice in rest expressed in mV over time (in msec). Bar graphs show quantitative analysis of QRS duration (n = 12/7) and amplitude (n = 9/6). Quantitative data are expressed as the mean ± SEM; *P < 0.05 by a t test. Scale bars: 20 μm (B), 500 μm (D, E).
Figure S3.
Figure S3.. PRDM16 loss during cardiac development results in reduced compact myocardium thickness.
Representative images of ENDOMUCIN-stained transversal sections marking the cardiac vasculature and endocardial lining and quantitative analysis of the compact myocardial wall thickness expressed in μm (right); level 1 represents the base, and level 2 represents the apex of the left ventricle (LV; n = 5). The yellow line delineates the trabecular (T)/compact (C) border. RV: right ventricle. Quantitative data are expressed as the mean ± SEM; *P < 0.05 by a t test. Scale bars: 500 μm.
Figure S4.
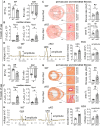
Figure S4.. Prdm16 deletion during cardiac development leads to premature death or progressive cardiomyopathy.
(A) Quantitative analysis of ejection fraction (EF, left) and E/e′ ratio (right) measured by echocardiography in 8-wk-old (8w) mice (n = 9/10), WT, wild-type; cKO, Prdm16 conditional knockout. (B) mRNA levels of cardiac stress markers, Nppa and Nppb, measured in 8w heart apex (n = 7). (C) Representative images of Sirius Red–stained cross-sections revealing fibrosis in P7 mouse hearts, insets showing perivascular (PV, top) and interstitial (IS, bottom) fibrosis, and bar graphs showing the quantitative analysis of PV and IS fibrosis. The PV fibrotic area was corrected for the smooth muscle cell area of the vessel and expressed in arbitrary units (AU; n = 9). (D) Average surface electrocardiogram measured in 8w anesthetized mice expressed in mV over time (in msec). Bar graphs show the quantitative analysis of QRS duration and amplitude (n = 9/10). (E) Quantitative analysis of ejection fraction (EF, left) and E/e′ ratio (right) measured by echocardiography in 16w mice (n = 13/15 for EF; n = 10 for E/e′). (F) mRNA levels of cardiac stress markers, Nppa and Nppb, measured in 16w hearts (n = 8/10). (G) Representative images of Sirius Red–stained cross-sections revealing fibrosis in P7 mouse hearts, insets showing perivascular (PV, top) and interstitial (IS, bottom) fibrosis, and bar graphs showing the quantitative analysis of PV and IS fibrosis. The PV fibrotic area was corrected for the smooth muscle cell area of the vessel and expressed in arbitrary units (AU; n = 9/11 for PV, n = 10/11 for IS). (H) Average surface electrocardiogram measured in 16w anesthetized mice expressed in mV over time (in msec). Bar graphs show the quantitative analysis of QRS duration and amplitude (n = 8/10). Quantitative data are expressed as the mean ± SEM; *P < 0.05 by a t test. Scale bars: 500 μm (C), 1,000 μm (G).
Figure 2.
Figure 2.. PRDM16 loss in CMs during development perturbs the cardiac cellular landscape.
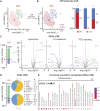
(A) Experimental setup of droplet-based single-nucleus multiome RNA and ATAC sequencing (10x Genomics) experiment on pooled left ventricles (LVs) of 7-d-old (P7) WT (n = 4) or Prdm16 conditional knockout (cKO; n = 4) mouse hearts. Nuclei were isolated and subjected to combined single-nucleus RNA and ATAC sequencing (left). Uniform Manifold Approximation and Projection dimensional reduction panels are shown for each separate modality (middle), as well as after integration (top right) and splitting per genotype (bottom right). (B) Dot plot representing major cell populations (clusters) identified in the heart on the x-axis with their marker genes represented on the y-axis. Color code of different clusters matches that of the integrated Uniform Manifold Approximation and Projection in (A). The size of the dots represents the percentage of cells expressing the marker gene; the dot color indicates average expression levels expressed in log(fold change). The number of nuclei per cluster is indicated below the plot. (C) Bar graph representing the cellular proportions for each cluster in WT versus cKO samples. mCM, mature cardiomyocyte; pCM, proliferating cardiomyocyte; FB, fibroblast; EC, endothelial cell; MC, mural cell; IC, immune cell. To calculate marker genes, a Wilcoxon test was used with log(fold change) threshold = 0, Padjusted < 0.05; to calculate cell proportion differences, Fisher’s exact test was used with FDR < 0.05. (D) Representative images of PCM1-stained cross-sections of WT and cKO P7 hearts (left) and corresponding quantification of cell proportion expressed as % (right; n = 3/4). Quantitative data are expressed as the mean ± SEM; *P < 0.05 by a t test. Scale bars: 20 μm (D).
Figure S5.
Figure S5.. Re-clustering of the main cell clusters identified in P7 hearts.
(A) Weighted nearest neighbor (WNN; integrated) Uniform Manifold Approximation and Projections (top row) representing main re-clustered cell populations identified in P7 mouse hearts with subclusters at high resolution. Dot plots (bottom row) represent marker genes identified by default settings using the Seurat FindAllMarkers function. Bar graphs on the left represent for each main cell type subcluster distribution in WT P7 cells, and bar graphs on the right represent for each main cell type proportions (relative to the total number of cells) of WT (in blue) and PRDM16-deficient (cKO; in red) cardiomyocytes for each subcluster. CM, cardiomyocyte; FB, fibroblast; EC, endothelial cell; MC, mural cell; IC, immune cell. The dot plot color scale represents average expression as log(fold change); dot size represents the percentage of cells expressing marker gene; text-color scheme in Uniform Manifold Approximation and Projections, gene names, and bar graphs represent different subclusters within each population. P_adjusted < 0.05 for significant marker genes. The number of nuclei per subcluster is mentioned under the plot. (B) Violin plots showing Prdm16 expression in different subclusters identified in all main cell populations of WT P7 mouse hearts.
Figure 3.
Figure 3.. PRDM16 loss in CMs triggers changes in gene expression and chromatin accessibility related to hypertrophy, metabolism, conduction, and TGFβ signaling.
(A, B) Uniform Manifold Approximation and Projection (UMAP) representing re-clustered cardiomyocyte (CM) cellular landscape identifying three major cell clusters (A) and the same UMAP split by genotype ((B), left; red: WT CMs; blue: Prdm16-deficient CMs [cKO]). (A, B) Bar graph ((B), right) shows proportions of WT (red) and cKO (blue) CMs represented in subclusters 0, 1, and 2 from panel (A). (C) Bar graph showing the numbers of differentially expressed genes (DEGs) identified in CMs. Green and purple bars represent the number of higher and lower expressed genes, respectively. Volcano plots show higher expressed (green) or lower expressed (purple) DEGs in CMs, representative for hypertrophy (left), fatty acid (FA) metabolism (middle), or TGFβ signaling (right). The absolute number and proportions of DEGs for each term are indicated. (D) Bar graph showing the numbers of differentially accessible regions (DARs) identified in CMs. Green and purple bars represent the number of more and less accessible regions, respectively. Pie charts represent the annotation (expressed in %) of more open (top) or more closed (bottom) DARs in CMs. UTR, untranslated region; TTS, transcription termination site. (E) Functional annotation on DEGs higher expressed in cKO CMs showing the top 25 cardiac-related terms. Terms related to chamber type, conduction, and growth are highlighted in red.
Figure 4.
Figure 4.. PRDM16 loss in CMs causes a shift toward atrial and conduction fates.
(A) Integrated Uniform Manifold Approximation and Projections (UMAPs) showing the enriched expression of ventricular genes (Kcne1, Myh7b; left) in WT cardiomyocytes (CMs) and the enriched expression of atrial genes (Fgf12, Myl4; right) in Prdm16-deficient (cKO) CMs. The color scale represents log(fold change) from low (white) to high (purple). (B) Integrated UMAPs showing the enriched expression of ventricular working CM genes (Kcnd2, Pde3a; left) in WT CMs and the enriched expression of ventricular conduction genes (Cacna2d2, Ryr3; right) in cKO CMs. The color scale represents log(fold change) from low (white) to high (purple). (C) Bar graphs show the expression of atrial (top) or ventricular (bottom) markers (Cao et al, 2023) overlapping with the differentially expressed gene lists and their average Log2FC, revealing the higher expression (green; average Log2FC > 0) of 87.5% of the atrial genes and the lower expression (purple; average Log2FC < 0) of 66.0% of the ventricular genes. The full marker lists are shown in Table S7. (D) Bar graphs show the expression of ventricular conduction (top) or working (bottom) markers (Shekhar et al, 2018) overlapping with the differentially expressed gene lists and their average Log2FC, revealing the higher expression (green; average Log2FC > 0) of 85.3% of the ventricular conduction genes and the lower expression (purple; average Log2FC < 0) of 61.5% of the ventricular working genes. The full marker lists are shown in Table S7. (E) Integrated UMAP of re-clustered CMs subclustered at high resolution highlighting the PF cluster in pink (left). The complete subcluster analysis is shown in Fig S8. The middle top panel (WT) and top right panel (cKO) show the expression of the PF marker CONTACTIN-2 (Cntn2) in CMs. The middle lower panel (WT) and lower right panel (cKO) show the expression of the PF marker Copine5 (Cpne5) in CMs. Insets focus on the Purkinje cluster. The color scale represents log(fold change) from low (white) to high (purple). (F) Representative images of CONTACTIN-2 protein staining identifying the PFs in WT versus cKO P7 mouse hearts. The bar graph shows quantitative analysis of relative CONTACTIN-2 area as a % of the whole ventricles (n = 7/6). Quantitative data are expressed as the mean ± SEM; *P < 0.05 by a t test. Scale bars: 500 μm (F).
Figure S6.
Figure S6.. PRDM16 loss in CMs causes a double shift toward atrial and conduction CM fates.
(A, B) Bar graphs showing the expression of unique atrial markers (A) or unique conduction markers (B) (obtained after filtering out the differentially expressed genes common to atrial [Cao et al, 2023] and conduction [Shekhar et al, 2018] signatures) overlapping with the differentially expressed gene lists, revealing the higher expression (green; average Log2FC > 0) of 84.3% of the unique atrial genes and 81.3% of the unique conduction genes in Prdm16-deficient (cKO) cardiomyocytes (CMs). The full marker lists are shown in Table S7. (C) Bar graphs showing the closest genes associated with differentially accessible regions (DARs), identified as atrial-specific genes (top) or ventricular-specific genes (bottom) in cKO CMs. Percentages represent the proportion of associated genes with more open DARs (green) among those previously identified (Cao et al, 2023) as atrial CM markers or the proportion of associated genes with more closed DARs (purple) among those previously identified (Cao et al, 2023) as ventricular cardiomyocyte markers. The full marker lists are shown in Table S8. (D) Bar graphs showing the closest genes associated with DARs, identified as ventricular conduction-specific genes (top) or ventricular working-specific genes (bottom). Percentages represent the proportion of associated genes with more open DARs (green) among those previously identified (Shekhar et al, 2018) as ventricular conduction CM markers or the proportion of associated genes with more closed DARs (purple) among those previously identified (Shekhar et al, 2018) as ventricular working CM markers. The full marker lists are shown in Table S8. Expression in (A, B, C, D) is represented as average log(fold change) in cKO versus WT, P_adjusted < 0.05.
Figure S7.
Figure S7.. Validation of double shift toward atrial and conduction CM fates upon PRDM16 loss in CMs.
(A, B) Diagrams showing the expression of atrial/ventricular (A) or conduction/working (B) cardiomyocyte (CM) genes on cDNA of P7 ventricles of P7 WT or Prdm16-deficient (cKO) mice (n = 3–7). (C) Left: representative images of MYL4 protein staining in WT versus cKO P7 mouse hearts. The bar graph shows quantitative analysis of the percentage of MYL4-stained area in the whole ventricles (n = 5/5). Right: immunoblot for FGF12 (middle) and loading control β-TUBULIN (top) on ventricles of P7 WT (n = 3) and cKO mice (n = 2). Ponceau staining is shown in the bottom. (D) Left: representative images of FHL2 protein staining (in red) in WT versus cKO P7 mouse hearts. The bar graph shows quantitative analysis of mean fluorescence intensity in the whole ventricles (n = 5/5). Right: immunoblot for CACNA2D2 (middle) and loading control β-TUBULIN (top) on ventricles of P7 WT (n = 3) and cKO mice (n = 2). Ponceau staining is shown in the bottom. Quantitative data are expressed as the mean ± SEM; *P < 0.05 by a t test or #P < 0.05 by a Mann–Whitney test; Pde3a: P = 0.06 by a Mann–Whitney test; FHL2: P = 0.2 by a t test. Scale bars: 500 μm (C, D). Source data are available for this figure.
Figure S8.
Figure S8.. Higher resolution clustering reveals a Purkinje fiber cluster that is expanded upon PRDM16 loss during cardiac development.
(A) Uniform Manifold Approximation and Projection (left) showing higher resolution subclustering of the cardiomyocyte (CM) population identifying 8 different subclusters, including a Purkinje fiber (PF) cluster indicated by a dashed line box. The bar graph (right) shows for each subcluster the proportion (as the percentage versus total number of cells) of WT versus Prdm16-deficient (cKO) CMs. EC, endothelial cell. (B) Pie charts showing for each subcluster the proportion (compared with the total number of cells) of WT (left) and cKO CMs (right). (C) Uniform Manifold Approximation and Projections showing the expression of PF markers Hcn4 and Nfasc in the complete CM population (left), in WT CMs alone (middle) and in cKO CMs alone (right). The color scale represents log(fold change) from low (white) to high (purple).
Figure S9.
Figure S9.. PRDM16 loss in CMs facilitates the activity of master regulators of atrial and conduction fates.
(A) Enhanced motif analysis by chromVAR and HOMER, identifying enriched motifs in all more open (logFC > 0) differential accessible regions of Prdm16-deficient CMs versus WT. The bar graph represents HOMER-identified enhanced motifs ranked according to P-value. (B, C) Network graph showing results of FigR gene regulatory network analysis of atrial-specific (B) or conduction-specific (C) master activator transcription factors (TFs) versus PRDM16. Orange circles represent TFs, gray circles represent target genes, the green string represents the node with a positive regulation score between TF and target gene, and the purple string represents the node with a negative regulation score between TF and target gene. The bar graph represents the number of target genes in the network, split by being uniquely regulated by master regulators (MR, “yes”) or by PRDM16 (“no”). Genes uniquely regulated by PRDM16 are shown in a box.
Figure 5.
Figure 5.. PRDM16 suppresses the activity of master regulators of atrial and conduction fates.
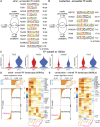
(A) Scheme showing 100 atrial-specific more open (logFC > 0) differentially accessible regions (DARs) in Prdm16-deficient (cKO) versus WT cardiomyocytes (CMs) that were scanned for transcription factor (TF) motifs revealing 130 and 39 motifs, using chromVAR and HOMER, respectively, of which 13 overlapped. Overlapping TF motifs are listed on the right along with the percentage of DARs containing the motif sequence. (B) Scheme showing 69 ventricular conduction-specific more open (logFC > 0) DARs in cKO versus WT CMs that were scanned for TF motifs revealing 94 and 27 motifs, using chromVAR and HOMER, respectively, of which seven overlapped. Overlapping TF motifs are listed on the right along with the percentage of DARs containing the motif sequence. (C) Violin plots of enriched TFs differentially expressed in cKO versus WT CMs. Gene regulatory network (GRN) analysis using FigR identifying domains of regulatory chromatin (DORCs) and associated genes. (D, E) To obtain atrial-specific (D) or conduction-specific (E) GRNs, genes were filtered using established atrial (Cao et al, 2023) or conduction (Shekhar et al, 2018) gene signatures and for being differentially expressed. Bar graphs represent the mean regulation score (y-axis, log10-transformed per TF across all DORCs). The upper section of the bar graphs zooms in on the top 10 “master activator” TFs (positive mean regulation score) of the GRN. Heatmaps represent TF-DORC associations colored according to their regulation score (blue = negative or repressor; red = positive or activator), with DORCs representing the associated atrial or conduction differentially expressed genes (y-axis). TFs (x-axis) represent the top five master activators alongside PRDM16. The purple line indicates the repressing regulation by PRDM16 compared with the other TFs. The raw data for motif and heatmap analysis are included in Table S9. The color scale represents the regulation score per TF-DORC association.
Figure 6.
Figure 6.. PRDM16 orchestrates CM fate decision by acting on promoters and distant enhancers.
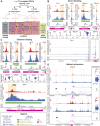
(A) Decision tree identifying PRDM16 targets in differentially accessible regions associated with 67 atrial- and/or conduction-specific coding differentially expressed genes (DEGs) and located inside or outside the promoter region. A combination of HOMER-PRDM16 binding motif analysis, publicly available PRDM16 ChIPseq (E13.5 cardiomyocytes), and ENCODE datasets (P0 hearts) was applied to determine whether PRDM16 directly or indirectly binds their promoter (green and gray boxes, respectively) or potentially interacts with their enhancer regions (pink boxes; genes in bold-face font are those associated with distant enhancers). ChIP, chromatin immunoprecipitation. The color code of enhancer regions corresponds to the one used by ENCODE: H3K27Ac: histone-3-lysine-27 acetylated (yellow), H3K4me3: histone-3-lysine-4 trimethylated (red), and CTCF-bound: CCCTC-binding factor (blue). ATAC peaks of the promoter region of WT (red) and Prdm16-deficient (cKO, blue) cardiomyocytes for genes from the green box in (A), representing cases of ChIPseq-validated direct PRDM16 binding to the promoter region. ATAC peaks of the promoter region of WT (red) and cKO (blue) cardiomyocytes for genes from the gray box in (A), representing cases of ChIPseq-validated indirect PRDM16 binding to the promoter region. (D) Peak-to-gene link plots identifying distant enhancer regions in WT (red) versus cKO (blue) cardiomyocytes in Slc6a6 and Tbx5. Purple strings indicate the peak-to-gene link; the color scale represents correlation significance (from 0 to 1). Arrowheads represent enhancers identified by the ENCODE database. Transcriptional start site is marked in (B, C, D) by fuchsia arrow and white line +/− 2-kb region indicated by fuchsia line. Differentially accessible regions are highlighted in (B, C, D) by light-orange shades. Brown lines (top) in (B, C, D) represent ChIPseq-validated (in E9.5 or E12.5 cardiomyocytes) (Steimle et al, 2018; Akerberg et al, 2019) TBX5 binding site regions. Green lines (bottom) in (B, C) represent PRDM16 target peaks validated by ChIPseq in E13.5 CMs (Wu et al, 2022). Dark-orange lines (top) in (B) represent HOMER-predicted PRDM16 binding sites. The differential expression of the genes is shown as violin plots. expr, expression; chr, chromosome; pks, peaks.
Figure S10.
Figure S10.. PRDM16 loss in CMs results in a mild compact-to-trabecular shift.
(A) Top: Uniform Manifold Approximation and Projections (left) of the cardiomyocyte (CM) population split by genotype showing Thbs4 expression and corresponding validation by RT–qPCR (n = 4/7). Bottom: violin plots comparing the expression of trabecular markers Thbs4, Ank1, Fbxo32, and Etkn1, revealing the majority of them unchanged by PRDM16 loss. (B) Top: Uniform Manifold Approximation and Projections (left) of the CM population split by genotype showing Hey2 expression and corresponding validation by RT–qPCR (n = 4/6). Bottom: violin plots comparing the expression of compact markers Hey2, Bicc1, Drg1, and Lpar3, revealing the majority of them unchanged by PRDM16 loss. Quantitative data are expressed as the mean ± SEM; *P < 0.05 by a t test; Thbs4: P = 0.06 by a t test.

Similar articles

Cited by

  • PRDM16, a new kid on the block in cardiovascular health and disease.
    Van Wauwe J, Kemps H, Vrancaert P, Mahy A, Schellingen R, Grootaert MOJ, Beerens M, Luttun A. Van Wauwe J, et al. Cardiovasc Res. 2025 Jul 31;121(8):1156-1172. doi: 10.1093/cvr/cvaf089. Cardiovasc Res. 2025. PMID: 40439125 Free PMC article. Review.
  • PRDM16 controls smooth muscle cell fate in atherosclerosis.
    Tan JME, Cheng L, Calhoun RP, Weller AH, Drareni K, Fong S, Barbara E, Lim HW, Xue C, Winter H, Auguste G, Miller CL, Reilly MP, Maegdefessel L, Lutgens E, Seale P. Tan JME, et al. bioRxiv [Preprint]. 2025 Feb 23:2025.02.19.639186. doi: 10.1101/2025.02.19.639186. bioRxiv. 2025. PMID: 40027729 Free PMC article. Preprint.

References

    1. Akerberg BN, Gu F, VanDusen NJ, Zhang X, Dong R, Li K, Zhang B, Zhou B, Sethi I, Ma Q, et al. (2019) A reference map of murine cardiac transcription factor chromatin occupancy identifies dynamic and conserved enhancers. Nat Commun 10: 4907. 10.1038/s41467-019-12812-3 - DOI - PMC - PubMed
    1. Amoni M, Vermoortele D, Ekhteraei-Tousi S, Donate Puertas R, Gilbert G, Youness M, Thienpont B, Willems R, Roderick HL, Claus P, et al. (2023) Heterogeneity of repolarization and cell-cell variability of cardiomyocyte remodeling within the myocardial infarction border zone contribute to arrhythmia susceptibility. Circ Arrhythm Electrophysiol 16: e011677. 10.1161/CIRCEP.122.011677 - DOI - PMC - PubMed
    1. Aranguren XL, Agirre X, Beerens M, Coppiello G, Uriz M, Vandersmissen I, Benkheil M, Panadero J, Aguado N, Pascual-Montano A, et al. (2013) Unraveling a novel transcription factor code determining the human arterial-specific endothelial cell signature. Blood 122: 3982–3992. 10.1182/blood-2013-02-483255 - DOI - PubMed
    1. Arndt AK, Schafer S, Drenckhahn JD, Sabeh MK, Plovie ER, Caliebe A, Klopocki E, Musso G, Werdich AA, Kalwa H, et al. (2013) Fine mapping of the 1p36 deletion syndrome identifies mutation of prdm16 as a cause of cardiomyopathy. Am J Hum Genet 93: 67–77. 10.1016/j.ajhg.2013.05.015 - DOI - PMC - PubMed
    1. Asp M, Giacomello S, Larsson L, Wu C, Furth D, Qian X, Wardell E, Custodio J, Reimegard J, Salmen F, et al. (2019) A spatiotemporal organ-wide gene expression and cell atlas of the developing human heart. Cell 179: 1647–1660.e19. 10.1016/j.cell.2019.11.025 - DOI - PubMed