. 2024 Sep 20;14(1):21959.
doi: 10.1038/s41598-024-73051-1.

A covalent creatine kinase inhibitor ablates glioblastoma migration and sensitizes tumors to oxidative stress

Affiliations

A covalent creatine kinase inhibitor ablates glioblastoma migration and sensitizes tumors to oxidative stress

Joshua L Katz et al. Sci Rep. .

Abstract

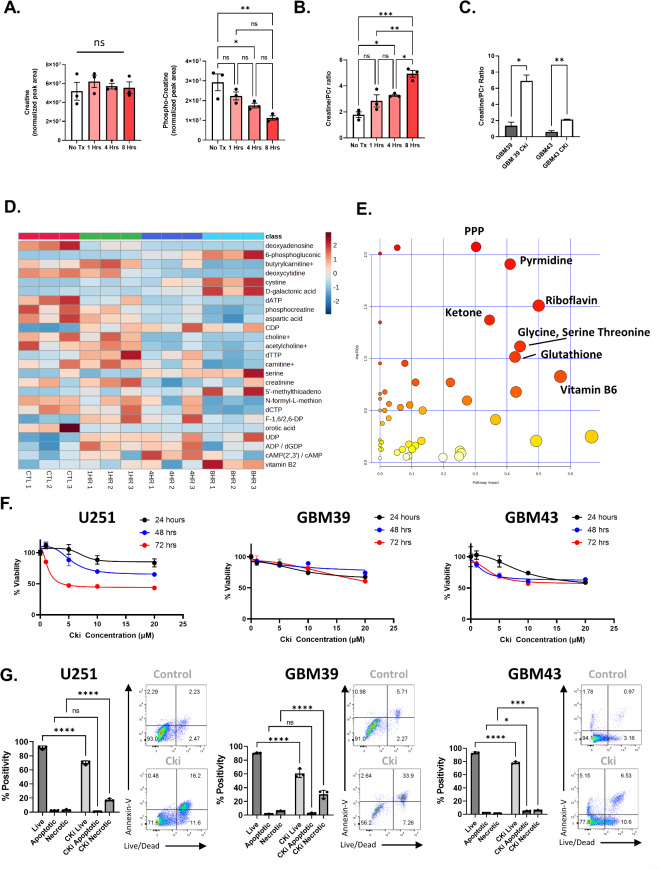
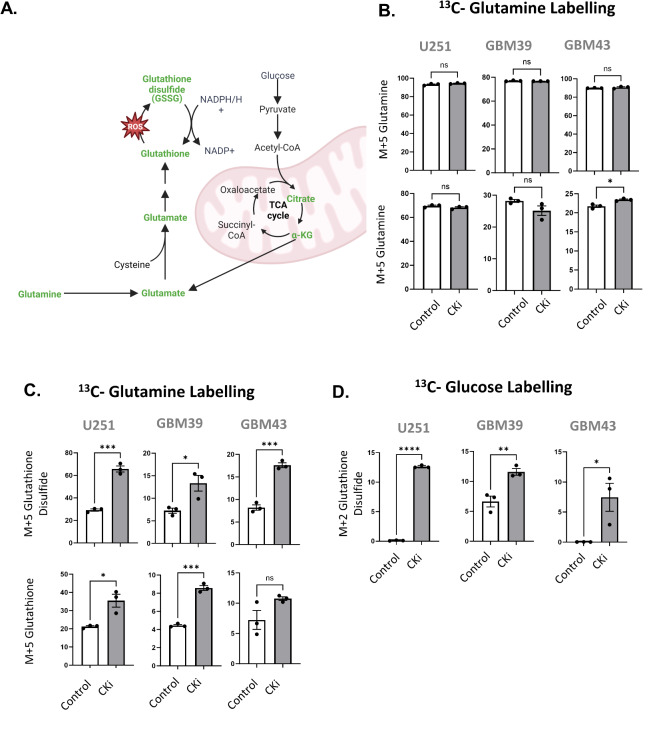
Glioblastoma is a Grade 4 primary brain tumor defined by therapy resistance, diffuse infiltration, and near-uniform lethality. The underlying mechanisms are unknown, and no treatment has been curative. Using a recently developed creatine kinase inhibitor (CKi), we explored the role of this inhibitor on GBM biology in vitro. While CKi minimally impacted GBM cell proliferation and viability, it significantly affected migration. In established GBM cell lines and patient-derived xenografts, CKi ablated both the migration and invasion of GBM cells. CKi also hindered radiation-induced migration. RNA-seq revealed a decrease in invasion-related genes, with an unexpected increase in glutathione metabolism and ferroptosis protection genes post-CKi treatment. The effects of CKi could be reversed by the addition of cell-permeable glutathione. Carbon-13 metabolite tracing indicated heightened glutathione biosynthesis post-CKi treatment. Combinatorial CKi blockade and glutathione inhibition or ferroptosis activation abrogated cell survival. Our data demonstrated that CKi perturbs promigratory and anti-ferroptotic roles in GBM, identifying the creatine kinase axis as a druggable target for GBM treatment.

Keywords: Brain tumor; Cell migration; Enzyme inhibitor; Oxidative stress; Tumor metabolism.


Conflict of interest statement

The authors declare no competing interests.

Figures

Fig. 1
Fig. 1
CKi prevents PCr accumulation and causes several changes in the metabolome. (A) Levels of creatine and phosphocreatine in U251 cells at different time points following CKi treatment. (B) Ratio of creatine to phosphocreatine after CKi inhibition in the U251 cell line. (C), Ratio of creatine to phosphocreatine after CKi inhibition in GBM39, 43. (C) Heatmap showing changes in peripheral versus tumoral myeloid cells, organized according to one-way ANOVA (top 25 shown). (D) Metabolic pathway enrichment analysis comparing vehicle control and CKi-treated cells. (E-F) Basal oxygen consumption rate (OCR) and extracellular acidification rate (ECAR) of U251 cells incubated with CKi for the indicated times. (G) Cell Titer Glo luminescence assay results for several cell lines and patient-derived xenografts (PDXs) treated with 20 µM CKi for 24 h under hypoxia. For (A,B), n = 3 per group; data are representative of 2 independent experiments. For (C), data is n = 2 compiled from 2 independent experiments. For (D,E), n = 3–4 per group. For (G), n = 4–6 per group; data are representative of at least 2 independent experiments. Statistical analysis for (A,B) was performed using one-way ANOVA, followed by Tukey’s post hoc test. For (B,G), significance was calculated using a paired Student’s t-test. *p < 0.05; **p < 0.01; ***p < 0.001.
Fig. 2
Fig. 2
CKi abrogates the migration of GBM cells in vitro. (A,B) U251 cells were plated overnight in Ibidi chambers (5 × 104 cells per well). After removing the barrier, wells were imaged every 12 h with increasing concentrations of CKi. (C–F) The same migration assay was performed with 20 µM CKi with GBM PDX GBM39 (C,D) and GBM43 (E,F), and chambers were imaged at 12- and 24-hours post-treatment. For all experiments in this figure, n = 3–4 images were obtained from three individual chamber assays, data is representative of 2–3 independent experiment per cell line. Statistics in (B) were calculated via one-way ANOVA, followed by Tukey’s post hoc test to assess individual significance. In (G), significance in (D) and (F) was calculated via paired Student’s t-test. *p < 0.05; **p < 0.01; ***p < 0.001.
Fig. 3
Fig. 3
CKi inhibits GBM invasion in vitro. In (A–C), U251, GBM39 and GBM43 cells were plated in Matrigel-coated invasion chambers (+/- 20 µM CKi) for 18 h under 1% O2 hypoxia. Some cells were subjected to 4 Gy X-ray radiation 48 h prior to being plated into invasion chambers. Following a 24-hour incubation, the cells were fixed overnight using 4% formaldehyde and stained the following morning with 0.1% crystal violet stain. For all the experiments in this figure, the number of invaded cells was quantified from the images (n = 5 images per experimental group) representative of two independent experiments. Significance was calculated via paired Student’s t test. *p < 0.05; **p < 0.01; ***p < 0.001.
Fig. 4
Fig. 4
CKi treatment induces transcriptional upregulation of genes involved in glutathione/ferroptosis regulation. U251 cells were treated with vehicle (1% DMSO or 20 µM CKi), and after 8 h under hypoxia (1% O2), RNA was isolated and sent to Novogene for bulk RNA sequencing. (A), Number of genes dysregulated by CKi treatment; (B), Volcano plot of genes differentially expressed in response to CKi treatment. (C,D) Gene-set enrichment analysis (GSEA) of genes associated with ferroptosis and glutathione, respectively. In (E), FKPM expression was upregulated in 8 genes involved in redox stress and glutathione/ferroptosis regulation. In (F), U251 GBM39 and GBM43 were cultured with CKi for 8 h, and qPCR was performed on all the indicated genes. The results are from n = 3 independent experiments. (E,F) Significance was calculated via paired Student’s t test. *=p < 0.05; **p < 0.01; ***p < 0.001.
Fig. 5
Fig. 5
CKi treatment rewires cells to produce GSH de novo. In (A), a schematic showing inputs for glutathione biosynthesis from glutamine and from glucose (green is what was observed in the data). In (B-C), U251, GBM43, and GBM39 cells were cultured +/- 20 µM CKi in the presence of uniformly labeled13C-glutamine (2 mM) for 4 h before the metabolites were isolated, and LC‒MS/MS was used to determine the enrichment of each metabolite in glutathione biosynthesis. In (D), the same assay was performed with glucose-free DMEM supplemented with 10 mM uniformly labeled 13C-glucose. The percentage enrichment for the most common isotopomers is shown in the figure. n = 3 per group for each experiment, the data are representative of two independent experiments. Significance was calculated via paired Student’s t test. *=p < 0.05; **p < 0.01; ***p < 0.001.
Fig. 6
Fig. 6
The addition of glutathione rescues the inhibitory effects of CKi on migration. In (A–D), GBM43, GBM39, or U251 cells were plated overnight into Ibidi (company) chambers (50,000 cells per well), and the following day, the barrier was removed, and the wells were imaged every 24 h under 20 µM CKi and 20 µM Cki + GSHee. For all the experiments in this figure, n = 3–4 images were obtained from three individual chamber assays, representative of three independent experiments. Statistics in (B–D) were calculated via one-way ANOVA, followed by Tukey’s post hoc test to assess individual significance. *p < 0.05; **p < 0.01; ***p < 0.001.
Fig. 7
Fig. 7
Glutathione inhibition or ferroptosis activation cooperate with CKi to promote cell death in GBM. In (A–C), U251, GBM43, and GBM39 cells were cultured with increasing concentrations of the glutathione inhibitor BSO alone or with increasing concentrations of CKi +/- 20 µM. After 24 hours, Cell-Titer Glo© was used to examine cellular viability. In (D–F), U251, GBM43, and GBM39 cells were cultured with increasing concentrations of the ferroptosis activator RSL3 alone or with increasing concentrations of CKi (approximately +/- 20 µM). After 24 hours, cell-titer glass was used to examine cellular viability. After the data were obtained, a nonlinear regression was performed using [Inhibitor] vs. response (three parameters) with least squares fit. This was subsequently used to determine the IC50 of either the single agent BSO/RSL3 or BSO/RSL3 in the presence of CKi. “To test for significance in curves, a two-way ANOVA was performed, and Sidak’s multiple comparison post hoc test was used to test for individual significance. *p < 0.05; **p < 0.01; ***p < 0.001.

References

    1. Wyss, M. & Kaddurah-Daouk, R. Creatine and creatinine metabolism. Physiol. Rev.80, 1107–1213. 10.1152/physrev.2000.80.3.1107 (2000). - PubMed
    1. Ohtsuki, S. et al. The blood-brain barrier creatine transporter is a major pathway for supplying creatine to the brain. J. Cereb. Blood Flow. Metab.22, 1327–1335. 10.1097/01.WCB.0000033966.83623.7D (2002). - PubMed
    1. Kazak, L. & Cohen, P. Creatine metabolism: energy homeostasis, immunity and cancer biology. Nat. Rev. Endocrinol.16, 421–436. 10.1038/s41574-020-0365-5 (2020). - PubMed
    1. Beal, M. F. Neuroprotective effects of creatine. Amino Acids40, 1305–1313. 10.1007/s00726-011-0851-0 (2011). - PubMed
    1. Salomons, G. S. et al. X-linked creatine-transporter gene (SLC6A8) defect: a new creatine-deficiency syndrome. Am. J. Hum. Genet.68, 1497–1500. 10.1086/320595 (2001). - PMC - PubMed

MeSH terms

LinkOut - more resources