. 2024 Sep 20;7(1):1152.
doi: 10.1038/s42003-024-06843-w.

Interlimb coordination is not strictly controlled during walking

Affiliations

Interlimb coordination is not strictly controlled during walking

Takahiro Arai et al. Commun Biol. .

Abstract

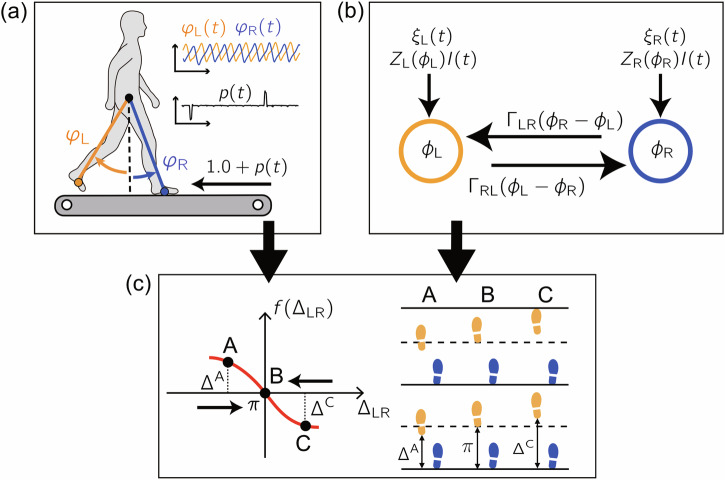
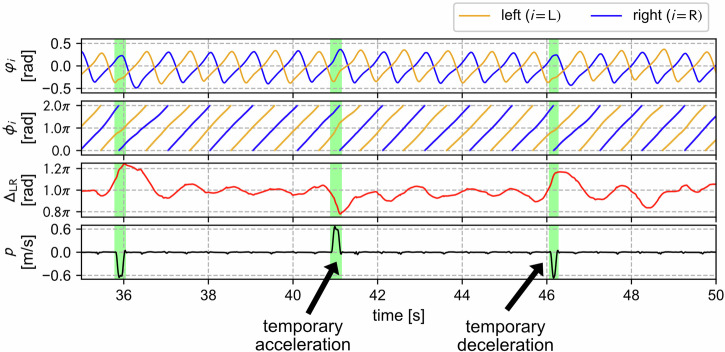
In human walking, the left and right legs move alternately, half a stride out of phase with each other. Although various parameters, such as stride frequency and length, vary with walking speed, the antiphase relationship remains unchanged. In contrast, during walking in left-right asymmetric situations, the relative phase shifts from the antiphase condition to compensate for the asymmetry. Interlimb coordination is important for adaptive walking and we expect that interlimb coordination is strictly controlled during walking. However, the control mechanism remains unclear. In the present study, we derived a quantity that models the control of interlimb coordination during walking using two coupled oscillators based on the phase reduction theory and Bayesian inference method. The results were not what we expected. Specifically, we found that the relative phase is not actively controlled until the deviation from the antiphase condition exceeds a certain threshold. In other words, the control of interlimb coordination has a dead zone like that in the case of the steering wheel of an automobile. It is conjectured that such forgoing of control enhances energy efficiency and maneuverability. Our discovery of the dead zone in the control of interlimb coordination provides useful insight for understanding gait control in humans.


Conflict of interest statement

The authors declare no competing interests.

Figures

Fig. 1
Fig. 1. Schematic diagram of the study.
a Measurement of the leg motion, represented by φi(t) (i ∈ (L, R)), during walking on a treadmill with a perturbation in the belt speed, represented by p(t). b Two coupled limit-cycle oscillators with phases ϕi(t) (i ∈ (L, R)) whose dynamics are described by phase equations with phase coupling functions Γij(ϕj − ϕi), phase sensitivity functions Zi(ϕi), external perturbation I(t), and Gaussian noise ξi ((ij) = (L, R), (R, L)). c Integration of the measured data and phase equations to derive the dynamics of the relative phase ΔLR, which reflects the control of interlimb coordination. When ΔLR = π, corresponding to B, the legs move in an exactly alternating manner. As ΔLR moves away from π, the deviation from this antiphase relationship increases (see A and C, with ΔLR = ΔA and ΔC). If the interlimb coordination is strictly controlled to maintain the antiphase relationship, the function f(ΔLR), which describes the control of interlimb coordination, should intersect the horizontal axis at π with a steep negative slope.
Fig. 2
Fig. 2. Measured and reconstructed time series for one representative subject (Subject G) under mixed conditions.
The leg motion, represented by φi(t) (i ∈ (L, R)), measured during walking was transformed to the oscillator phases ϕi(t) (i ∈ (L, R)), from which we obtain the relative phase ΔLR. The disturbance of the treadmill belt speed from 1.0 m/s is represented as p(t). The green regions indicate the times at which temporary acceleration or deceleration is applied to the treadmill belt speed.
Fig. 3
Fig. 3. Results for the control of interlimb coordination for one representative subject (Subject G).
a Phase sensitivity functions Zi(ϕi) (i ∈ (L, R)) for acceleration (Acc), deceleration (Dec), and mixed (Mix) conditions. b Control of interlimb coordination, represented by f(ΔLR). The vertical dotted lines indicate 3 standard deviations from the mean of the observed ΔLR. In the region outside the vertical dotted line, the estimated function f(ΔLR) is displayed in pale color. The function f(ΔLR) is shifted in order to place the mean of the observed values of ΔLR at π to improve visualization. The histogram displays the noise intensity, σLR. (An expanded histogram, with values 30 times larger than the actual values, is also given.) The mean and standard deviation of the derived noise intensity for all results are 0.0106π and 0.0021π, respectively. These values are too small to cause deviation of ΔLR from the flat region of f(ΔLR). c A schematic diagram for the interpretation of f(ΔLR). The flat region near ΔLR = π at B (neutral stability) and the steep negative slope in the regions away from π reflect the fact that the relative phase between the legs is not actively controlled until the deviation from π exceeds a threshold (ΔA − π at A and ΔC − π at C), where motion of the legs deviates significantly from the antiphase relationship.
Fig. 4
Fig. 4. Characteristics of the control of interlimb coordination, represented by f(ΔLR).
a Approximation of f(ΔLR) by a piecewise linear function within 3 standard deviations (3SD) (vertical dotted lines) from the mean of the observed ΔLR. The quantity lC is the length of the flat region in which we have f(ΔLR) = 0, and gL and gR are the slopes in the left and right outside regions, respectively. The three parameters lC, gL, and gR were determined by the left and right endpoints of the flat region (white circles) such that the discrepancy between the original and approximated functions is minimized within the region between the two vertical dotted lines under the condition that the approximated function and the original function coincide at the left and right endpoints of the approximated function (black circles). b Result for the approximation of f(ΔLR) in Fig. 3b under acceleration (Acc), deceleration (Dec), and mixed (Mix) conditions. c Mean and standard deviation of lC among the subjects, where “All” indicates the statistical result from all perturbation conditions. The dots along the bars represent data points (n = 8 for Acc and Dec, n = 6 for Mix, and n = 22 for “All”). d Mean and standard deviation of gL and gR among the subjects.

References

    1. Alexander, R.McN. Principles of animal locomotion. Princeton University Press: Princeton, NJ (2003).
    1. Haddad, J. M., van Emmerik, R. E. A., Whittlesey, S. N. & Hamill, J. Adaptations in interlimb and intralimb coordination to asymmetrical loading in human walking. Gait Posture23, 429–434 (2006). - PubMed
    1. Courtine, G. & Schieppati, M. Human walking along a curved path. II. Gait features and EMG patterns. Eur. J. Neurosci.18, 191–205 (2003). - PubMed
    1. Reisman, D. S., Block, H. J. & Bastian, A. J. Interlimb coordination during locomotion: What can be adapted and stored? J. Neurophysiol.94, 2403–2415 (2005). - PubMed
    1. Plotnik, M., Giladi, N. & Hausdorff, J. M. A new measure for quantifying the bilateral coordination of human gait: Effects of aging and Parkinson’s disease. Exp. Brain. Res.181, 561–570 (2007). - PubMed

Publication types