. 2024 Dec;16(12):3218-3246.
doi: 10.1038/s44321-024-00144-9. Epub 2024 Sep 20.

Neural precursor cells rescue symptoms of Rett syndrome by activation of the Interferon γ pathway

Affiliations

Neural precursor cells rescue symptoms of Rett syndrome by activation of the Interferon γ pathway

Angelisa Frasca et al. EMBO Mol Med. 2024 Dec.

Abstract

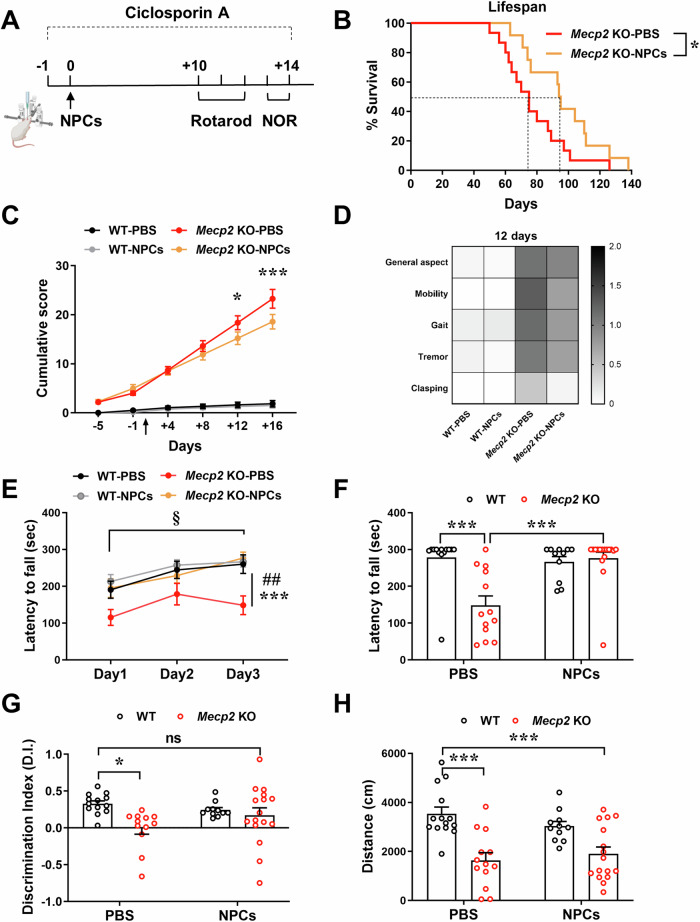
The beneficial effects of Neural Precursor Cell (NPC) transplantation in several neurological disorders are well established and they are generally mediated by the secretion of immunomodulatory and neurotrophic molecules. We therefore investigated whether Rett syndrome (RTT), that represents the first cause of severe intellectual disability in girls, might benefit from NPC-based therapy. Using in vitro co-cultures, we demonstrate that, by sensing the pathological context, NPC-secreted factors induce the recovery of morphological and synaptic defects typical of Mecp2 deficient neurons. In vivo, we prove that intracerebral transplantation of NPCs in RTT mice significantly ameliorates neurological functions. To uncover the molecular mechanisms underpinning the mediated benefic effects, we analyzed the transcriptional profile of the cerebellum of transplanted animals, disclosing the possible involvement of the Interferon γ (IFNγ) pathway. Accordingly, we report the capacity of IFNγ to rescue synaptic defects, as well as motor and cognitive alterations in Mecp2 deficient models, thereby suggesting this molecular pathway as a potential therapeutic target for RTT.

Keywords: Cytokine; Mecp2; Neurodevelopmental Disease; Stem Cells; Synapses.


Conflict of interest statement

Disclosure and competing interests statement. The authors declare no competing interests.

Figures

Figure 1
Figure 1. NPC treatment rescues dendritic branching and synaptic defects in Mecp2 deficient neurons.
(A) The cartoon depicts the experimental setting, in which NPCs or NIH3T3 were seeded on transwell inserts, which were transferred on WT or KO neurons at DIV0 until the end of the experiment (DIV7 for (BD); DIV14 for (EK)). (B, C) The graphs show the number of intersections calculated by Sholl analysis in WT and KO neurons (B), and in KO neurons cultured alone or with NIH3T3 or NPCs (C). In (B), *p = 0.0030 at 40 μm; p = 0.033 at 50 μm; p = 0.0348 at 60 μm; p = 0.0317 at 90 μm. In (C), *p = 0.0018 at 50 μm; p < 0.0001 at 60 μm; p = 0.0003 at 70 μm; p < 0.0001 at 80 μm; p < 0.0001 at 90 μm; p = 0.0007 at 100 μm; p = 0.0049 at 110 μm; p = 0.0021 at 120 μm; p < 0.0001 at 130 μm; p < 0.0001 at 140 μm; p = 0.0007 at 150 μm; p = 0.0071 at 160 μm; p = 0.0082 at 170 μm; p = 0.0385 at 200 μm; p = 0.0224 at 210 μm; p = 0.0379 at 220 μm. (D) The histogram indicates the total dendritic length calculated by NeuronJ in WT and KO neurons cultured alone (CTRL) or with NIH3T3 or NPCs. Data are reported as mean ± SEM. *p = 0.0259 WT vs KO; **p = 0.0018 KO vs KO+NPCs by two-way ANOVA, followed by Tukey post-hoc test. In (C) and (D), n = 33 WT, n = 17 WT + NIH3T3; n = 39 WT + NPC; n = 39 KO; n = 26 KO + NIH3T3; n = 32 KO+NPCs. Neurons derived from at least 3 different mice/genotype. (E) Representative images of the immunostaining for Synapsin1/2 (Syn1/2; green), Shank2 (red) and their merge with Map2 of WT and KO neurons (DIV14) cultured alone or co-cultured with NIH3T3 or NPCs. Scale bar = 5 µm. (FH) Histograms indicate the mean ± SEM of number of Synapsin1/2 and Shank2 puncta in 20 µm (F, G) and of colocalized puncta (H) of WT and KO neurons cultured alone (CTRL) or co-cultured with NPCs or NIH3T3. Data were analyzed by two-way ANOVA followed by Tukey post-hoc test. In (F), ***p < 0.0001 WT vs KO; p < 0.0001 KO vs KO+NPCs; p < 0.0001 KO + NIH3T3 vs KO+NPCs. In (G), ***p = 0.0003 WT vs KO; p < 0.0001 KO vs KO+NPCs; p < 0.0001 KO + NIH3T3 vs KO+NPCs. In (H), ***p = 0.0055 WT vs KO; p < 0.0001 KO vs KO+NPCs; p < 0.0001 KO + NIH3T3 vs KO+NPCs. n = 78 WT, n = 58 WT + NIH3T3, n = 41 WT+NPCs, n = 68 KO, n = 59 KO + NIH3T3, n = 49 KO+NPCs. (I) The histogram represents the mean ± SEM of the protein levels of the mature form of BDNF in WT and KO neurons cultured alone or co-cultured with NPCs (from DIV0 to DIV14) and expressed as percentage of WT neurons. *p = 0.0368 WT vs KO; *p = 0.0093 KO vs KO+NPCs; ***p < 0.0001 WT vs WT+NPCs by two-way ANOVA followed by Sidak post-hoc test. n = 15 WT, n = 10 WT+NPCs, n = 14 KO, n = 13 KO+NPCs. Representative bands of BDNF and the corresponding lanes of TGX-stain free gel are reported. (J) Representative images of the immunostaining for Synapsin1/2 (Syn1/2; green) and Map2 (red) of WT and Het neurons (DIV14) cultured alone or co-cultured with NPCs. Scale bar = 5 µm. (K) The histogram indicates the mean ± SEM of Synapsin1/2 puncta density of WT and Het neurons cultured alone (CTRL) or co-cultured with NPCs. *p = 0.0408 WT vs Het+NPCs; ***p < 0.001 WT vs Het; ***p < 0.001 Het vs Het+NPCs by two-way ANOVA followed by Tukey post-hoc test; n = 68 WT, n = 34 WT+NPCs, n = 109 Het, n = 83 Het+NPCs. Neurons derived from at least 6 mice/genotype and 3 independent experiments were analyzed. Source data are available online for this figure.
Figure 2
Figure 2. Beneficial effects of NPCs do not require Mecp2.
(A) The cartoon depicts the experimental setting of the co-cultures. (B) Representative images of the immunostaining for Synapsin1/2 (Syn1/2; green), Shank2 (red) and the merge with Map2 (white) of neurons (at DIV14). Scale bar = 5 µm. (CE) The graphs show the mean ± SEM of number of Synapsin1/2 and Shank2 puncta in 20 µm (C, D) and of colocalized puncta (E) of WT and KO neurons cultured alone (UT) or co-cultured with WT NPCs or Mecp2 KO NPCs. In (C) and (D): ***p < 0.0001 WT vs KO by unpaired t test; ***p < 0.0001 KO vs KO + WT NPCs, ***p < 0.0001 KO vs KO + KO NPCs by one-way ANOVA, followed by Dunnett’s post-hoc test. In (E): ***p < 0.0001 WT vs KO by unpaired t test; **p = 0.0076 KO vs KO + WT NPCs, ***p = 0.0003 KO vs KO + KO NPCs by one-way ANOVA, followed by Dunnett’s post-hoc test. n = 84 WT, n = 83 KO, n = 77 KO + WT NPCs, n = 90 KO + KO NPCs. Data derived from 6 mice/genotype and from 2 independent experiments. Source data are available online for this figure.
Figure 3
Figure 3. NPCs ameliorate synaptic defects in Mecp2 KO neurons by sensing the pathological environment.
(A) Representative images of WT and KO neurons (DIV14) immunostained for Synapsin1/2 (Syn1/2; green), Shank2 (red), and Map2 (white) left untreated (UT) or treated with the conditioned medium (CM) collected from the co-cultures between WT neurons and NPCs (CM NPCWT), or between KO neurons and NPCs (CM NPCKO) or NIH3T3 (CM NIH3T3KO). Scale bar = 5 µm. (BD) Histograms show the mean ± SEM of Synapsin1/2 and Shank2 puncta density (B, C) and their colocalization (D). In (B): #p < 0.0001 WT vs KO by unpaired t test; ***p < 0.0001 KO vs KO + CM NPCKO, ***p = 0.0003 KO + CM NPCWT vs KO + CM NPCKO, ***p < 0.0001 KO + CM NPCKO vs KO + CM NIH3T3KO by one-way ANOVA followed by Tukey post-hoc test. In (C): #p < 0.0001 WT vs KO by unpaired t test; ***p = 0.0006 KO vs KO + CM NPCKO, ***p = 0.0001 KO + CM NPCKO vs KO + CM NIH3T3KO by one-way ANOVA followed by Tukey post-hoc test. In (D): #p < 0.0001 WT vs KO by unpaired t test; **p = 0.0023 KO vs KO + CM NPCKO, ***p < 0.0001 KO + CM NPCWT vs KO + CM NPCKO, ***p < 0.0001 KO + CM NPCKO vs KO + CM NIH3T3KO by one-way ANOVA followed by Tukey post-hoc test. n = 56 KO, n = 51 KO + CM NPCWT, n = 67 KO + CM NPCKO, n = 28 KO + CM NIH3T3KO. WT and KO neurons derived from a pool of 3 mice/genotype, whereas CM was collected from at least 6 different co-cultures per genotype and 3 independent experiments. Source data are available online for this figure.
Figure 4
Figure 4. NPC transplantation prolongs the lifespan and ameliorates RTT-like impairments in Mecp2 KO mice.
(A) NPCs were injected in WT and KO mice (P45-47) and behavioral tests were conducted starting from 10 days after transplantation. Ciclosporin A (50 mg/kg, s.c.) was daily administered both in PBS- and NPC-treated WT/KO mice starting the day before surgery and for 15 days. (B) Kaplan–Meyer survival analysis shows that NPC transplantation prolongs the lifespan of KO mice compared to PBS-treated KO animals. The median survival corresponds to 70 days for PBS-KO mice and 94 days for NPC-KO mice. *p = 0.0303 by Gehan-Breslow-Wilcoxon test. n = 13 PBS-treated KO, n = 11 NPC-treated KO. (C) The graph depicts the mean ± SEM of the cumulative phenotypic score calculated for all the experimental groups. The black arrow indicates the day of transplantation. Asterisk denotes a significant difference between KO+NPCs and KO + PBS mice. The difference between KO + PBS and WT + PBS mice, or KO+NPCs and WT + PBS is omitted, although significant at all time-points, excluding at day −5. *p = 0.0257, ***p = 0.0002 by two-way ANOVA followed by Tukey post-hoc test. n = 15 WT + PBS, n = 15 WT+NPCs, n = 8 KO + PBS, n = 12 KO+NPCs. (D) Heatmap of the phenotypic score at the 12th day after NPC transplantation, indicating in a gray scale the severity for each symptom (from 0 = absent to 2 = very severe). n = 15 WT + PBS, n = 15 WT+NPCs, n = 8 KO + PBS, n = 12 KO+NPCs. (E) The graph represents the mean ± SEM of the time (in seconds) spent on the rod during each day of the test, thus deducing motor learning. Asterisks and hashtags denote a significant difference between KO+NPCs and KO + PBS mice, and between KO + PBS and WT + PBS mice, respectively, at day 3. § indicates a significant difference both in WT + PBS and in KO+NPCs in between the performance at day 3 and day 1. ##p = 0.0033, ***p = 0.0003, §p = 0.0002 in WT + PBS and §p < 0.0001 in KO+NPCs by two-way ANOVA followed by Tukey post-hoc test. (F) The histogram shows the mean ± SEM of the time (in seconds) spent on the rod at the 3rd day of the test. ***p = 0.0001 WT vs KO, ***p < 0.0001 KO vs KO+NPCs by two-way ANOVA followed by Tukey post-hoc test. (G) The histogram represents the mean ± SEM of the discrimination (D.I.) index values, defined as: time exploring the novel object – time exploring the familiar object)/total time) assessed by novel object recognition (NOR) test. *p = 0.0162 by two-way ANOVA followed by Tukey post-hoc test; ns indicated no statistically significant difference between NPC-treated KO and PBS-treated WT mice. (H) The histogram shows the distance (in cm) travelled during the first day of NOR test, expressed as mean ± SEM. ***p < 0.0001 WT vs KO, ***p = 0.0003 WT vs KO+NPCs by two-way ANOVA followed by Tukey post-hoc test. In (EH), n = 14 WT + PBS, n = 12 WT+NPCs, n = 11 KO + PBS, n = 16 KO+NPCs. Source data are available online for this figure.
Figure 5
Figure 5. NPCs localize along the meninges in Mecp2 KO brain and mainly retain an undifferentiated phenotype.
(A) 3D reconstruction of NPCs’ distribution in the KO brain by Neurolucida software. (B) Representative images of GFP+-NPCs (green) localized along the meninges in the caudal region of the brain at 4, 10, and 20 days after transplantation (n = 3/time point). Nuclei are immunostained with DAPI (blue). Scale bar = 50 µm. (C) Representative images of GFP+-NPCs (green) with different cell markers (red). Scale bar = 20 µm. Source data are available online for this figure.
Figure 6
Figure 6. NPC transplantation in Mecp2 Het animals only improves their cognitive defects, without ameliorating their general well-being and motor abnormalities, in accordance with their limited grafting.
(A) Representative image of GFP+-NPCs (in green) and GFAP (in red) in the caudal part of the Het brain 10 day after transplantation. Scale bar = 100 µm. (B) The graph depicts the mean ± SEM of the cumulative phenotypic score in female WT and Het mice injected with NPCs at P180. The black arrow indicates the day of transplantation. Black asterisk denotes a significant difference between Het+PBS and WT+PBS mice, whereas violet asterisk indicates a significant difference between Het+NPCs and WT+PBS mice. At day 4: **p = 0.0022; at day 8: **p = 0.0020, ***p < 0.0001; at day 13: ***p < 0.0001 by two-way ANOVA followed by Tukey post-hoc test. n = 8 WT + PBS, n = 6 WT+NPCs, n = 11 Het+PBS, n = 11 Het+NPCs. (C) The graph shows the mean ± SEM of the time (in seconds) spent on the rod during the 3rd day of the test. *p = 0.0474, **p = 0.0039 by two-way ANOVA followed by Tukey post-hoc test. n = 6 WT + PBS; n = 6 WT+NPCs; n = 12 Het+PBS; n = 13 Het+NPCs. (D) The histogram represents the mean ± SEM of the discrimination (D.I.) index values, assessed by novel object recognition (NOR) test. *p = 0.0175 by two-way ANOVA followed by Tukey post-hoc test; ns indicated no significant difference between NPC-treated Het and PBS-treated WT mice. n = 5 WT + PBS; n = 5 WT+NPCs; n = 11 Het+PBS; n = 10 Het+NPCs. Source data are available online for this figure.
Figure 7
Figure 7. Bulk-RNA sequencing revealed the activation of IFNγ pathway in the transplanted Mecp2 KO cerebellum.
(A) Principal component analysis (PCA) plot for the sequenced samples of WT (n = 6), KO (n = 5), WT+NPCs (n = 5) and KO+NPCs (n = 6) cerebella. Percentage of variance is reported for both PC1 (first component) and PC2 (second component). (B) The number of deregulated genes (DEGs) for the different comparison is reported, considering a p.adj < 0.05. The number of DEGs with a LogFoldChange lower than −1 (down-regulated genes) or LogFoldChange greater than 1 (upregulated genes) is also indicated. (C) Dot plot of Gene Ontology (GO) enriched pathway analysis in the cerebellum, indicating the top 30 most enriched pathways of the comparison between KO+NPCs versus KO samples. For a description of the statistical method implemented in DESeq2 or ORA see Boyle et al (2004) and Yu et al (2012), respectively. (D) The graph shows the LogFoldChange (LFC) of genes belonging to the GO pathway “Interferon-γ response” in the comparisons KO versus WT, WT + NPC versus WT, and KO+NPCs versus KO. (E) Gene set enrichment analysis (GSEA) of IFNγ response in cerebella, indicating a significant enrichment of the gene set in KO+NPCs vs KO comparison, as well as in KO+NPCs vs WT comparison. (F) The histogram reports the transcriptional levels of genes associated to IFNγ pathway. Data, expressed as percentage of WT, are shown as mean ± SEM. Parp9: *p = 0.0292 WT vs KO, §p = 0.0508 KO vs KO+NPCs; Iftm3: ***p = 0.0007 WT vs KO, ***p = 0.0008 KO vs KO+NPCs; Irf8: ***p = 0.0002 KO vs KO+NPCs; Bst2: *p = 0.0274 WT vs KO, ***p = 0.0010 KO vs KO+NPCs by two-way ANOVA followed by Sidak’s post-hoc test. n = 5 WT, n = 6 WT+NPCs, n = 5 KO, n = 6 KO+NPCs. (G) Western blot analysis of phosphorylated STAT1 (P-STAT1) in WT or KO neurons cultured with NPCs (for 14 days) (n = 7 mouse embryos/genotype). Data are represented as mean ± SEM and expressed as percentage of WT neurons cultured alone. *p = 0.0242 by two-way ANOVA followed by Sidak’s post hoc test. Representative bands of P-STAT1 and the corresponding lanes of TGX-stain free gel are reported. Source data are available online for this figure.
Figure 8
Figure 8. Synaptic defects of Mecp2 KO cortical neurons are improved by IFNγ treatment.
(A) Representative images of WT and KO neurons (DIV14) untreated or treated for 24 h at DIV13 with IFNγ (25 and 100 ng/ml) and immunostained for Synapsin1/2 (Syn1/2; green), Shank2 (red) and Map2 (white). Scale bar = 5 µm. (BD) Histograms report the mean ± SEM of the number of puncta counted in 20 µm for Synapsin1/2 (B), Shank2 (C), and colocalized puncta (D). In (B): ***p < 0.0001 WT vs KO, *p = 0.0379 KO vs KO + IFNγ 25 ng/μl, **p = 0.0047 KO + IFNγ 25 ng/μl vs KO + IFNγ 100 ng/μl, ***p < 0.0001 KO vs KO + IFNγ 100 ng/μl by two-way ANOVA followed by Tukey post-hoc test. In (C): **p = 0.0050 WT vs KO, ***p < 0.0001 KO + IFNγ 25 ng/μl vs KO + IFNγ 100 ng/μl, ***p < 0.0001 KO vs KO + IFNγ 100 ng/μl by two-way ANOVA followed by Tukey post-hoc test. In (D): ***p < 0.0001 WT vs KO, ***p < 0.0001 KO vs KO + IFNγ 100 ng/μl, ***p < 0.0001 KO + IFNγ 25 ng/μl vs KO + IFNγ 100 ng/μl, *p = 0.0447 WT vs KO 25 ng/μl by two-way ANOVA followed by Tukey post-hoc test. n = 44 WT, n = 32 WT + IFNγ 25 ng/ml, n = 40 WT + IFNγ 100 ng/ml, n = 47 KO, n = 47 KO + IFNγ 25 ng/ml, n = 52 KO + IFNγ 100 ng/ml. Neurons derived from at least 3 mice/genotype, from 2 independent experiments. (E) Representative images of WT and Het neurons (DIV14) untreated or treated for 24 h at DIV13 with IFNγ (25 and 100 ng/ml) and immunostained for Synapsin1/2 (Syn1/2; green) and Map2 (red). Scale bar = 5 µm. (F) The graph shows the mean ± SEM of Synapsin1/2 puncta density. *p = 0.0118 Het vs Het+IFNγ 100 ng/μl, ***p < 0.0001 WT vs Het, ***p < 0.0001 WT vs Het+IFNγ 25 ng/μl, ***p = 0.0006 WT vs Het+IFNγ 100 ng/μl by two-way ANOVA followed by Tukey post-hoc test. n = 23 WT, n = 37 WT + IFNγ 25 ng/ml, n = 37 WT + IFNγ 100 ng/ml, n = 49 Het, n = 35 Het+IFNγ 25 ng/ml, n = 37 Het+IFNγ 100 ng/ml. Neurons derived from at least 3 mice/genotype, from 2 independent experiments. Source data are available online for this figure.
Figure 9
Figure 9. IFNγ injection in Mecp2 deficient mice rescues motor and cognitive impairments.
(A) Scheme of in vivo experiments in which IFNγ (20 ng/10 µl) or vehicle (Veh) was stereotaxically injected in WT and KO mice (P45; i.c.m.). Three cohorts of mice were used for assessing cognitive, motor and breathing defects. (B) The histogram shows the mean ± SEM of the discrimination (D.I.) index values. **p = 0.0092 WT vs KO, **p = 0.0084 KO vs KO + IFNγ by two-way ANOVA followed by Tukey post-hoc test. n = 11 WT+Veh, n = 7 KO+Veh, n = 9 WT + IFNγ, n = 9 KO + IFNγ. (C, D) The graphs represent the mean ± SEM of the time (in seconds) spent on the rod during each day of the test reflecting motor learning abilities. In (C), the graph shows the mean ± SEM of the time (in seconds) spent on the rod at the 3rd day of the test. ***p < 0.0001 and *p = 0.0178, by two-way ANOVA followed by Tukey post-hoc test. In (D), the graph reports the time spent on the rod during each day of the Rotarod test. *p = 0.0342 by two-way ANOVA followed by Tukey post-hoc test. n = 11 WT+Veh, n = 8 KO+Veh, n = 10 WT + IFNγ, n = 8 KO + IFNγ. (E) Representative traces from the WBP analysis of WT and KO mice treated with vehicle or IFNγ. (FH) The histograms show the mean ± SEM of the frequency, time of expiration (Te) and inspiration (Ti) measured by WBP in WT and KO mice 72 h after injection. In (F), *p = 0.0234 and ***p = 0.0006; in (G), *p = 0.024; in (H), **p = 0.0014 and ***p < 0.0001 by two-way ANOVA followed by Tukey post-hoc test. n = 10 WT+Veh, n = 11 KO+Veh, n = 7 WT + IFNγ, n = 11 KO + IFNγ. (I) Schematic representation of the in vivo experiments, in which IFNγ (20 ng/10 µl) or vehicle (Veh) was stereotaxically injected in WT and Het mice (P90; i.c.m.) before testing short-term memory functions. (J) The graph represents the mean ± SEM of the discrimination (D.I.) index values assessed by NOR test. §p = 0.0593 and **p = 0.0080 by two-way ANOVA followed by Sidak’s post-hoc test. n = 10 WT+Veh, n = 7 Het+Veh, n = 6 WT + IFNγ, n = 6 Het+IFNγ. Source data are available online for this figure.
Figure EV1
Figure EV1. NPC effects on the morphological and functional properties of neurons.
(A) Sholl analysis reports the capacity of NPCs to increase dendritic complexity also in WT neurons. The graph depicts the mean ± SEM of the number of intersections of WT neurons cultured alone, or with NIH3T3 or NPCs from DIV0 to DIV7. *p = 0.0194 at 30 μm, *p = 0.0270 at 50 μm, *p = 0.0045 at 60 μm, *p = 0.0074 at 70 μm, *p = 0.0256 at 80 μm, *p = 0.0262 at 130 μm, *p = 0.0070 at 140 μm by two-way ANOVA followed by Tukey post-hoc test. n = 33 WT, n = 17 WT + NIH3T3; n = 39 WT + NPC. (B) The histogram shows the mean ± SEM of the total number of intersections calculated by Sholl analysis for WT and KO neurons cultured alone, or in culture with NIH3T3 or NPCs from DIV0 to DIV7. *p = 0.0135 WT vs KO, *p = 0.0275 WT vs WT+NPCs, **p = 0.0032 KO vs KO+NPCs by two-way ANOVA followed by Tukey post-hoc test. n = 33 WT, n = 17 WT + NIH3T3; n = 39 WT + NPC; n = 39 KO; n = 26 KO + NIH3T3; n = 32 KO+NPCs. Neurons derived from at least 3 different mice/genotype. (C) Representative traces of excitatory postsynaptic current in miniature (mEPSCs) recorded in primary WT and Het neurons (left) and in Het neurons treated with NPC or NIH3T3 (right). (D) Histograms represent the mean ± SEM of the mEPSCs frequency (Hz) and amplitude (pA) both expressed as values normalized on the frequency of WT neurons or amplitude of WT neurons. n = 26 WT; n = 24 Het; n = 19 Het+NPCs; n = 14 Het+NIH3T3. Data derived from 3 independent experiments. **p = 0.0025 WT vs Het by Mann–Whitney test; *p = 0.0405 by one-way ANOVA followed by Dunn’s test. (E) The graph reports the percentage of contamination ± SEM of astrocytes, oligodendrocytes and microglia in cortical neurons at DIV14, independently from the genotype. n = 3 for each genotype.
Figure EV2
Figure EV2. Phenotypic characterization of NPC-transplanted Mecp2 KO mice.
(AE) Behavioral scoring was performed by a researcher blind to the treatment, assigning a score between 0 and 2 to general aspect (A), mobility (B), gait (C), tremor (D), and clasping (E). For each parameter, the graph reports its progression by a cumulative plot, in which the mean ± SEM of each value is obtained by summing the score of each day with those assigned the preceding days. Asterisks indicate a significant difference between KO + PBS and KO+NPCs; hashtags denote a difference between KO + NPC and WT mice. #p = 0.0140 for clasping, ##p = 0.0010 for gait, ##p = 0.0022 for mobility, ###p < 0.0001 for parameters, *p = 0.0144 for general aspect, *p = 0.0224 and ***p = 0.0005 for gait, *p = 0.0367 for tremor by two-way ANOVA followed by Tukey post-hoc test. n = 15 WT + PBS, n = 15 WT+NPCs, n = 9 KO + PBS, n = 12 KO+NPCs. (F) Representative traces of the distance travelled during the first day of NOR test by WT + PBS, KO + PBS, WT+NPCs and KO+NPCs mice. The corresponding data are reported in Fig. 4H.
Figure EV3
Figure EV3. Gene Ontology (GO) analysis.
(A) Dot plot of Gene Ontology (GO) enriched pathway analysis in the cerebellum, indicating the top 30 most enriched pathways of the comparison between KO versus WT samples. For a description of the statistical method implemented in ORA see Yu et al, .
Figure EV4
Figure EV4. Bulk RNA-sequencing indicated a mild upregulation of the IFNγ response in the hippocampus of KO mice after NPC transplantation.
(A) The table reports the number of deregulated genes (DEGs) for the different comparisons, considering a p.adj < 0.05 and a p.adj < 0.1. The number of DEGs with a LogFoldChange lower than −1 (down-regulated genes) or LogFoldChange greater than 1 (upregulated genes) is also indicated. WT (n = 6), KO (n = 5), WT+NPCs (n = 5) and KO+NPCs (n = 6) hippocampi. (B) Dot plot of Gene Ontology (GO) indicating the top 20 most enriched pathways of the comparison between KO+NPCs versus KO samples. For a description of the statistical method implemented in DESeq2 or ORA see Boyle et al (2004) and Yu et al (2012), respectively. (C) The graph shows the LogFoldChange (LFC) of genes belonging to the GO pathway “Interferon-γ response” in the comparisons KO versus WT, WT + NPC versus WT, and KO+NPCs versus KO.
Figure EV5
Figure EV5. IFNγ does not affect neuronal survival and activates its downstream kinase in vitro.
(A) The histogram represents the cell survival (% untreated WT neurons) ± SEM, assessed by MTT assay. IFNγ was added for 24 h in DIV13 primary neurons and three doses were tested: 25, 75, and 100 ng/ml. (B) The histogram reports the mean ± SEM of the levels of phosphorylated STAT1 after IFNγ treatment. Data are normalized to total protein content, visualized by a TGX stain-free technology. Representative bands of phosphorylated STAT1, and the corresponding lanes of TGX-stain-free gel, in WT and KO neurons treated or not with IFNγ are depicted. §p = 0.0003 WT-UT vs WT 100 ng/ml and §p < 0.0001 for the other comparisons, by two-way ANOVA followed by Tukey’s post-hoc test. § denotes a significant difference respect to the corresponding untreated control of the same genotype. WT and KO neurons derived from 3 different mice/genotype.

References

    1. Albizzati E, Breccia M, Florio E, Cabasino C, Postogna FM, Grassi R, Boda E, Battaglia C, De Palma C, De Quattro C et al (2024) Mecp2 knock-out astrocytes affect synaptogenesis by interleukin 6 dependent mechanisms. iScience 27(3):109296 - PMC - PubMed
    1. Albizzati E, Florio E, Miramondi F, Sormonta I, Landsberger N, Frasca A (2022) Identification of region-specific cytoskeletal and molecular alterations in astrocytes of Mecp2 deficient animals. Front Neurosci 16:823060 - PMC - PubMed
    1. Ananiev G, Williams EC, Li H, Chang Q (2011) Isogenic pairs of wild type and mutant induced pluripotent stem cell (iPSC) lines from Rett syndrome patients as in vitro disease model. PLoS ONE 6(9):e25255 - PMC - PubMed
    1. Armstrong DD (2005) Neuropathology of Rett syndrome. J Child Neurol 20(9):747–753 - PubMed
    1. Arolt V, Rothermundt M, Wandinger KP, Kirchner H (2000) Decreased in vitro production of interferon-gamma and interleukin-2 in whole blood of patients with schizophrenia during treatment. Mol Psychiatry 5:150–158 - PubMed

Substances