. 2025 Jan;32(1):137-149.
doi: 10.1038/s41594-024-01391-7. Epub 2024 Sep 20.

Super-silencer perturbation by EZH2 and REST inhibition leads to large loss of chromatin interactions and reduction in cancer growth

Affiliations

Super-silencer perturbation by EZH2 and REST inhibition leads to large loss of chromatin interactions and reduction in cancer growth

Ying Zhang et al. Nat Struct Mol Biol. 2025 Jan.

Abstract

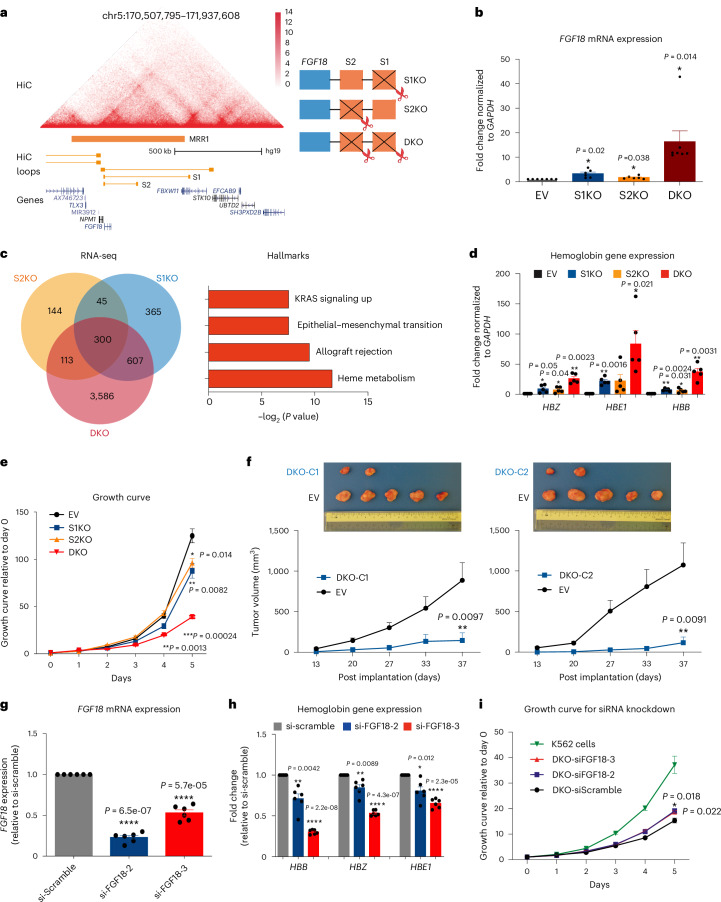
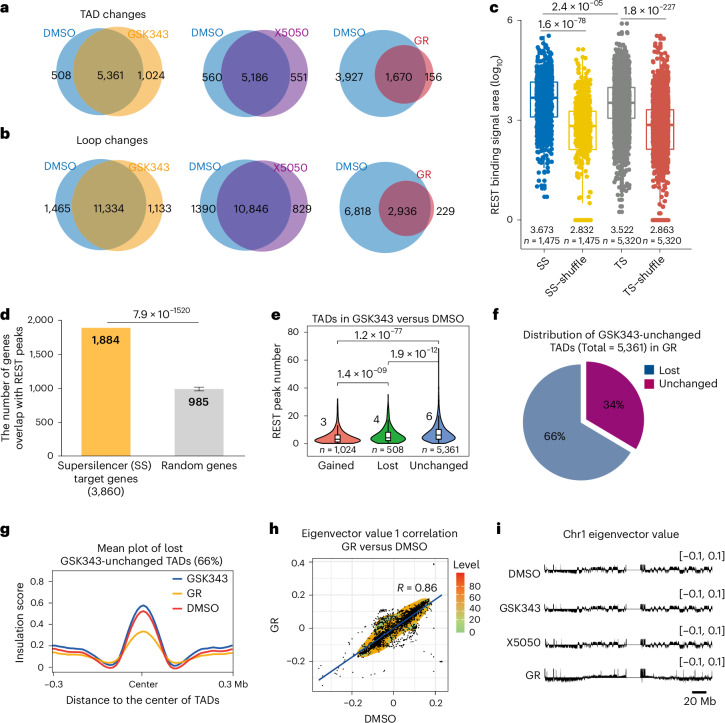
Human silencers have been shown to regulate developmental gene expression. However, the functional importance of human silencers needs to be elucidated, such as whether they can form 'super-silencers' and whether they are linked to cancer progression. Here, we show two silencer components of the FGF18 gene can cooperate through compensatory chromatin interactions to form a super-silencer. Double knockout of two silencers exhibited synergistic upregulation of FGF18 expression and changes in cell identity. To perturb the super-silencers, we applied combinational treatment of an enhancer of zeste homolog 2 inhibitor GSK343, and a repressor element 1-silencing transcription factor inhibitor, X5050 ('GR'). Interestingly, GR led to severe loss of topologically associated domains and loops, which were associated with reduced CTCF and TOP2A mRNA levels. Moreover, GR synergistically upregulated super-silencer-controlled genes related to cell cycle, apoptosis and DNA damage, leading to anticancer effects in vivo. Overall, our data demonstrated a super-silencer example and showed that GR can disrupt super-silencers, potentially leading to cancer ablation.


Conflict of interest statement

Competing interests: M.J.F. declares seven patents held related to ChIA-PET and nucleic acid molecular biology methods. The other authors declare no competing interests.

Figures

Fig. 1
Fig. 1. Two silencers in the same MRR can form an SS.
a, Hi-C matrix (at 5-kb resolution) and loops at MRR1 region showing two looping silencers (S1 and S2) that exhibit chromatin interactions with FGF18 gene in K562 cells. Schematic depicting the strategy to delete silencer components to generate S1KO, S2KO and DKO using CRISPR–Cas9 gene-editing tool. b, RT–qPCR analysis of FGF18 expression in vector control clone (EV), S1KO, S2KO and DKO cells. The relative fold change normalized to GAPDH is plotted. c, Venn diagram depicting number of significant DEGs in RNA-seq data of S1KO, S2KO and DKO cells compared to EV cells. GSEA performed using intersection of significant DEGs in different RNA-seq datasets (300 genes) against cancer hallmark database. Data are shown as the −log2(P value). d, RT–qPCR analysis of expression of hemoglobin genes (HBZ, HBE1 and HBB) in EV, S1KO, S2KO and DKO cells. The relative fold change normalized to GAPDH is plotted. e, Growth curves in EV cells and different KO cells. Data were calculated as the fold change against day 0. f, Top, representative tumors are pictured on the final day; bottom, the tumor volume (mm3) on different postimplantation days. Tumor growth in SCID mice injected with DKO-C1, D1KO-C2 and EV cells. g,h, RT–qPCR analysis of expression of FGF18 (g) and hemoglobin genes (HBZ, HBE1 and HBB) (h) upon siRNA knockdown in DKO clone. The knockdown experiment was performed using siScramble and two different siRNAs targeting human FGF18 (siFGF18). Data are shown as the fold change relative to siScramble. i, Growth curves of wild-type K562 cells and DKO clones transfected with either siScramble or siFGF18. Data were calculated as the fold change against day 0. Data are shown as the mean ± s.e.m. (b,di); n = 5 biologically independent replicates (d,e,i), n = 6 biologically independent replicates (b,g,h), n = 2 biological replicates (c) or n = 5 mice (f) per condition. Statistical analysis was performed using a two-tailed, unpaired Student’s t-test (b,di); *P < 0.05, **P < 0.01 and ***P < 0.001. Source data
Fig. 2
Fig. 2. 3D genome organization underlies the synergism of silencers.
a, Venn diagram depicting significant chromatin interactions identified by 4C-seq using FGF18 promoter as viewpoint in EV, S1KO and DKO cells. Two biological replicates of 4C-seq were performed for each condition and significant chromatin interactions (P < 0.05) were analyzed using the R3Cseq package. b, Screenshot depicting aligned Hi-C matrix (at 5-kb resolution) and insulation score. The FGF18 SS region is highlighted by the orange box and some specific sites (FGF18 gene region, S2 and S1) are indicated. The red arrow indicates the new insulation peak at the S2 site in DKO cells. 4C-seq of EV, S1KO and DKO at FGF18 SS region. Colors of arcs represent histone states of chromatin interactions (yellow, H3K27ac-associated loops; blue, H3K27me3-associated loops; green, both H3K27ac-associated and H3K27me3-associated loops; gray, no H3K27ac-associated and H3K27me3-associated loops). The red arrow indicates the compensated chromatin interactions to the S2 site in S1KO cells. Two biological independent replicates of Hi-C and 4C-seq were performed for each condition. c, Mean plot of insulation score around TAD center ± 0.3 Mb (using TADs in EV as reference TADs) in EV and different KO cells (S1KO, S2KO and DKO). d, APA for all loops in EV, S1KO, S2KO and DKO cells (using EV loops as reference). Loops were aggregated at the center of a 50-kb window at 5-kb resolution. The ratios of signal at the peak signal enrichment (P) to the average signal at the lower left corner of the plot (LL) (P2LL) are indicated to show the normalized intensity of all loops. e, CTCF CUT&RUN signal tracks at FGF18 SS region in EV, S1KO, S2KO and DKO cells. Increased CTCF CUT&RUN peaks are indicated by black arrows. Two biological replicates of CUT&RUN were performed for each condition. f, ATAC-seq signal tracks at FGF18 region in EV, S1KO, S2KO and DKO cells. Increased ATAC-seq peaks are indicated by black arrows. Two biological replicates of ATAC-seq were performed for each condition. Source data
Fig. 3
Fig. 3. GR treatment leads to synergistic loss of TAD and loops.
a,b, Venn diagrams of TAD changes (a) and loop changes (b) in DMSO, GSK343, X5050 and GR in K562 cells. Two biological replicates of Hi-C were performed for each condition. c, Box plot depicting REST enrichment at SSs and TSs in K562 cells. SS-shuffle and TS-shuffle served as random controls. REST enrichment is shown as the REST-binding signal area (log10). d, Bar chart showing REST enrichment at SS target genes and random genomic regions in K562 cells. The y axis shows the number of SS target genes (n = 1) or mean number of random genes (n = 1,000) that overlapped with REST ChIP-seq peaks. e, Violin plot overlaid with a box plot depicting the number of REST peaks at different TAD categories (gained, lost and unchanged) in GSK343 versus DMSO condition in K562 cells. f, Pie chart showing the distribution of GSK343-unchanged TADs compared to all TADs in GR condition. g, Mean plot of insulation score around TAD center ± 0.3 Mb of GSK343-unchanged TADs (66%) lost in GR condition. h, Density plot describing global correlation between eigenvector value from DMSO condition and GR condition at 1-Mb resolution. The x axis represents the eigenvector value in the DMSO condition, while the y axis represents the eigenvector value in the GR condition at the same locus. i, Eigenvector value for 50-kb resolution at chromosome 1 in DMSO, GSK343, X5050 and GR conditions. In the box-and-whisker plot, whiskers are extended to the furthest value that is no more than 1.5 times the interquartile range (c). The boxes represent the 25th percentile, median and 75th percentile (c,e). Data are shown as the median (c,e) or mean ± s.d. (d); n = 2 biologically independent replicates for each condition (ac). Statistical analysis was performed using a two-tailed Wilcoxon test (c,e) or one-sided one-sample t-test (d). Source data
Fig. 4
Fig. 4. GR leads to apoptosis through SS-controlled genes.
a,b Box plots describing the number of SS peaks and their randomly generated artificial SS peaks (a) and the number of H3K27ac peaks and their randomly generated artificial H3K27ac peaks (b) per 100 kb (log10 scale) on lost TADs (GR versus DMSO). c, Enrichment analysis of histone mark peaks relative to random peak sets. The fold change in the median of histone mark peaks per 100 kb (log10 scale) is shown. This was calculated by taking the median of SS (dark blue), H3K27me3 (light blue), SE (dark red) and H3K27ac (light red) peaks divided by the corresponding median of random peaks per 100 kb (log10 scale) on lost TADs (GR versus DMSO). d,e, Screenshot showing Hi-C contact matrix (at 5-kb resolution) of FGF18 (d) and CDKN1A (e) regions in DMSO, GSK343, X5050 and GR conditions. H3K27me3 HiChIP coverage and loops, UCSC gene tracks and SS annotations are shown. H3K27me3 HiChIP loops associated with FGF18 gene, S1 and S2 (left) and CDKN1A gene (right) are indicated in yellow. f, Volcano plots of RNA-seq comparing GSK343, X5050 and GR to DMSO at 72 h. The number of DEGs is indicated. g, Box plot showing changes in mRNA expression levels of non-SS-controlled upregulated genes and SS-controlled upregulated genes at 72 h following GR treatment. h, Pie chart showing distribution of GR-upregulated SS-controlled genes according to their associations with apoptosis, DNA damage and cell-cycle pathways. i, Immunoblots showing protein levels of cleaved PARP (C-PARP), γH2AX and β-actin in K562 cells treated with DMSO, GSK343, X5050 and GR for 72 h. j, Cell-cycle distributions of K562 cells following DMSO, GSK343, X5050 and GR treatments for 72 h were verified by flow cytometry. The percentage of subG1, G0/G1, S and G2/M phases is indicated for different drug-treated conditions. The boxes represent the 25th percentile, median and 75th percentile (a,b,g). Data are shown as the median (a,b,g); n = 2 biologically independent samples (df) or n = 3 biologically independent experiments (i,j) for each condition. Statistical analysis was performed using a two-tailed Wilcoxon test (a,b,g). Source data
Fig. 5
Fig. 5. CTCF and TOP2A depletion by GR explains the loss of TADs.
a,b, Mean plot of insulation score around TAD center ± 0.3 Mb (using TADs in DMSO as a reference) (a) and APA for all loops (using loops in DMSO as a reference) (b) in K562 cells treated with DMSO and GR at indicated time points. c, Box plot showing changes in mRNA expression levels of non-SS-controlled and SS-controlled genes upregulated upon GR treatment at indicated time points. d, Box plots describing RNA normalized read counts in each 20-kb bin calculated from DMSO-treated K562 RNA-seq data (left) and insulation score changes (GR versus DMSO) for TADs either located in or not located in gene deserts (right). NS, not significant. e,f, Fold changes in mRNA expression of CTCF (e) and TOP2 (f) in GR-treated K562 cells at 24 h and 72 h as compared to GR (8 h). g, APA for gained loops (left), lost loops (middle) and unchanged loops (right) in siCTCF-treated (top) and siScramble-treated (bottom) K562 cells. h, Mean plots of insulation score around TAD center ± 0.3 Mb of gained TADs (left), lost TADs (middle) and unchanged TADs (right) in DMSO-treated and etoposide-treated K562 cells. i, Pie charts showing the distribution of overlapped and differential TADs (left) and loops (right) lost upon siCTCF or GR treatments compared to siScramble or DMSO, respectively. j, Pie chart showing the distribution of overlapped and differential TADs lost upon TOP2 inhibitor (etoposide) or GR treatments compared to their corresponding controls. k, Pie chart showing the distribution of TADs that are lost in siCTCF, etoposide and GR conditions. l, Schematic describing overlap of REST-binding genes with GR-upregulated SS-controlled genes associated with decreased mRNA expression of CTCF and TOP2. m, Heat map showing gene expression (log2 fold change) of eight shortlisted REST-binding GR-upregulated SS genes, associated with lost TADs upon GR treatment and mRNA downregulation of CTCF and TOP2. The boxes represent the 25th percentile, median and 75th percentile. Data are shown as the median (c,d); n = 2 biologically independent replicates (c,d). Statistical analysis was performed using a two-tailed Wilcoxon test (c,d). Source data
Fig. 6
Fig. 6. GR exerts synergistic antitumor effects.
a, 3D drug interaction landscapes based on Bliss model shown for GR in K562 (left) and SEM (right) cells. A summarized Bliss score above 10 indicates that two drugs are likely to be synergistic. b, Bar chart showing fold change in growth inhibition relative to vehicle control in SEM cells pretreated with or without IAA (50 µM) and doxycycline (1 µg ml−1) for 48 h, followed by treatment with GSK343 (5 µM) and X5050 (100 µM) for 72 h. c, Bar chart showing the percentage of growth inhibition in K562, THP1, HAP1 and SEM cells and two PBMCs. d, Left, representative images of the colony formation after being treated with DMSO, GSK343, X5050 or GR for 14 days. Right, bar chart showing the percentage of survival in K562 cells treated with DMSO, GSK343, X5050 or GR for 14 days. e, Left, representative tumors pictured on the final day. Middle, tumor weight (mg) on the final day. Right, tumor volume (mm3) on different postimplantation days. Tumor growth in NSG mice injected with K562 cells together with different drugs; n = 5 mice (two male and three female) for vehicle-treated and GR-treated groups; n = 4 mice (two male and two female) for GSK343-treated and X5050-treated groups. f, Box plots showing the percentage of CD45+ cells in spleen, spleen weight, hemoglobin and body weight at endpoint. GSK343 and X5050 were administrated against PDX AML29 cells; 0.1 mg kg−1 GSK343 and 0.25 mg kg−1 X5050 were injected as single or combination treatments twice a week intraperitoneally after the inoculation of leukemia cells (n = 4 mice for each group; one male and three female). g, Schematic depicting GR leading to apoptotic cancer cell death. This figure was created with BioRender. Data are shown as the mean ± s.d. (b) or mean ± s.e.m. (cf). The boxes represent the 25th percentile, median and 75th percentile (e,f); n = 3 biologically independent replicates (ad). Statistical analysis was performed using a two-tailed, unpaired Student’s t-test (bf); *P < 0.05, **P < 0.01 and ***P < 0.001. Source data
Extended Data Fig. 1
Extended Data Fig. 1. Two silencers function synergistically to repress FGF18 expression and control cell identity.
a,b, Genotyping of three positive clones of S2KO (a) and DKO (b) following CRISPR-Cas9 transfection and single cell plate out. Genotyping results of three different clones (KO-1, KO-2, and KO-3) are shown by gel electrophoresis through a pair of flanking and internal primers. c, Hi-C matrix (at 5 kb resolution) and loops at the MRR1 region showing two looping silencers (S1 and S2) that exhibit chromatin interactions with the FGF18 gene in K562 cells. H3K27me3 ChIP-seq shows changes in the H3K27me3 signal in S1KO and DKO after knockout. d, RT-qPCR analysis of expression of FGF18 in three CRISPR knockout clones (KO-1, KO-2, and KO-3) and vector control clone (“Empty Vector”; “EV”) for S1KO (top), S2KO (middle) and DKO cells (bottom). Fold-change normalized to GAPDH plotted. e, Bar graphs showing absorbance values at 560 nm in three CRISPR knockout clones (KO-1, KO-2, and KO-3) and EV for S1KO (top), S2KO (middle) and DKO (bottom) cells. Bovine Serum Albumin (BSA) used as a negative control. f, Principal Components Analysis (PCA) plot of gene expression in EV, S1KO, S2KO and DKO conditions. PCA depicting the variance of the two biological replicates for each condition, as well as the samples from different conditions. Percentage labeled on each axis denotes the extent to which the principal components explained the variation. g, RT-qPCR analysis of expression of hemoglobin genes (HBZ, HBE1 and HBB) in EV cells, S1KO, S2KO and DKO cells. Fold-change normalized to GAPDH plotted. h, Growth curves of EV, S1KO, S2KO, and DKO cells. Data calculated as fold change against day 0. Data shown as mean ± standard error of mean (SEM) (d,e,g,h); n = 5 biologically independent replicates (g,h), n = 4 biologically independent replicates for DKO (d), n = 6 biologically independent replicates for S1KO and S2KO (d), and n = 3 biologically independent replicates for e; two-tailed, unpaired Student’s t-test (d,e,g,h). P values less than 0.05, 0.01 or 0.001 are denoted as *, ** or ***, respectively. Source data
Extended Data Fig. 2
Extended Data Fig. 2. FGF18 positively regulates erythroid differentiation and negatively regulates cell viability.
a, Cell viability of K562 cells either treated with sterile water (control) or recombinant human FGF18 (rhFGF18) at the indicated concentrations for 72 h. Results are expressed as percentage of cell viability relative to the control. b, RT-qPCR analysis of the expression of FGF18 nearby genes (FBXW11, STK10, NPM1, UBTD2 and SH3PXD2B) in EV, S1KO, S2KO and DKO cells. c, RT-qPCR analysis of the expression of HBB, HBE1 and HBZ genes in serum-starved K562 cells treated with water or rhFGF18 for 72 h in the presence or absence of cycloheximide (CHX). HBB, HBE and HBZ mRNA expression was normalized to RPLPO mRNA expression. Gene expression expressed as fold-change relative to unstimulated control (-FGF18, -CHX). d, RT-qPCR analysis of the expression of HBB, HBE1 and HBZ genes in serum-starved K562 cells treated with water or rhFGF18 for 72 h in the presence of cycloheximide. HBB, HBE and HBZ mRNA expression was normalized to RPLPO mRNA expression. Gene expression expressed as fold-change relative to unstimulated control (-FGF18, +CHX). e, Schematic depicting the proposed direct and indirect signaling pathways of FGF18 in regulating HBB, HBE1 and HBZ genes. This figure was created with BioRender (https://biorender.com). Data shown as mean ± standard deviation (SD) (a,c,d) and mean ± SEM (b); n = 3 biologically independent replicates (a-d); two-tailed, unpaired Student’s t-test (a-d). P values less than 0.05, 0.01 or 0.001 are denoted as *, ** or ***, respectively. Source data
Extended Data Fig. 3
Extended Data Fig. 3. S1KO and DKO cells showed a tendency to gain or lose long-distance loops more easily than nearby loops.
a,b, Density plots of 4C-seq in S1KO vs EV (a) and DKO vs EV (b) conditions. 4C-seq loops are classified into three different categories (gained, lost and unchanged). Each category is plotted using the distance to the 4 C viewpoint. The average distance is shown as a dotted line. c, Hi-C matrices (at 5 kb resolution) at the IGF2 MRR region in EV, S1KO, S2KO and DKO cells. N = 2 biologically independent replicates for each condition (a-c). Source data
Extended Data Fig. 4
Extended Data Fig. 4. The unchanged loops and gained loops at FGF18 locus in DKO cells demonstrate increased H3K27ac signals and decreased H3K27me3 signals.
a, Mean plots showing average signal density of H3K27ac ChIP-seq (left) and H3K27me3 ChIP-seq (right) around the transcription start site (TSS) of known genes ± 3 kb in EV, S1KO, and DKO conditions. X-axis represents genome distance to TSS of genes. b, Screenshot showing H3K27ac ChIP-seq and H3K27me3 ChIP-seq signal tracks at FGF18 gene region in EV, S1KO and DKO cells. Bar graph showing ChIP-qPCR against H3K27ac marks is performed at five regions along FGF18 gene body (R1-R5). Data shown as % of input. Data shown as mean ± SEM (b); n = 3 biologically independent replicates (a,b); two-tailed, unpaired Student’s t-test (b). P values less than 0.05 are denoted as *. Source data
Extended Data Fig. 5
Extended Data Fig. 5. Double knockout of silencers leads to increased H3K27ac-associated loops to the FGF18 promoter region.
a,b, Boxplots (a) and heatmaps (b) showing ChIP-seq signal changes of H3K27me3 and H3K27ac at different types of 4C regions (gained, lost and unchanged 4C loops) in EV and DKO cells. The same 4C regions are connected by gray lines in the boxplot. c,d, Boxplots (c) and heatmaps (d) of ChIP-seq signal changes of H3K27me3 and H3K27ac at different types of 4C regions (gained, lost and unchanged 4C loops) in S1KO and DKO cells. The same 4C regions are connected by gray lines in the boxplot. e,f, Boxplots (e) and heatmaps (f) showing ChIP-seq signal changes of H3K27me3 and H3K27ac at different types of 4C regions (gained, lost and unchanged 4C loops) in EV and S1KO cells. The same 4C regions are connected by gray lines in the boxplot. Box and whisker plot: whiskers were extended to the furthest value that is no more than 1.5 times the inter-quartile range. The boxes represent the 25th percentile, median, and 75th percentile. The boxes represent the 25th percentile, median, and 75th percentile (a,c,e); n = 2 biologically independent replicates (a-f); two-sided Wilcoxon Signed-Rank paired test (a,c,e).
Extended Data Fig. 6
Extended Data Fig. 6. Double knockout of silencers leads to the formation of new enhancer loops connecting FGF18 gene promoter.
a, Screenshot of UCSC tracks (chr5:170,745,519-171,087,194) depicting aligned H3K27ac ChIP-seq and H3K27me3 ChIP-seq signal tracks, 4C-seq loop tracks of promoter-enhancer loops related to FGF18 promoter region in EV, S1KO and DKO cells. The FGF18 promoter is highlighted in orange line. Red arrows indicate the promoter-enhancer loops of DKO with higher H3K27ac signals than EV and S1KO conditions. b, Screenshot depicting aligned H3K27ac ChIP-seq and H3K27me3 ChIP-seq signal tracks, 4C-seq interaction region tracks of enhancer 1 (one of the new enhancers found in DKO cells) in EV, S1KO and DKO cells. Enhancer 1 is highlighted in blue. 3C-PCR of enhancer 1 in EV, S1KO and DKO cells by two independent 3 C libraries. Data are relative intensity measured with ImageJ. The panel below are the sanger sequencing results for the 3C ligated fragment. FGF18 promoter sequence, HindIII cut site and enhancer 1 sequence are indicated. c, Screenshot depicting aligned H3K27ac ChIP-seq and H3K27me3 ChIP-seq signal tracks, 4C-seq interaction region tracks of enhancer 2 (another new enhancer found in DKO cells) in EV, S1KO and DKO cells. Enhancer 2 is highlighted in blue. d,e, Bar graphs showing ratio of SS (n = 1) or random regions (n = 1000) overlapped with SNPs (d) or ratio of SNPs overlapped with SS (n = 1) or random regions (n = 1000) (e) in different SNP groups (all diseases, all cancer, and AML + CML). Disease-associated SNPs were downloaded from GWAS. P values comparing super-silencers with random regions for each group were indicated. Data shown as mean ± SEM (b) and mean ± SD (d,e); n = 2 biologically independent replicates (b,d,e); two-tailed, unpaired Student’s t-test (b) and one-sided, one sample t-test (d,e). Source data
Extended Data Fig. 7
Extended Data Fig. 7. Single treatment of GSK343 or X5050 in K562 cells leads to modest changes in TADs and loops.
a, Mean plots describing insulation score around TADs center ± 0.3 Mb in the gained, lost and unchanged TADs in GSK343 vs DMSO condition. b,c Aggregate peak analysis (APA) for unchanged, lost and gained loops in GSK343 vs DMSO (b) and X5050 vs DMSO (c) conditions. Loops aggregated at the center of a 50 kb window at 5 kb resolution. d, Mean plots describing insulation score around TADs center ± 0.3 Mb in the gained, lost and unchanged TADs in X5050 vs DMSO condition. N = 2 biologically independent replicates per condition (a-d). Source data
Extended Data Fig. 8
Extended Data Fig. 8. Combinational treatment of GSK343 and X5050 in K562 cells leads to synergistic losses of TADs and loops.
a, Mean plots showing global H3K27me3 levels around TSS in K562 cells (left) and THP1 cells (right) treated with DMSO or GR for 24 h. b, Immunoblots showing REST and β-actin protein levels in K562 cells following DMSO, GSK343, X5050 or GR treatments for 72 h. Images are representative of three biological replicates. c, Mean plots depicting insulation score around TADs center ± 0.3 Mb in the gained, lost and unchanged TADs in GR vs DMSO condition. d, APA for the unchanged, lost and gained loops in GR vs DMSO condition. Loops aggregated at the center of a 50 kb window at 5 kb resolution. The ratios of signal at the peak signal enrichment (P) to the average signal at the lower left corner of the plot (LL) (P2LL) are indicated to show the normalized intensity of all loops. e,f, Density plots depicting global correlation between the eigenvector value in GSK343 vs DMSO (e) and X5050 vs DMSO conditions (f) at 1 Mb resolution. X-axis represents eigenvector value in the DMSO condition, while Y-axis represents eigenvector value in GSK343 or X5050 treatment conditions at the same locus. g, Pie charts depicting distribution of gained, lost and unchanged ATAC-seq peaks that are common and unique in GR-treated cells (72 h) as compared to DKO cells. N = 2 biologically independent replicates (a,c-g), except n = 3 biologically independent replicates for b. Source data
Extended Data Fig. 9
Extended Data Fig. 9. GR treatment leads to apoptosis and cell cycle arrest through upregulation of super-silencer controlled genes.
a,b, RT-qPCR analysis of the expression of FGF18 (a) and CDKN1A (b) genes in GSK343, X5050 and GR conditions. Results shown as relative fold-change against DMSO control. c, Graph showing top 20 significant KEGG pathways based on DEGs in GR at 72 h versus DMSO RNA-seq. X-axis shows percentage of DEGs in each pathway, while Y-axis shows names of enriched KEGG pathways. Pathways are ranked in order of significance, with the most significant pathway at the top. d, Enrichment plots showing gene sets related to G2/M checkpoint, DNA repair and apoptosis in GR vs DMSO condition. Normalized enrichment score (NES), false recovery rate (FDR) and p value are indicated for each gene set. e, Bar graphs showing ratios of cleaved-PARP (left) and H2AX (right) protein levels normalized to beta-actin protein levels in K562 cells at 72 h following DMSO, GSK343, X5050 or GR treatments. f, Scatter plots of Annexin V (AV) and propidium iodide (PI) staining for K562 cells treated with DMSO, GSK343, X5050 or GR for 72 h. Results shown are representative of three independent experiments. Quadrant 1, necrotic cells AV-/PI + ; Quadrant 2, late apoptotic cells AV + /PI + ; Quadrant 3, early apoptotic cells AV + /PI-; Quadrant 4, living cells AV-/PI-. Quantitative analysis of the percentage of total apoptotic cells (early apoptotic cells and late apoptotic cells) by flow cytometry are shown. Images are representative of three biological replicates. Data shown as mean ± SEM (a,b,e); n = 3 biologically independent replicates (a,b,e,f); two-tailed, unpaired Student’s t-test (a,b,e). P values less than 0.05 or 0.01 are shown as * or **, respectively. Source data
Extended Data Fig. 10
Extended Data Fig. 10. Gradual depletion of CTCF and TOP2A explains the kinetics and amplitude of the loss of TADs and loops caused by GR treatment.
a, Volcano plots depicting the DEGs in K562 cells following GR treatment for 8 h or 24 h. The number of downregulated, stable and upregulated genes is indicated. b, RT-qPCR analysis of expression of CTCF (top) and protein levels of CTCF and REST (bottom) in K562 cells treated with DMSO or GR for the indicated time points. Western blot images are representative of three biological replicates. c, Screenshots of ATAC-seq signal tracks at the promoters and gene body regions of CTCF (top) and TOP2A (bottom) in K562 cells treated with DMSO or GR for 72 h. d, Western blot showing CTCF protein levels in K562 cells transfected with siScramble or siCTCF. Images are representative of three biological replicates. e, Immunoblots showing CTCF and β-actin protein levels in SEM cells either treated with or without IAA for 48 h. Images are representative of three biological replicates. f, Immunoblots showing REST protein levels in two REST knockdown clones (shREST-3 and shREST-4) (left). Immunoblot images are representative of three biological replicates. Bar graph showing percentage of cell viability in REST-depleted K562 cells treated with increasing concentrations of GSK343 (right). g, Bar graphs showing percentage of cell viability in EZH2 knockout HAP1 cells (left) and REST knockout HAP1 cells (right) treated with increasing concentrations of X5050 or GSK343, respectively. Data shown as mean ± SEM (b,f,g); n = 3 biologically independent replicates (b,d,e-g), except n = 2 replicates per condition for a and c; two-tailed, unpaired Student’s t-test (b,f,g). P value less than 0.05, 0.01 or 0.001 shown as *, ** or ***, respectively. Source data

References

    1. Pott, S. & Lieb, J. D. What are super-enhancers? Nat. Genet.47, 8–12 (2015). - PubMed
    1. Whyte, W. A. et al. Master transcription factors and mediator establish super-enhancers at key cell identity genes. Cell153, 307–319 (2013). - PMC - PubMed
    1. Doni Jayavelu, N., Jajodia, A., Mishra, A. & Hawkins, R. D. Candidate silencer elements for the human and mouse genomes. Nat. Commun.11, 1061 (2020). - PMC - PubMed
    1. Ngan, C. Y. et al. Chromatin interaction analyses elucidate the roles of PRC2-bound silencers in mouse development. Nat. Genet.52, 264–272 (2020). - PMC - PubMed
    1. Cai, Y. et al. H3K27me3-rich genomic regions can function as silencers to repress gene expression via chromatin interactions. Nat. Commun.12, 719 (2021). - PMC - PubMed

MeSH terms