. 2024 Oct;21(10):1916-1925.
doi: 10.1038/s41592-024-02411-6. Epub 2024 Sep 20.

A modular chemigenetic calcium indicator for multiplexed in vivo functional imaging

Affiliations

A modular chemigenetic calcium indicator for multiplexed in vivo functional imaging

Helen Farrants et al. Nat Methods. 2024 Oct.

Abstract

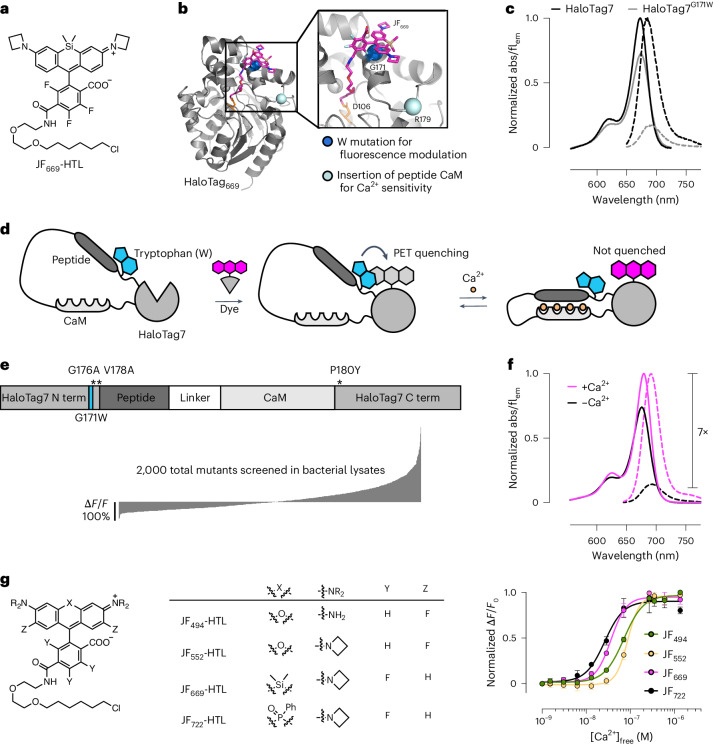
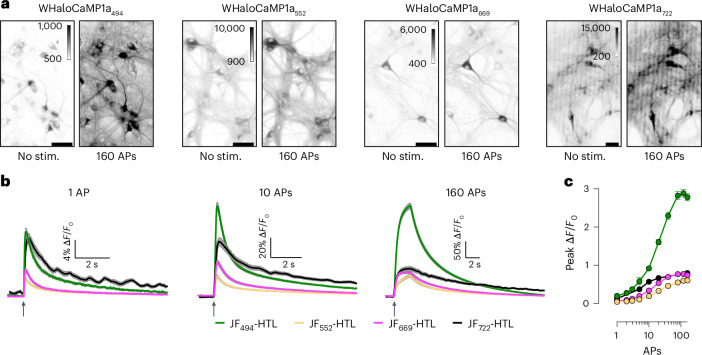
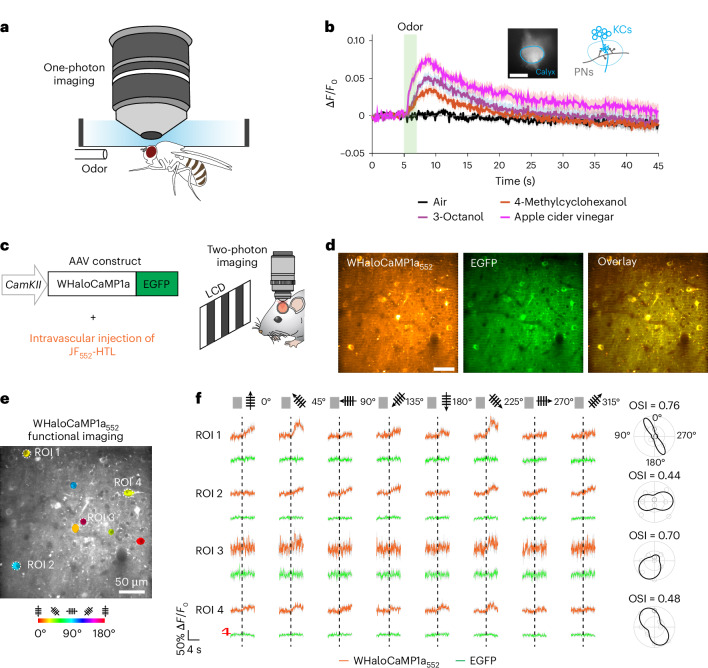
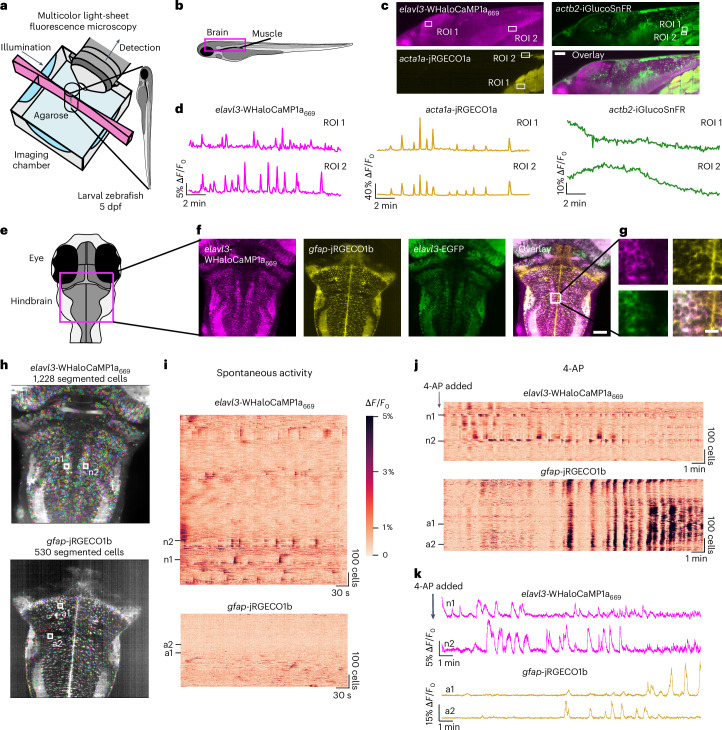
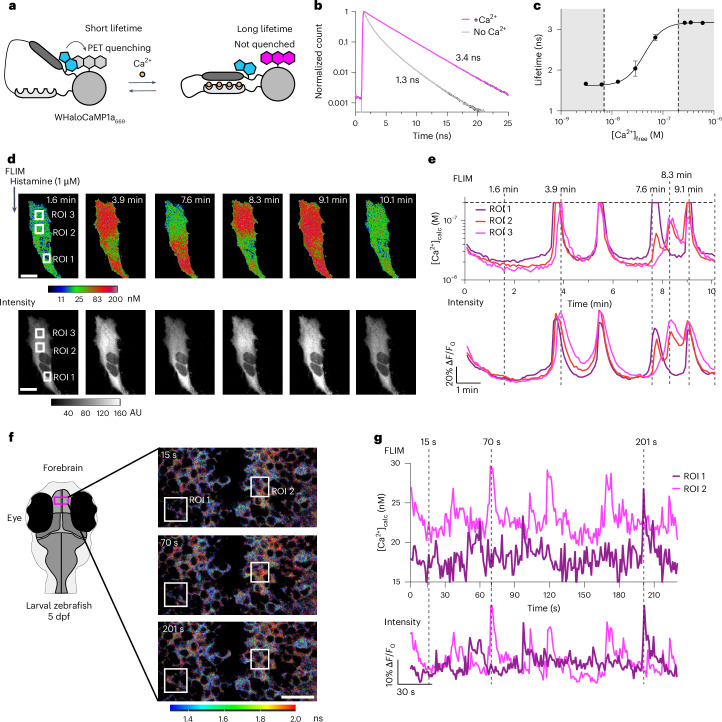
Genetically encoded fluorescent calcium indicators allow cellular-resolution recording of physiology. However, bright, genetically targetable indicators that can be multiplexed with existing tools in vivo are needed for simultaneous imaging of multiple signals. Here we describe WHaloCaMP, a modular chemigenetic calcium indicator built from bright dye-ligands and protein sensor domains. Fluorescence change in WHaloCaMP results from reversible quenching of the bound dye via a strategically placed tryptophan. WHaloCaMP is compatible with rhodamine dye-ligands that fluoresce from green to near-infrared, including several that efficiently label the brain in animals. When bound to a near-infrared dye-ligand, WHaloCaMP shows a 7× increase in fluorescence intensity and a 2.1-ns increase in fluorescence lifetime upon calcium binding. We use WHaloCaMP1a to image Ca2+ responses in vivo in flies and mice, to perform three-color multiplexed functional imaging of hundreds of neurons and astrocytes in zebrafish larvae and to quantify Ca2+ concentration using fluorescence lifetime imaging microscopy (FLIM).


Conflict of interest statement

H.F. and E.R.S. have filed patent applications on tryptophan-containing chemigenetic fluorescent indicators. L.D.L. and J.B.G. have filed patents and patent applications on fluorinated and azetidine-containing rhodamines. The other authors declare no competing interests.

Figures

Fig. 1
Fig. 1. Engineering chemigenetic Ca2+ indicators with tryptophan quenching.
a, Chemical structure of the JF669-HaloTag ligand (HTL). b, Crystal structure of HaloTag7 bound to the JF669-HaloTag ligand (HaloTag669) (PDB 8SW8). The positions of G171, which was mutated to a tryptophan to quench dye fluorescence emission, and R179, where Ca2+-sensitive protein domains were inserted, are highlighted as spheres. c, Normalized absorption (abs; solid lines) and fluorescence emission (flem; dashed lines) spectra of the JF669-HaloTag ligand bound to HaloTag7 or the HaloTag7G171W mutant. d, Schematic representation of WHaloCaMP, showing domain arrangement, covalent binding of the dye-ligand and the quenching tryptophan. e, Primary structure of WHaloCaMP1a (top) and ∆F/F0 values of variants (bottom) from a bacterial lysate screen to select WHaloCaMP1a. Term, terminus. f, Normalized absorption (solid lines) and fluorescence emission (dashed lines) spectra of the JF669-HaloTag ligand bound to purified WHaloCaMP1a in the presence (magenta) and absence (black) of Ca2+. g, Chemical structures of the dye-ligands used here with WHaloCaMP1a (left) and normalized Ca2+ titrations of WHaloCaMP1a bound to these dye-ligands (right). Data points represent mean and s.d. from n = 3 replicates. [Ca2+], Ca2+ concentration.
Fig. 2
Fig. 2. Characterization of WHaloCaMP1a in neuronal cultures.
a, Representative images of cultured rat hippocampal neurons expressing WHaloCaMP1a labeled with dye-ligands unstimulated or stimulated with 160 induced APs. Scale bars, 50 µm. Stim., stimulation. b, The ∆F/F0 response of WHaloCaMP1a expressed in cultured rat hippocampal neurons and labeled with the indicated dye-ligands to trains of APs. Solid line (mean) and gray outline (s.e.m.) for n = 153, 168 and 141 neurons for the JF494-HaloTag ligand, the JF552-HaloTag ligand and the JF669-HaloTag ligand and for n = 20 for the JF722-HaloTag ligand. Black arrows indicate the start of stimulation. c, Peak ∆F/F0 as a function of the number of APs. Data are presented as mean and s.e.m. for n = 153, 168 and 141 neurons for the JF494-HaloTag ligand, the JF552-HaloTag ligand and the JF669-HaloTag ligand and for n = 20 for the JF722-HaloTag ligand. APs were elicited with a field stimulation electrode with a pulse width of 1 ms at 80 Hz and 40 V.
Fig. 3
Fig. 3. WHaloCaMP1a reports on neuronal activity in flies and mice.
a, One-photon imaging setup of head-fixed flies expressing WHaloCaMP1a labeled with dye-ligands. b, Fluorescence responses from WHaloCaMP1a669 in head-fixed flies presented with different odors. WHaloCaMP1a was expressed in mushroom body KCs. Images were acquired from the calyx, where KCs receive dendritic inputs from the olfactory projection neurons (PNs) (insets). Green shading indicates odor presentation for 2 s. Data were from six flies, and odors were presented three times to each fly. The thick line and the shaded areas indicate means and s.e.m. across odor trials. Scale bar, 50 µm. c, AAV construct for transducing neurons in the mouse V1 and the schematic of the experimental setup for two-photon functional imaging of WHaloCaMP1a in the visual cortex of mice. The JF552-HaloTag ligand was intravascularly injected 1 d before examining orientation selectivity of V1 neurons in the anesthetized mouse exposed to moving grafting visual stimuli of different orientations and directions. LCD, liquid crystal display. d, Representative images of a field of view in the mouse V1 showing neurons expressing WHaloCaMP1a552 or EGFP. Scale bar, 50 µm. e, Functional imaging of V1 neurons shows the orientation selectivity map. f, Functional imaging of Ca2+ (WHaloCaMP1a552 channel) or control (EGFP channel) traces (ROI 1–4) in response to drifting gratings in the directions shown above the traces. Average of five trials. Colored lines indicate means, and shadows indicate s.d. Orientation selectivity index (OSI) of cells is shown on the right. Imaging rate was 15 Hz. A representative imaging session from three imaging sessions is shown. The experiment was repeated independently 19 times in four mice with similar results.
Fig. 4
Fig. 4. Three-color multiplexed functional imaging in zebrafish larvae.
a, Light-sheet imaging setup for multiplexed imaging. b, Schematic of side-view zebrafish larvae highlighting the field of view for three-color multiplexed functional imaging of glucose and Ca2+ in muscles and neurons. c, Representative images of WHaloCaMP1a expressed in neurons from the elavl3 promoter, iGlucoSnFR expressed from the actb2 ubiquitous promoter and jRGECO1a expressed in muscle from the acta1a promoter. Scale bar, 50 µm. The experiment was repeated independently three times with similar results. d, Fluorescence ∆F/F0 traces of WHaloCaMP1a669, jRGECO1a and iGlucoSnFR in the ROI outlined in b. A representative experiment from three zebrafish larvae was imaged. e, Schematic of the zebrafish larva’s head indicating the field of view for light-sheet imaging of neuronal and astrocyte activity. f, Representative images of the expression patterns of WHaloCaMP1a669–EGFP expressed under the elavl3 promoter and jRGECO1b expressed under the gfap promoter. Scale bar, 50 µm. The experiment was repeated independently more than three times with similar results. g, Zoomed-in images showing single-cell resolution of fluorescent signals in the hindbrain. Scale bar, 20 µm. h, Images of Suite2p- and Cellpose-segmented cells from simultaneous functional imaging of WHaloCaMP1a669 and jRGECO1b. i, Rastermaps of activity from 1,228 segmented neurons (top) and 530 astrocytes (bottom) during spontaneous brain activity. Two neurons (n1 and n2) indicate the hindbrain oscillator. Two astrocytes (a1 and a1) are also indicated. j, The compound 4-AP was added to the imaging chamber of the zebrafish larva imaged in i, and functional imaging was performed. Concatenation of three imaging blocks of 6.2 min each. k, Fluorescence ∆F/F0 traces of n1 and n2 (top) and a1 and a2 (bottom) after addition of 4-AP.
Fig. 5
Fig. 5. Quantitative Ca2+ measurements by FLIM using WHaloCaMP1a.
a, Schematic of WHaloCaMP1a bound to a dye-ligand used as a FLIM probe. Tryptophan quenching modulates the fluorescence lifetime. b, Normalized fluorescence lifetime of WHaloCaMP1a669 in the presence or the absence of Ca2+, fit to a three-component fluorescence decay. c, Calibration curve of the averaged fluorescence lifetime of WHaloCaMP1a669 versus Ca2+ concentration. The white box indicates the range in which WHaloCaMP1a669 can be used to make quantitative measurements of Ca2+ concentration. Performed with purified protein. Mean of three replicates and s.d. are plotted. d, Pseudocolored concentration (top) and intensity images (bottom) of WHaloCaMP1a669 in HeLa cells after histamine addition. Scale bar, 20 µm. Color bar indicates Ca2+ concentration, calculated from a calibration curve of fluorescence lifetime. AU, arbitrary units. e, Quantitative Ca2+ concentration calculated (calc) from a FLIM calibration curve (top) and fluorescence traces ∆F/F0 calculated from the intensity channel (bottom) in histamine-stimulated HeLa cells in the ROI highlighted in d. Calibrated WHaloCaMP1a669 can only be used to measure Ca2+ concentrations up to 200 nM, indicated by a dashed horizontal line. Vertical dashed lines indicate time points in the time series at which images in d are shown. f, FLIM of WHaloCaMP1a669 in live zebrafish larvae showing spontaneous neuronal activity in the forebrain. The experiment was repeated independently three times with similar results. Schematic indicating the field of view during imaging (left). Overlaid images of FLIM and intensity using Leica LAS X software, with a color bar indicating the fluorescence lifetime. Scale bar, 20 µm. g, Ca2+ concentrations calculated from a FLIM calibration curve (top) and fluorescence traces ∆F/F0 calculated from the intensity channel (bottom) over time for two neurons in the forebrain of zebrafish larvae from the ROI indicated in f. Dashed lines indicate time points of images in f. Representative images from three imaging sessions.
Extended Data Fig. 1
Extended Data Fig. 1. Engineering strategy for WHaloCaMPs.
Engineering of WHaloCaMPs was performed in several consecutive steps. First, insertion sites of Calmodulin (CaM) and a CaM-binding peptide were explored. Insertion sites with high dye capture rate were moved forward to explore rational tryptophan mutations together with insertions. The variants with fastest dye capture rate and any fluorescence modulation upon calcium addition were moved forward to targeted directed evolution through single or double site saturation mutagenesis. After each round, Ca2+ indicator performance was validated in cultured neurons in a field stimulation assay.
Extended Data Fig. 2
Extended Data Fig. 2. Insertion of Ca2+sensing domains into HaloTag7.
1D schematic of the topology of the insertion variants of CaM and CaM-binding peptide into HaloTag7 in comparison to HaloCaMP. The crystal structure of HaloTag7 bound to JF669-HaloTag ligand is shown, highlighting the insertion positions. Bottom two tables report the measured dye capture rate with JF549-HaloTag ligand and the indicated protein. The insertion position (R179) which led to WHaloCaMP1a is highlighted in magenta.
Extended Data Fig. 3
Extended Data Fig. 3. Tryptophan placements for WHaloCaMP development.
1D schematic of the topology of insertion variants of CaM and CaM-binding peptide into HaloTag7 (top left). Tryptophan positions are annotated with a blue star. The crystal structure of HaloTag7 bound to JF669-HaloTag ligand is shown, highlighting the insertion positions and tryptophan placements (top right). Bottom tables show the measured dye capture rate with JF549-HaloTag ligand and the indicated protein, and any change in fluorescence emission ΔF/F0 with JF669-HaloTag ligand. The insertion position (R179), and the tryptophan placement (G171W) which led to WHaloCaMP1a is highlighted in magenta.
Extended Data Fig. 4
Extended Data Fig. 4. Design of WHaloCaMP1a.
1D schematic of the topology (top left) of the insertion variants of CaM and CaM-binding peptide into HaloTag7 with tryptophan position and highlighted residues on the crystal structure of HaloTag669 (top right). Tables report top hits from sequential mutagenic library screens. First, sites close to the dye binding site were chosen for single site saturation. Double site saturation was then performed on the top two sites from the first round of screening. A third round of single site saturation on top of the be best performing variant was then performed with sites close to the dye binding site. After each round, dye capture rates of top hits were measured by fluorescence polarization using JF549-HaloTag ligand and a calcium endpoint assay measured to validate fluorescence modulation by calcium using JF669-HaloTag ligand. WHaloCaMP1a is highlighted in magenta.
Extended Data Fig. 5
Extended Data Fig. 5. Reduced Ca2+ affinity of WHaloCaMP by mutations.
a, Previously described mutations in the CaM-binding peptide were mapped onto WHaloCaMP1a. b, Ca2+ titrations of MLCK peptide variants (top) and values extracted from curve fits (bottom table). Titrations are plotted as the mean and s.d. of two technical replicates. c, Fluorescence trace (black) from WHaloCaMP1a669-V12T in primary neuron culture with field stimulation. Grey trace is s.e.m. F0 was calculated 1 s before the first field stimulus. WHaloCaMP1a669-V12T showed faster fluorescence decay in neurons compared to WHaloCaMP1a, but lower ∆F/F0 response at single AP, therefore WHaloCaMP1a669 was used for in vivo demonstrations.
Extended Data Fig. 6
Extended Data Fig. 6. Peptide swap in WHaloCaMP1a for faster Ca2+ kinetics.
a, The MLCK peptide used in WHaloCaMP1a (top) was replaced with the ENOSP-peptide used in jGCaMP8 series (bottom). Two rounds of directed evolution were performed on the new scaffold: the first round was a double site saturation of sites important in the evolution of WHaloCaMP1a; the second was single site saturation on top of the top hit from the first round, which gave a variant (V178I, P180T, G176A) with fast dye capture rate, lower Ca2+ affinity (b.) titrations is plotted as the mean and s.d. of three technical replicates, and fast Ca2+ kinetics measured by stopped flow (c.). d, A representative fluorescence trace from a field stimulation (black) from one run of the field stimulation assay with ~40 neuron ROIs. Grey trace is standard error of the mean (s.e.m.) of the fluorescence trace. F0 was calculated 1 s before the first field stimulus. Table reports fits from experiments in panels b. Even though the ENOSP variant had faster Ca2+ kinetics in neurons, it had lower ∆F/F0 response at single AP, therefore WHaloCaMP1a669 was used for in vivo demonstrations.
Extended Data Fig. 7
Extended Data Fig. 7. Design and characterization of WHaloCaMP1b.
a, The MLCK CaM-binding peptide and CaM were inserted at HaloTag T154, deleting T155 and D156. One round of single site saturation mutagenesis produced hits with improved calcium response (G158D). Further rounds of directed evolution did not give better variants. b, Crystal structure of HaloTag7669 highlighting relevant positions. c, ∆F/F0 vs. [Ca2+] of WHaloCaMP1b669. Titrations is plotted as the mean and s.d. of three technical replicates. d, Stopped-flow Ca2+ kinetics of unbinding for WHaloCaMP1b669. e, Representative trace (black) from one run of the field stimulation assay with ~40 neuron ROIs. Grey trace is standard error of the mean (s.e.m.) of the fluorescence trace. F0 was calculated 1 s before the first field stimulus. The table reports fits from experiments in panels c.
Extended Data Fig. 8
Extended Data Fig. 8. Absorption and fluorescence spectra for WHaloCaMP1a.
WHaloCaMP1a bound to JF494-HaloTag ligand, JF552-HaloTag ligand, JF669-HaloTag ligand and JF722-HaloTag ligand. Absorption (a). and fluorescence excitation and emission spectra (b.). Spectra were normalized to max absorbance or flourescence exitation or emission in the Ca2+ state.
Extended Data Fig. 9
Extended Data Fig. 9. Volumetric whole brain imaging of neurons in zebrafish larvae using SiMView.
Tg(elavl3:NES-WHaloCaMP1a-EGFP) zebrafish were labeled with JF669-HaloTag ligand and mounted in a SiMView light sheet microscope. Three-dimensional volumes of the brain with a 160 µm length along the z-axis were acquired with a z-step size of 4 µm and a rate of 4 volumes per second. Visualization of ∆F/F0 (shown using a red-hot color look-up table) displayed over a projection of the concatenated projected ∆F/F0 time series that serves as an anatomical reference (shown in grey). Time stamps are in min:s and scale bar is 100 µm. A movie of this whole brain time-lapse image data set can be found in Supplementary Movie 1.
Extended Data Fig. 10
Extended Data Fig. 10. Fluorescence lifetimes of WHaloCaMP1a and iGECI.
Fluorescence lifetime image microscopy (FLIM) with WHaloCaMP1a bound to JF494-HaloTag ligand, JF552-HaloTag ligand, JF669-HaloTag ligand or JF722-HaloTag ligand, and iGECI. A time domain FLIM set-up was used at 40 MHz. The lifetime decay was fit to a three-component fit for WHaloCaMP1a. A two component fit was performed for iGECI. No additional biiverdin was added to the iGECI sample before imaging. The amplitude weighted lifetime is reported. Mean and standard deviation from three replicates from at least two different samples.

Update of

References

    1. Kim, T. H. & Schnitzer, M. J. Fluorescence imaging of large-scale neural ensemble dynamics. Cell185, 9–41 (2022). - PMC - PubMed
    1. O’Banion, C. P. & Yasuda, R. Fluorescent sensors for neuronal signaling. Curr. Opin. Neurobiol.63, 31–41 (2020). - PubMed
    1. Sabatini, B. L. & Tian, L. Imaging neurotransmitter and neuromodulator dynamics in vivo with genetically encoded indicators. Neuron108, 17–32 (2020). - PubMed
    1. Liu, P., Mu, X., Zhang, X.-D. & Ming, D. The near-infrared-II fluorophores and advanced microscopy technologies development and application in bioimaging. Bioconjug.Chem.31, 260–275 (2020). - PubMed
    1. Farrants, H. & Tebo, A. G. Fluorescent chemigenetic actuators and indicators for use in living animals. Curr. Opin. Pharmacol.62, 159–167 (2022). - PubMed

LinkOut - more resources