. 2024 Oct;5(10):1534-1556.
doi: 10.1038/s43018-024-00828-8. Epub 2024 Sep 20.

Spatial analysis reveals targetable macrophage-mediated mechanisms of immune evasion in hepatocellular carcinoma minimal residual disease

Affiliations

Spatial analysis reveals targetable macrophage-mediated mechanisms of immune evasion in hepatocellular carcinoma minimal residual disease

Lea Lemaitre et al. Nat Cancer. 2024 Oct.

Abstract

Hepatocellular carcinoma (HCC) frequently recurs from minimal residual disease (MRD), which persists after therapy. Here, we identified mechanisms of persistence of residual tumor cells using post-chemoembolization human HCC (n = 108 patients, 1.07 million cells) and a transgenic mouse model of MRD. Through single-cell high-plex cytometric imaging, we identified a spatial neighborhood within which PD-L1 + M2-like macrophages interact with stem-like tumor cells, correlating with CD8+ T cell exhaustion and poor survival. Further, through spatial transcriptomics of residual HCC, we showed that macrophage-derived TGFβ1 mediates the persistence of stem-like tumor cells. Last, we demonstrate that combined blockade of Pdl1 and Tgfβ excluded immunosuppressive macrophages, recruited activated CD8+ T cells and eliminated residual stem-like tumor cells in two mouse models: a transgenic model of MRD and a syngeneic orthotopic model of doxorubicin-resistant HCC. Thus, our spatial analyses reveal that PD-L1+ macrophages sustain MRD by activating the TGFβ pathway in stem-like cancer cells and targeting this interaction may prevent HCC recurrence from MRD.


Conflict of interest statement

Competing interests

A.T.M., A.E.T., R.P. and H.B.D. are employees of Enable Medicine. All other authors declare no competing interests.

Figures
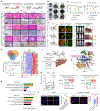
Extended Data Fig. 1 |
Extended Data Fig. 1 |. Identification, validation and relative proportion of major cell types using CODEX.
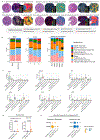
a. UMAP representation of 12 major cell subtypes identified by CODEX analysis of human HCC. b. Comparison of normalized expression patterns of stemness markers (EPCAM, CK19, CD44), survival markers (Ki67, BCL2), and mesenchymal markers (vimentin, podoplanin) between stem-like and non-stem-like tumor cell types identified by CODEX analysis of human HCCs (Tumor cell EpCAM+ n= 26622 cells, Tumor cell CK19+ n= 34436 cells, Tumor cell CK+ n= 433,918 cells). c. Comparison of normalized expression patterns of macrophage markers between three macrophage subsets identified by CODEX analysis of human HCCs (Macro 206+ n=45628 cells; Macro HLA-DR+ n=55558 cells; Macro PD-L1+ n=53713 cells). Box: 25–75 percentile, whiskers: 5–95 percentile, line: median. d. Stacked bar chart comparing relative proportions of all 20 immune and tumor cell subtypes identified by CODEX between self-reported sex (female n=35 patients, male n=73 patients), HCC etiologies (NASH n=28 patients, ALD n=11 patients, HepC n=35 patients, and HepB n=21 patients), AJCC Stage (I n=58 vs II-III n=50 patients), and grade (1 n=40, 2 n=57, and 3 n=9 patients). e. CODEX image representations comparing exhausted CD8+ T cells, endothelial cell, and neutrophil presence in NASH HCC compared to HCV-HCC. f. Boxplot comparisons of the proportions of exhausted CD8+ T cells, endothelial cells, and neutrophils in NASH HCC (n=28) vs non-NASH HCC (n=80). Box: 25–75 percentile, whiskers: 5–95 percentile, line: median. Two-tailed unpaired t-test was used to compare the groups. Abbreviations: UMAP- uniform manifold approximation and projection for dimension reduction, CODEX- co-detection by indexing, HCC- hepatocellular carcinoma, CD- cluster of differentiation, CK- cytokeratin, EPCAM- epithelial cell adhesion molecule, BCL2- B cell lymphoma 2, NASH-nonalcoholic steatohepatitis, ALD- alcoholic liver disease, HepC- hepatitis C, HCV- hepatitis C virus, HepB- hepatitis B, HLA-DR - major histocompatibility complex II cell surface receptor, PDL1- programmed cell death ligand 1, DAPI-4’,6-diamidino-2-phenylindole, PanCK- pan cytokeratin.
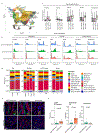
Extended Data Fig. 2 |
Extended Data Fig. 2 |. Comparison of immune cell distribution in residual HCC.
a. Stacked Bar graph containing relatively similar proportions of immune cell populations in HCC as reported by CODEX analysis in this study, the Cancer Genome Atlas Project, the ICGC project and a single cell RNA sequencing research study PMID 35355983. b. Boxplot comparisons and Voronoi plot of representative cores of NK cell proportions in primary (n=53 patients) vs residual HCCs (n=55 patients). Box: 25–75 percentile, whiskers: 5–95 percentile, line: median. Two-tailed unpaired t-test was used to compare the groups. c. Boxplot comparisons and Voronoi plot of representative cores of neutrophil proportions in primary (n=53 patients) vs residual HCCs (n=55 patients). Box: 25–75 percentile, whiskers: 5–95 percentile, line: median. Two-tailed unpaired t-test was used to compare the groups. d. Volcano plot showing key tumor and immune cell populations (with statistical significance) in primary vs residual HCCs in the subgroup of HCCs arising in the cirrhotic liver (n=96 patients). Two-tailed unpaired t-test was used to compare the groups. e. Boxplot comparisons of PDL1+ macrophages and exhausted CD8 T cells between peritumoral TACE-exposed cirrhotic livers (n=3 patients), primary (n=53 patients) vs residual HCCs (n=55 patients). Box: 25–75 percentile, whiskers: 5–95 percentile, line: median. Two-tailed unpaired t-test was used to compare the groups. f. Boxplot comparisons of PDL1+ macrophages and exhausted CD8 T cells between primary (n=53 patients), residual HCC- not refractory to TACE (n=21 patients) vs residual HCC refractory to TACE (n=24 patients). Box: 25–75 percentile, whiskers: 5–95 percentile, line: median. Two-tailed unpaired t-test was used to compare the groups. g. Stacked bar chart comparing relative proportions of all 20 immune and tumor cell subtypes identified by CODEX between primary (n=53 patients), residual HCC- not refractory to TACE (n=21 patients) vs residual HCC refractory to TACE (n=24 patients). h. H&E and Immunofluorescence for PDL1+ macrophages in hepatic tissue with complete response to TACE (n=5 patients) compared to residual HCC (n=5 patients). Bar plots compare the proportion of PDL1+ cells between the two groups. Data are presented as mean values +/− SEM. Two-tailed unpaired t-test was used to compare the groups. i. Stacked bar chart comparing relative proportions of all 20 immune and tumor cell subtypes identified by CODEX between conventional TACE (cTACE, n=6 patients) and doxorubicin-eluting beads TACE (DEB-TACE, n=49 patients). Abbreviations: HCC- hepatocellular carcinoma, CODEX- co-detection by indexing, RNA-Ribonucleic acid, NK- natural killer, CD- cluster of differentiation, PDL1- programmed cell death ligand 1, TACE-transarterial chemoembolization, H&E-hematoxylin and eosin, cTACE- conventional transarterial chemoembolization, DEB-TACE- doxorubicin-eluting beads transarterial chemoembolization.
Extended Data Fig. 3 |
Extended Data Fig. 3 |. Interactions of tumor and immune cells in residual HCC.
a. Heatmap showing different patterns of direct interactions between the four tumor cell subtypes in primary (n=53 patients) vs residual HCC (n=55 patients). Two-tailed unpaired t-test was used to compare the groups. * Indicates pAdj value<0.05. b. Dot plot showing mean frequency of interaction between tumor cell subtypes and PDL1+ macrophages in primary and residual HCC stratified by median frequency of PDL1+ macrophages in tumor. Two-tailed unpaired t-test was used to compare the groups. * Indicates pAdj value<0.05. c. Kaplan Meir curve showing survival analysis of human HCC TCGA cohort (n=372 patients) classified based on expression of genes related to M2-like macrophages and cancer stem cells. Log rank test used. d. IF analysis of human HCC cell lines Huh7 co-cultured in 3D tumoroids with THP1 macrophages polarized to M1-like (n=6 tumoroids) or M2-like (n=8 tumoroids) macrophages. Two-tailed unpaired t-test was used to compare the groups. Bar plot shows quantification of CK19 expression on the 3D tumoroids. Data are presented as mean values +/− SEM. e. Heatmap of direct interactions between immune cells identified by CODEX in primary (n=53 patients) and residual HCC (n=55 patients). f. Large neighborhood sizes demonstrate reduced, but still significant spatial autocorrelation for Ki67 and BCL2 markers. Spatial autocorrelation is calculated using Geary’s C statistic. The spatial autocorrelation for each marker is calculated independently for all tumor regions (n=1.07 million cells) and reported as C’ = 1 - C. The maximal spatial autocorrelation possible is 1. Box: 25–75 percentile, whiskers: 5–95 percentile, line: median. g. Alluvial plot of statistically significant indirect tumor cell subtype-immune cell interactions in primary (n=53 patients) vs residual HCCs (n=55 patients). h. Heatmap showing different patterns of indirect (25-100um) interactions of tumor cell subtypes with immune cells in primary (n=53 patients) vs residual HCC (n=55 patients). Two-tailed unpaired t-test was used to compare the groups. * Indicates pAdj value<0.05. Abbreviations: HCC- hepatocellular carcinoma, PDL1- programmed cell death ligand 1, TCGA- the cancer genome atlas project, M2- Type 2 Macrophage, IF- Immunofluorescence, 3D- 3 Dimensional, THP1- , M1- Type 1 Macrophage, CK- cytokeratin, CODEX- co-detection by indexing, CD- cluster of differentiation, EPCAM- epithelial cell adhesion molecule, HLA-DR - major histocompatibility complex II cell surface receptor, NK- natural killer, Eff- Effector, Exh- Exhausted, Mem- Memory, DC- Dendritic cell, EC-, Macro- Macrophage, CSC- Cancer Stem cell, Mac- Macrophage, BCL2- B cell lymphoma 2.
Extended Data Fig. 4 |
Extended Data Fig. 4 |. Cellular neighborhood analysis of residual HCC.
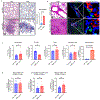
a. Cross-matching of Voronoi plots showing spatial neighborhoods and the associated H&E and CODEX immunofluorescence staining images representations of the same tumor core. The canonical markers of key cells represented in each neighborhood are shown. b. Stacked bar chart comparing relative proportions of all 9 cellular neighborhoods identified by CODEX by HCC AJCC Stage (I n=58 vs II-III n=50 patients), grade (1 n=40, 2 n=57, and 3 n=9 patients), and etiologies (NASH n=28 patients, ALD n=11 patients, HepC n=35 patients, and HepB n=21 patients). c. Boxplot comparisons of CK19, EpCAM, CD3, aSMA, CD15, and CD68 expression amongst the identified cellular neighborhoods (CK19+Tumor CN=33708 cells, EpCAM+ Tumor CN=28190, Fibroinflammatory immune CN= 140,273, Innate immune CN= 53,912, M2- macrophage Immune CN= 188,407, Other= 6,130, T cell Immune CN=51,987, Pauci-immune tumor CN=310,977, Vascular inflammatory Tumor CN=251,581). Box: 25–75 percentile, whiskers: 5–95 percentile, line: median. d. Comparison of proportion of EpCAM+ tumor cells and exhausted CD8 T cells in residual HCC stratified by median frequency of M2-macrophage CN (Low n=17; High n=38 patients). e. Comparison of specific canonical marker expression on macrophage and T cells in the EpCAM+ tumor CN (macrophages n=272 cells, T cells n=13 cells), CK19+ tumor CN (macrophages n=1201 cells, T cells n=354 cells) compared to vascular inflammatory tumor CN (macrophages n=16143 cells, T cells n=1275 cells) in residual HCC. Abbreviations: H&E-hematoxylin and eosin, HCC- hepatocellular carcinoma, CODEX- co-detection by indexing, NASH-nonalcoholic steatohepatitis, ALD- alcoholic liver disease, HepC- hepatitis C, HepB- hepatitis B, CK- cytokeratin, CD- cluster of differentiation, EPCAM- epithelial cell adhesion molecule, aSMA- alpha smooth muscle actin, CN- Cellular neighborhood, PD1- programmed cell death protein 1, TIM3- T cell immunoglobulin and mucin domain-containing protein 3, Macro- macrophages, DAPI-4’,6-diamidino-2-phenylindole, PanCK- Pan-cytokeratin, ECad- E cadherin.
Extended Data Fig. 5 |
Extended Data Fig. 5 |. Pathway analysis of Residual tumor cells and Macrophages.
a. Characterizing the HCC cancer cell clusters C0 cluster between doxorubicin-resistant (DoxR) (n=4320 cells) and control samples (n=3627 cells). Gene set expression analysis shows enrichment of HCC progenitor signature and doxorubicin resistance signature in the cancer cells of the DoxR samples. b. Dot plot shows mean expression of key differentially expressed genes in C0 and C5 clusters between control (C0 n=3627 cells; C5 n=161 cells) and DoxR (C0 n=4320 cells; C5 n=57 cells) samples. c. Flow cytometry of monocyte-derived macrophages (MoM) from HCC peripheral blood mononuclear cells (PBMCs) were cultured for 48 hours with conditioned media from patient-derived organoid (PDO) which were either treated with doxorubicin (MoM+ DoxoR PDO CM; n=11,753 cells) or control (MoM+ ctrl PDO CM; n=2089 cells), d. Flow cytometry of monocyte-derived macrophages (MoM) from HCC peripheral blood mononuclear cells (PBMCs) were treated with doxorubicin-containing media (MoM+Doxorubicin, n=7559 cells) or doxorubicin-free control media (MoM+ctrl media, n=15,546 cells). This experiment was repeated using MoM from patients with HCC which were then treated with doxorubicin (n=3 patients) or control (n=3 patients). Two-tailed unpaired t-test used to compare the proportion of PDL1+ MoM on flow cytometry. e. Recurrence-free survival predicted by the macrophage and tumor cell signatures derived from the spatial transcriptomic analysis. Kaplan Meir analysis with log rank test was performed (n=372 patients, unique biological samples). f. TGFBR1/2 pathway displayed as an upstream regulator of the network of transcriptional changes in the tumor cell AOI and the corresponding ligand TGFB1 in the macrophage AOI of residual HCC. Upstream analysis in Ingenuity Pathway Analysis was performed using a two-tailed Fisher’s Exact Test to identify likely upstream regulators based on differential gene expression data. Abbreviations: HCC- hepatocellular carcinoma; DoxR- Doxorubicin-Resistant; PDO- Patient-derived organoid; CM- Conditioned media; Ctrl- Control; MoM- Monocyte-derived macrophage; PBMCs- Peripheral blood mononuclear cells, PDL1- programmed cell death ligand 1, TGFB1 transforming growth factor beta 1; Res- Residual; Tum- Tumor; HR- hazard ratio. AOI- Area of interest.
Extended Data Fig. 6 |
Extended Data Fig. 6 |. Translational relevance of MRD model of MYC-HCC and MT-HCC.
a. Representative H&E images and IHC for HCC-specific proteins glutamine synthetase, HNF4A and stem cell marker CK19. This was performed on multiple tumor samples (MYC-HCC=5, MT-HCC=5 mice). b. Expression of HCC-specific genes in primary (MYC-HCC=5, MT-HCC=5 mice) compared to WT FVB mouse liver (n=2 mice). Data are presented as mean values +/− SEM. c. Heatmap shows similarity between MYC-HCC=5, MT-HCC=5 and five human HCC transcriptome datasets including the TCGA cohort; the top 5 upregulated and downregulated genes across the different datasets are shown d. Representative H&E and IHC images showing phospho histone 3 (pH3) and cleaved caspase 3 (cC3) staining in primary HCC, minimal residual disease (MRD), and recurrent HCC in MYC-HCC and MYC-Twist1 HCC livers. Bar plots comparing quantification of phospho histone 3, and cleaved caspase 3, in primary tumors, MRD, and recurrent tumors in the liver of MYC-HCC. This was repeated n=5 mice in each group. Data are presented as mean values +/− SEM. e. Experimental scheme to induce NASH in MT-HCC. Gross liver images, H&E, and trichrome staining demonstrating induction of NASH, fibrosis, and HCC in this model. Experiments were performed on 3–5 animals in each group. f. Confirming induction of NASH by demonstrating hepatic inflammation, obesity, hyperlipidemia with high-fat diet (HFD) (c1 chow=5, HFD=3; c2-5 chow=4; HFD=4 mice). Data are presented as mean values +/− SEM. Two-sided unpaired t-tests were used for comparison. g. Confirming reversible residual HCC upon oncogene inactivation in MT-HCC with diet-induced NASH. Experiments were performed on 5 mice on HFD diet. h. Representative H&E and IHC images showing persistence of CD133+ stem-like cancer cells in perivascular niches of oncogene inactivated MRD in the liver, lungs and subcutaneous spaces. Experiments were performed on 5 mice in each group. i. Representative H&E and IHC images showing persistence of CK19+ stem-like cancer cells in perivascular niches of MRD in the subcutaneous spaces. Bar plots comparing quantification of CK19 and CD133 in primary tumors, MRD, and recurrent tumors in the liver of MYC-HCC. Experiments were performed on 5 mice in each group. Data are presented as mean values +/− SEM Abbreviations: H&E-hematoxylin and eosin, IHC- Immunohistochemistry, HCC- hepatocellular carcinoma, HNF4A- Hepatocyte nuclear factor-4 alpha, CK- cytokeratin, MYC- HCC- MYC-driven hepatocellular carcinoma, MT-HCC- MYC/Twist hepatocellular carcinoma, WT FVB- wild-type FVB, TCGA- the cancer genome atlas project, pH3- phospho histone 3, cC3- cleaved caspase 3, MRD- Minimal residual disease, NASH Nonalcoholic steatohepatitis, HFD- High-fat diet, ALT-Alanine aminotransferase, LDL- Low density lipoprotein, CD- cluster of differentiation.
Extended Data Fig. 7 |
Extended Data Fig. 7 |. Residual tumor cells demonstrate stemness and activation of Tgfβ pathway.
a. Experimental scheme for single cell sequencing on MYC inactivation residual tumor cells (n=4367 cells). b. Two major clusters upon MYC inactivation, stem cell-like cluster (n=1184 cells) and non-stem-like cluster (n=3183 cells). c. Heatmap shows differentially expressed genes between the stem cell-like cluster and non-stem-like clusters. d. Activation of Tgfβ1 pathway in the stem cell-like cluster of residual tumor cells. e. Top molecular pathways activated in the stem cell-like cluster. Abbreviations: TGFB1 transforming growth factor beta 1, HCC- hepatocellular carcinoma, scRNA-seq-single cell RNA sequencing.
Extended Data Fig. 8 |
Extended Data Fig. 8 |. Interaction of stem-like cancer cells and macrophages in MRD.
a. Comparison of macrophages in the spatial proximity of MRD (n=6 mice) versus areas without MRD (n=6 mice) in the lungs of MYC/Twist1 mice. Data are presented as mean values +/− SEM. b. Representative images demonstrating spatial interactions of stem-like cancer cells and macrophages in the spatial proximity of MRD in the lungs and liver of MYC/Twist1 mice. c. Comparison of immune cell subsets between livers without MRD ctrl Liver (n=4 mice) and livers with MRD (n=4 mice). Bar plots compared using two-tailed unpaired t-tests. Data are presented as mean values +/− SEM. d. Comparison of CD8 T cell subsets between livers without MRD ctrl Liver (n=4 mice) and livers with MRD (n=4 mice). Bar plots compared using two-tailed unpaired t-tests. Data are presented as mean values +/− SEM. Abbreviations: MRD- Minimal residual disease, ctrl- control, CD- cluster of differentiation, H&E-hematoxylin and eosin, DAPI-4’,6-diamidino-2-phenylindole, HCC- hepatocellular carcinoma.
Extended Data Fig. 9 |
Extended Data Fig. 9 |. Combined blockade of Tgfβr1 and Pdl1 in mouse MRD HCC.
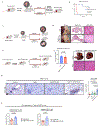
a. Experimental scheme for treatment of oncogene-deprived subcutaneous MRD-bearing mice with control antibody or combination therapy with Tgfbr1 and Pdl1 inhibitors. Treatment is followed by oncogene reactivation to induce tumor recurrence. Kaplan–Meier analysis with log rank test was performed. b. Kaplan–Meier curves show time to recurrence in oncogene-deprived subcutaneous MRD-bearing mice with control antibody (n=4 mice) or combination therapy with Tgfbr1 and Pdl1 inhibitors (n=5 mice). c. Experimental scheme for treatment of oncogene-deprived subcutaneous MRD-bearing mice with control antibody or combination therapy with TgfbrI and anti-Pdl1 inhibitor. Residual tumor niches are then evaluated at the end of treatment. d. Macroscopic and microscopic evaluation of subcutaneous MRD sites shows elimination of residual tumor cells in mice treated with combination therapy with TgfbrI and Pdl1 inhibitors (n=4 mice) than control (n=4 mice). e. Experimental scheme for treatment of oncogene-activated primary MT-HCC with control antibody or combination therapy with TgfbrI and anti-Pdl1 inhibitor. Liver tumor burden is assessed at the end of treatment. f. Quantification of liver tumor burden, gross images, and H&E images of primary MT-HCC treated with control antibody (n=4 mice) or combination therapy with TgfbrI and anti-Pdl1 inhibitor (n=4 mice). Data are presented as mean values +/− SEM. Two-tailed unpaired t-test was used to compare the groups. g. Apoptosis measured by cleaved caspase 3+ cells in liver MRD of MYC-HCC mice treated with control (n=5 mice) versus Tgfbr1 (n=5 mice) or Pdl1 inhibitors (n=5 mice) or combination therapy with Tgfbr1 and Pdl1 inhibitors (n=5 mice). Data are presented as mean values +/− SEM. Two-tailed unpaired t-test was used to compare the groups. h. Flow cytometry quantification of activated CD4 and CD8 T cells which are CD69+/CD44high in MRD of mice treated with control antibody (n=3 mice) or combination therapy with Tgfbr1 and Pdl1 inhibitors (n=3 mice). Bar plots compare the mean between the groups with unpaired t-tests. Data are presented as mean values +/− SEM. Two-tailed unpaired t-test was used to compare the groups. Abbreviations: HCC- hepatocellular carcinoma, PDL1- programmed cell death ligand 1, TGFBr1 transforming growth factor receptor beta 1, H&E-hematoxylin and eosin, Ctrl- control, MRD- Minimal residual disease, MT-HCC- MYC/Twist hepatocellular carcinoma, CD- cluster of differentiation.
Extended Data Fig. 10 |
Extended Data Fig. 10 |. Combined blockade of Tgfβr1 and Pdl1 eliminates doxorubicin-resistant mouse HCC.
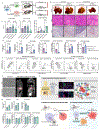
a. Schematic showing the establishment of mouse model of control (n=5 mice) or doxorubicin-resistant syngeneic orthotopic allografts (n=11 mice) which were then treated with control antibody (n=6 mice) or combination therapy with TgfbrI and anti-Pdl1 inhibitor (n=10 mice). b.Representative gross images, H&E and IHC images of control or doxorubicin-resistant orthotopic HCC-bearing mice treated with control antibody (n=6 mice) or combination therapy with TgfbrI and anti-Pdl1 inhibitor (n=10 mice). IHC for CD8 T cells shows in the bottom panel. c. Quantification of tumor burden and CD8T cells in the liver of control or doxorubicin-resistant orthotopic HCC-bearing mice treated with control antibody (n=6 mice) or combination therapy with TgfbrI and anti-Pdl1 inhibitor (n=10 mice). Bar plots compare the mean between the groups with two-sided unpaired t-tests. Data are presented as mean values +/− SEM. d. Flow cytometry-based quantification of tumor-infiltrating leukocytes, T cells, M2-like (PDL1+ or CD206+) and M1-like macrophage (CD86+ or MHCII+) subsets in doxorubicin-resistant orthotopic HCC-bearing mice treated with control antibody (n=4 mice) or combination therapy with TgfbrI and anti-Pdl1 inhibitor (n=4 mice). Bar plots compare the mean between the groups two-sided with unpaired t-tests. Data are presented as mean values +/− SEM. e. Representative flow cytometry images and quantification of M1-like and M2-like macrophages within the tumor in the doxorubicin-resistant orthotopic HCC-bearing mice treated with control antibody or combination therapy with TgfbrI and anti-Pdl1 inhibitor. f. Hep 53.4 HCC cell lines are treated with control or doxorubicin for 96 hours and viable cells are selected for orthotopic implantation into mouse liver, confirmed by MRI. g. Flow cytometry analysis shows no difference in leukocyte or T cell or macrophage infiltration in WT mice bearing control HCC treated with either control antibody (n=2 mice) of combined inhibition of Tgfbr1 and anti-Pdl1 antibody (n=3 mice). Data are presented as mean values +/− SEM. h. Schematic summarizing the main findings- i. The spatial organization of post-TACE residual HCC is unveiled through integrated analysis of single-cell spatial profiling employing CODEX and GeoMx spatial transcriptomics of human HCC. ii. Mouse model of minimal residual disease (MRD) reveals that TGFβ1 derived from PDL1+ macrophages enable the persistence of residual stem-like tumor cells and induces exhaustion in CD8T cells. iii. In two mouse models of MRD, we target the TGFβ pathway and PDL1, eliminating residual tumor cells and preventing HCC recurrence. Abbreviations: HCC- hepatocellular carcinoma, Tgfb -transforming growth factor beta, H&E-hematoxylin and eosin, Ctrl-control, Res-residual, MRD- Minimal residual disease, DoxR- doxorubicin-resistant.
Fig. 1 |
Fig. 1 |. Single-cell spatial atlas of the tumor immune microenvironment in HCC.
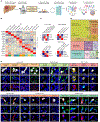
a, Single-cell spatial analysis workflow of human HCC tumor cores using CODEX to determine cell frequency, cell–cell interactions and neighborhoods. b, Heatmap dendrogram of unsupervised clustering using canonical marker expression to define major tumor and immune cell subsets. Heatmap scaled by column. c, Subclassification of tumor cells, macrophages and T cells using cell-specific canonical markers. Heatmap is scaled by row. d, Graphical representation of the 20 cell types and subtypes with their absolute cell counts and proportions in the CODEX dataset: tumor cells (tumor cell CK+ n = 433,918 cells (40.73%), tumor cell CK19+ n = 34,436 (3.23%), tumor cell EpCAM+ n = 26,622 (2.50%), tumor cell PD-L1+ n = 19,737 (1.85%)); macrophages (macro CD206+ n = 45,628 (4.28%), macro HLA-DR+ n = 55,558 (5.22%), macro PD-L1+ n = 53,713 (5.04%)); T cells (CD4+ T cell n = 44,396 (4.17%), CD8+ T cell Eff n = 4,366 (0.41%), CD8+ T cell Exh n = 9,539 (0.90%), CD8+ T cell mem n = 3,742 (0.35%), Treg n = 23,280 (2.19%)); B cell n = 29,155 (2.74%), DC n = 5,769 (0.54%); mast cell n = 7,389 (0.69%); monocyte n = 1,490 (0.14%); NK cell n = 13,812 (1.30%); neutrophil n = 55,927 (5.25%); endothelial cell n = 45,618 (4.28%); fibroblast n = 151,189 (14.19%). e, CODEX imaging representations of the canonical markers used to verify the validity of the unsupervised clustering for each cell type. The cell type (white filling) is overlaid on the immunostained images. abs, antibodies; PanCK, pan cytokeratin; CK19, cytokeratin 19; CD, cluster of differentiation; HLA-DR, human leukocyte antigen DR isotype; TIM3, T cell immunoglobulin and mucin domain-containing protein 3; DC, dendritic cell; Treg, regulatory T cell; Exh, exhausted; Eff, effector.
Fig. 2 |
Fig. 2 |. Immunosuppressive cell enrichment and tissue remodeling in residual HCC.
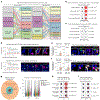
a, Immune and tumor cell proportions in residual HCCs from chemoembolization-treated liver explants (residual HCC, n = 55 patients) compared to primary resected primary HCC (n = 53 patients). b, H&E and CODEX imaging representations of a residual and primary HCC tumor core. In each CODEX image, eight canonical markers (DAPI, CD31, CD4, CD15, CD68, PanCK, CD8 and αSMA) are overlaid onto the image in different colors. c, Volcano plot showing the differential enrichment of tumor and immune cell populations (with statistical significance) in residual (n = 55 patients) versus primary HCCs (n = 53 patients). Two-tailed unpaired t-test shown with Bonferroni correction for multiple comparisons was used. d, Proportion of PD-L1+ macrophages, PD-L1+ tumor cells, mast cells and exhausted T cells in residual (n = 55 patients) versus primary HCCs (n = 53 patients). Box indicates 25th–75th percentile, whiskers show 5th–95th percentile and the line shows the median e, Representative Voronoi plot of cores showing PD-L1+ macrophage, PD-L1+ tumor cells, mast cells and exhausted T cells density in residual (n = 55 patients) versus primary HCCs (n = 53 patients). f, Comparison of normalized expression of stemness marker CD44 and CK19 marker in tumor cells from residual (n = 217,105 cells) and primary HCC (n = 297,608 cells) (both Padj value < 2.2 × 10−308). Two-tailed unpaired t-test shown with Bonferroni correction for multiple comparisons. The curve represents the probability density function of the normalized expression levels, with the peak indicating the mode. g, Comparison of normalized expression of CD11b and podoplanin in PD-L1+ macrophages from residual (n = 47,605 cells) and primary HCC (n = 6,108 cells) (both Padj value < 2.2 × 10−308). Two-tailed unpaired t-test shown with Bonferroni correction for multiple comparisons. The curve represents the probability density function of the normalized expression levels, with the peak indicating the mode. h, Comparison of normalized expression of PD-1 and TIM3 in T cells and NK cells from residual (T cells, n = 16,549 cells; NK cells n = 11,701 cells) and primary HCC (T cells, n = 45,494 cells; NK cells n = 2,111 cells) (both Padj value < 2.2 × 10−308). Two-tailed unpaired t-test shown with Bonferroni correction for multiple comparisons. The curve represents the probability density function of the normalized expression levels, with the peak indicating the mode. Statistical significance was assessed by an unpaired, two-tailed t-test, Bonferroni adjustment was used for P values. CD, cluster of differentiation; αSMA, smooth muscle alpha actin; BCL2, B cell lymphoma 2; Sig, significant.
Fig. 3 |
Fig. 3 |. Remodeling of spatial cellular interactions in residual HCC.
a, Alluvial plot of tumor cell subtype and immune cell interactions in residual (n = 55 patients) and primary HCCs (n = 53 patients). The height of each unit is proportional to the frequency of interaction between two cell types. Only significant interactions with Padj < 0.05 are depicted. b, Size-modulated circular heatmap showing mean frequency and adjusted P values of direct interactions between tumor cell subtypes and PD-L1+ macrophages in residual (n = 55 patients) and primary HCCs (n = 53 patients). c, Size-modulated circular heatmap showing mean frequency and adjusted P values of direct interactions between tumor cell subtypes and exhausted CD8 T cells in residual (n = 55 patients) and primary HCCs (n = 53 patients). d, Kaplan–Meier plots signifying the recurrence-free survival of tumors stratified by median frequency of interaction between EpCAM+ tumor cells and either CD206+ or PD-L1+ macrophages in residual HCC (n = 55 patients). CODEX representative IF images demonstrate the interaction between representative cells. log-rank test used to statistically compare the groups. e, CODEX imaging representations of PD-L1+ macrophage interactions with exhausted and effector CD8+ T cells, shown with box plots quantifying the proportion of interactions in primary (n = 53 patients) compared to residual HCC (n = 55 patients). Box shows 25th–75th percentiles, whiskers show 5th–95th percentiles and the line indicates the median. f, CODEX imaging representations of PD-L1+ macrophage interactions with fibroblasts and endothelial cells, shown with bar plots quantifying the proportion of interactions in primary (n = 53 patients) compared to residual HCC (n = 55 patients). g, Model of direct and indirect interactions with a single central cell using the scalar variable ‘cell–cell distance’. R2 values for predicting Ki67 and BCL2 marker expression in radius of increasing sizes. Volcano plots show that increasing neighborhood sizes explain more variance in expression of a central cell’s Ki67 and BCL2 (n = 1.07 million cells each). R2 values for Ki67 are higher on average for a neighborhood radius of 100 μm versus a neighborhood radius of 25 μm (two-sided Wilcoxon rank-sum Padj value 8.48 × 10⁻⁶) and for BCL2 (two-sided Wilcoxon rank-sum Padj value 1.76 × 10⁻⁵). Violin/boxplot shows 25th–75th percentiles, whiskers show 5th–95th percentiles and the line indicates the median. h, Size-modulated circular heatmap showing mean frequency and adjusted P values of indirect interactions between tumor cell subtypes and PD-L1+ macrophages in residual (n = 55 patients) and primary HCCs (n = 53 patients). i, Size-modulated circular heatmap showing mean frequency and adjusted P values of frequency of indirect interactions between tumor cell subtypes and exhausted CD8+ T cells in residual (n = 55 patients) and primary HCCs (n = 53 patients). Statistical significance was assessed by an unpaired, two-tailed t-test and BH adjustment was used for P values.
Fig. 4 |
Fig. 4 |. Synchronized spatial remodeling of cellular neighborhoods in residual HCC.
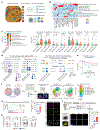
a, Schematic showing CN identification based on an iterative ten-cell clustering algorithm. Color codes show hypothetical spatial structures within the tumor microenvironment. b, Heatmap demonstrating the cellular compositions of the nine CNs defined in this study. c, Comparison of tumor and immune cell neighborhood distributions in primary (n = 53 patients) and residual HCCs (n = 55 patients). Box plots comparing the proportion of eight CNs in primary (n = 53 patients) and residual HCCs (n = 55 patients). Box shows 25th–75th percentiles, whiskers show 5th–95th percentiles and the line indicates the median. Statistical significance was assessed by unpaired, two-tailed t-test. BH adjustment was used for P values. d, Size-modulated circular heatmap showing mean expression of markers on y axis in tumor cells and T cells in residual HCC within the M2-macrophage CN (tumor cells, n = 17,046 cells; T cells, n = 4,299 cells) compared to the pauci-immune tumor CN (tumor cells, n = 109,391 cells) or T cell immune CN (T cells, n = 8,345 cells) respectively, Padj values shown next to the plot. Size-modulated circular heatmap showing mean expression of markers on y axis on macrophages and T cells within the EpCAM+ tumor cell CN (macrophages, n = 272 cells; T cells, n = 13 cells) and CK19+ tumor cell CNs (macrophages, n = 1,201 cells; T cells, n = 354 cells) compared to the pauci-immune tumor CN (macrophages, n = 4,401 cells; T cells, n = 239 cells), respectively, Padj values are shown next to the plot. Statistical significance was assessed by unpaired, two-tailed t-test. BH adjustment was used for P values. e, Kaplan–Meier plot showing recurrence-free survival in patients with tumors stratified based on the presence (n = 12 patients) or absence (n = 43 patients) of EpCAM+ tumor cell CN in residual HCC (n = 55 patients). A log-rank test was used to statistically compare the groups. f, Schematic of in vitro 3D tumoroid co-culture of control and doxorubicin-resistant (DoxR) Huh7 HCC cell lines with THP1 macrophages followed by scRNA-seq followed by cell clustering and quantification. g, Characterizing the macrophage C3 (5,176 cells) and C4 (3,372 cells) between DoxR and control samples. Gene set expression analysis shows enrichment of the M2-like macrophage signature in the C3 cluster of macrophages enriched in the DoxR samples. h, Violin plot shows mean expression of key differentially expressed genes in C3 (5,176 cells) and C4 (3,372 cells) clusters. i, Quantification of PD-L1+ macrophages by IF in 3D heterotypic tumoroids of control (n = 4 tumoroids) or DoxR (n = 3 tumoroids) Huh7 cancer cells with THP1 macrophages. Data are presented as mean ± s.e.m. Statistical significance was assessed by unpaired, two-tailed t-test. j, Schematic of in vitro assay using primary HCC patient-derived 3D tumoroids and monocyte-derived macrophages from patients with HCC. Calcein staining demonstrates viability of 3D patient-derived tumoroids. PD-L1 expression in monocyte-derived macrophages treated with conditioned medium from DoxR patient-derived tumoroid (n = 4 patients) versus control (n = 4 patients). Unpaired t-tests were used to compare the proportion of PD-L1+ macrophages between the two groups. Statistical significance was assessed by unpaired, two-tailed t-test.
Fig. 5 |
Fig. 5 |. TGFβ pathway activation promotes persistence of residual tumor cells in HCC.
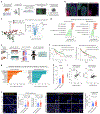
a, Workflow of NanoString spatial transcriptomics analysis. The expression of targeted transcriptomes of cancer and immune-related genes were quantified in tumor cell and macrophage AOIs. b, Representative immunofluorescent ROIs showing tumor cell and macrophage-enriched AOI based on the expression of panCK, CD45, CD68 and DAPI. c, PCA and volcano plot showing differential expression of genes in the tumor cell (n = 52 AOIs) and macrophage (n = 53 AOI). Welch’s two-tailed unpaired t-test was performed on log2-transformed normalized count data and the Benjamini–Yekutieli false discovery rate correction was applied. d, Molecular pathways activated in tumor cells (n = 19 AOI versus n = 11 AOI) and macrophage AOIs (n = 18 AOI versus n = 9 AOI) of residual HCC compared to nontumorous liver samples. e, Schematic showing derivation of tumor cell and macrophage signatures from the spatial transcriptome data of primary and residual HCC. f, Kaplan–Meier curve showing the prognostic significance of tumor cell and macrophage signatures applied to a validation cohort of human HCC (n = 340 patients). A log-rank test was used to compare the groups. g, Upstream regulators of transcriptional regulators of gene expression changes in the tumor cell and macrophage AOIs of residual HCC compared to nontumorous liver samples. h, Plot comparing TGFB1 gene expression levels in tumor cells (n = 19 AOIs) and macrophage AOIs (n = 18 AOI) of residual HCC. Data are presented as mean ± s.e.m. A two-tailed unpaired t-test was used. i, Correlation plot showing coexpression of SMAD2 and CD274 (PD-L1) in residual HCC (n = 38 AOI) but not primary HCC (n = 48 AOI). A two-sided Spearman test was used to correlate expressions. j, Representative fluorescent mRNA FISH images along with quantification of TGFB1 mRNA expression in primary (n = 51 patients) and residual HCC (n = 46 patients). Representative fluorescent mRNA FISH images along with quantification of TGFB1 and CD68 mRNA expression in primary (n = 31 patients) and residual HCC (n = 30 patients). Data are presented as mean ± s.e.m. A two-tailed unpaired t-test was used. rHCC, residual hepatocellular carcinoma; TGFB1, transcription growth factor β1.
Fig. 6 |
Fig. 6 |. Recurrence of HCC arises from MRD in a transgenic mouse model of HCC.
a, Schematic illustrates the process of oncogene activation triggering tumor progression, subsequent inactivation leading to tumor regression and then reactivation promoting recurrence. Representative H&E and IHC for MYC show the temporal evolution of tumor progression and tumor regression in MYC/Twist1 HCC in the liver and lungs. b, Representative bioluminescence imaging, MRI liver and CT lungs show regression of tumors upon oncogene inactivation and recurrence upon oncogene reactivation. MRD-bearing mice do not show any radiological evidence of tumor. c, Overall survival of MYC-HCC (n = 17 mice) and MT-HCC (n = 21 mice) mice with primary tumor from oncogene activation (MYC-HCC n = 12, MT-HCC n = 16 mice) or with recurrent tumor from oncogene reactivation in MRD-bearing mice (MYC-HCC n = 5, MT-HCC n = 5 mice). A log-rank test was used to compare the survival in the Kaplan–Meier analysis. d, Intravital microscopy (MYC-HCC n = 3, MT-HCC n = 3 mice) and subcutaneous transplant allograft model (MYC-HCC n = 10, MT-HCC n = 10 mice) confirms persistence of a small proportion of viable residual tumor cells in perivascular niches, which serve as a source of recurrence upon oncogene reactivation. e, Cross-species transcriptome analysis of a 45-gene signature enriched in residual murine HCC (n = 6 mice) and not primary (n = 10 mice) or recurrent HCC (n = 3 mice) was able to predict survival in an independent human HCC cohort (n = 372 patients). A log-rank test was used to compare survival between Kaplan–Meier curves. f, Experimental scheme for scRNA-seq of microdissected areas containing in vivo MRD. Graph-based clustering of scRNA-seq represented as a Uniform Manifold Approximation and Projection (UMAP), with each color representing the correspondingly named cell type (n = 15,300 cells). The residual tumor cells (n = 355 cells) are highlighted in a red box. g, Overlap with cell types and enriched pathways in residual tumor cells (n = 355 cells) compared to hepatocyte clusters 1 (3,607 cells) and 2 (2,144 cells) in scRNA-seq of MRD. Bar graphs indicate −log(P value) from hypergeometric tests to assess significance of pathway enrichment. h, Expression of Tgfb1 and Tgfbr1 in primary (MYC-HCC n = 5, MT-HCC n = 5 mice), residual HCC (MYC-HCC n = 3, MT-HCC n = 3 mice) and recurrent HCC (MYC-HCC n = 3 mice). Data are presented as mean ± s.e.m. A two-tailed unpaired t-test was used to compare the mean between the groups. Horizontal bar plot showing activation of Tgfb1 pathway as upstream regulator of transcriptional changes in MYC-HCC and MT-HCC MRD and MYC pathway inactivation in MRD. i, Expression of Tgfbr1 by IF staining of primary cancer cell lines derived from MYC-HCC upon MYC inactivation and reactivation. Representative IF images and quantification of phosphorylation of smad2/3 primary cancer cell lines derived from MYC-HCC upon MYC inactivation. Mean and s.e.m. are shown (n = 12 biological replicates each). A two-tailed unpaired t-test was used to compare the mean between the groups. IHC, immunohistochemistry; BLI, bioluminescence imaging; IVM, intravital microscopy; Prim, primary; Res, residual; Rec, recurrent.
Fig. 7 |
Fig. 7 |. Mechanisms of immune evasion by cancer stem cells in the mouse MRD niche.
a, Graph-based clustering of scRNA-seq of MRD represented as UMAP with each color representing the correspondingly named cell type (n = 15,300 cells). The three subsets of macrophages are highlighted in a red box. The M2-like macrophage cluster (C6) (1,061 cells) is shown separately in the UMAP below. b, Volcano plot showing the differentially expressed genes between the M2-like C6 cluster (1,061 cells) of macrophages and the C5 (1,097 cells) and C9 cluster (681 cells) of M1-like macrophages (Padj < 0.05) are shown in green if underexpressed or red if overexpressed in the M2-like macrophage cluster. DESeq2 was used in differential expression analysis to calculate fold changes and P values. c, Heatmap showing the enrichment of gene signature of M2-like macrophage polarization and monocyte-derived macrophage differentiation in the M2-like C6 cluster of macrophages (1,061 cells) than the C5 (1,097 cells) and C9 cluster (681 cells) of M1-like macrophages. d, Representative H&E and IF images of CD133+ stem-like cancer cells and Pdl1+ macrophages near MRD (<200 μm) compared to liver distant from MRD (n = 8 areas, each group). Data are presented as mean ± s.e.m. Bar plot shows comparison for mean PD-L1+ macrophages between groups using two-sided unpaired t-tests. e, Representative H&E and IF images of Tgfβ1 expression on Pdl1+ macrophages near MRD (<200 μm) compared to liver distant from MRD (n = 9 areas, each group). Data are presented as mean ± s.e.m. Bar plot shows comparison for mean Tgfβ1+/PD-L1+ macrophages between groups using two-sided unpaired t-tests. f, Schematic showing collection of conditioned medium from primary or residual HCC cells from MYC-HCC to treat macrophages in vitro. Bar plot shows comparison for mean concentration of cytokines secreted by residual tumor cells (n = 6 biologically independent samples) and primary tumor cells (n = 6 biologically independent samples) using two-sided unpaired t-tests. Data are presented as mean ± s.e.m. g, Macrophages are treated with conditioned medium (CM) from negative control (n = 2 biologically independent samples), primary (n = 3 biologically independent samples) or residual tumor cells (n = 3 biologically independent samples) in vitro. Bar plot shows comparison for phagocytosis between CM from primary or residual tumor cell groups using two-sided unpaired t-tests. Data are presented as mean ± s.e.m. h, Bar plots showing comparison of mean CD4+ T, CD8+ T and exhausted CD8+ T cells in livers with MRD (n = 4 mice) versus control non-MRD livers (n = 4 mice) using two-sided unpaired t-tests. Representative flow cytometry plots of exhausted CD8+ T cells based on TIM3 and PD-1 expression. Data are presented as mean ± s.e.m. Ctrl, control.
Fig. 8 |
Fig. 8 |. Blockade of Tgfβr1 and Pdl1 prevents recurrence from MRD in mouse HCC.
a, Experimental scheme for treatment of oncogene-deprived MRD-bearing mice with control antibody or monotherapy with Tgfbr inhibitor (TgfbrI) or anti-Pdl1 or their combination. Treatment is followed by oncogene reactivation to induce tumor recurrence. b, Representative gross images of recurrent tumor burden upon oncogene reactivation in the liver of mice treated with control antibody or monotherapy with TgfbrI or anti-Pdl1 inhibitor or their combination. c, Quantification of recurrent tumor burden upon oncogene activation in the liver of MYC-HCC and MT-HCC mice treated with control antibody (n = 11 mice) or monotherapy with Tgfbr inhibitor (n = 9 mice) or anti-Pdl1 inhibitor (n = 9 mice) or their combination (n = 16 mice). Plots compare the mean between the groups with two-sided unpaired t-tests. Box shows 25th–75th percentiles, whiskers show 5th–95th percentiles and the line represents the median. d, Representative images and quantification from H&E staining and IHC staining for CD4 and CD8 in recurrent tumors in mice treated with control antibody (n = 5 mice) or monotherapy with TgfbrI (n = 5 mice) or anti-Pdl1 inhibitor (n = 5 mice) or their combination (n = 5 mice). Plots compare the mean between the groups with two-sided unpaired t-tests. Box shows 25th–75th percentiles, whiskers show 5th–95th percentiles and the line represents the median. e, Representative flow cytometry images and quantification of activated CD4+ and CD8+ T cells, which are CD69+/CD44high in the recurrent tumor in the liver and lungs of MYC-HCC and MYC/Twist1 HCC mice treated with control antibody (n = 3 mice) or combination therapy with TgfbrI and anti-Pdl1 inhibitor (n = 4 mice). Bar plots compare the mean between the groups with two-sided unpaired t-tests. Data are presented as mean ± s.e.m. f, Experimental scheme for treatment of oncogene-deprived residual HCC-bearing mice with control antibody or Tgfbr1 or Pdl1 inhibitors or combination therapy with TgfbrI and anti-Pdl1 inhibitor. Residual tumor niches are then evaluated for immune response. g, Quantification of IHC staining for CD8 and PD-L1 in residual HCC niche in mice treated with control antibody (n = 5 mice) or Tgfbr1 (n = 5 mice) or Pdl1 inhibitors (n = 5 mice) or combination therapy with Tgfbr1 and Pdl1 inhibitors (n = 5 mice). Bar plots compare the mean between the groups with two-sided unpaired t-tests. Data are presented as mean ± s.e.m. h, Representative H&E staining and IHC staining for CD8 and PD-L1 in MRD (red arrows in gross image and black boxes in H&E) in mice treated with control antibody (n = 5 mice) or Tgfbr1 (n = 5 mice) or Pdl1 inhibitors (n = 5 mice) or combination therapy with Tgfbr1 and Pdl1 inhibitors (n = 5 mice).

References

    1. Lee Y-T et al. The mortality and overall survival trends of primary liver cancer in the United States. J. Natl. Cancer Inst 113, 1531–1541 (2021). - PMC - PubMed
    1. Lei J et al. Response to transarterial chemoembolization may serve as selection criteria for hepatocellular carcinoma liver transplantation. Oncotarget 8, 91328–91342 (2017). - PMC - PubMed
    1. Kim DJ et al. Recurrence of hepatocellular carcinoma: importance of mRECIST response to chemoembolization and tumor size. Am. J. Transplant 14, 1383–1390 (2014). - PubMed
    1. Agopian VG et al. Impact of pretransplant bridging locoregional therapy for patients with hepatocellular carcinoma within Milan criteria undergoing liver transplantation: analysis of 3601 patients from the US multicenter HCC transplant consortium. Ann. Surg 266, 525–535 (2017). - PubMed
    1. Adeniji N et al. Impact of bridging locoregional therapies for hepatocellular carcinoma on post-transplant clinical outcome. Clin. Transplant 34, e14128 (2020). - PMC - PubMed