. 2024 Nov;30(11):3196-3208.
doi: 10.1038/s41591-024-03224-y. Epub 2024 Sep 20.

High-throughput identification of repurposable neuroactive drugs with potent anti-glioblastoma activity

Affiliations

High-throughput identification of repurposable neuroactive drugs with potent anti-glioblastoma activity

Sohyon Lee et al. Nat Med. 2024 Nov.

Abstract

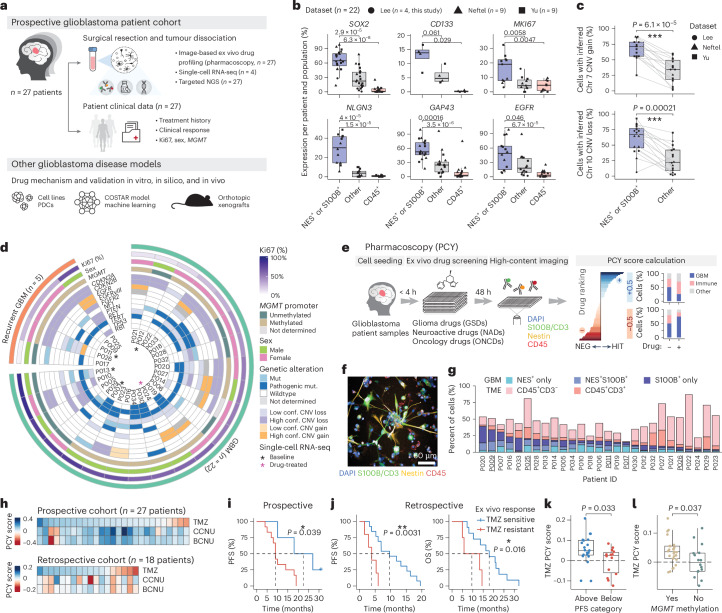
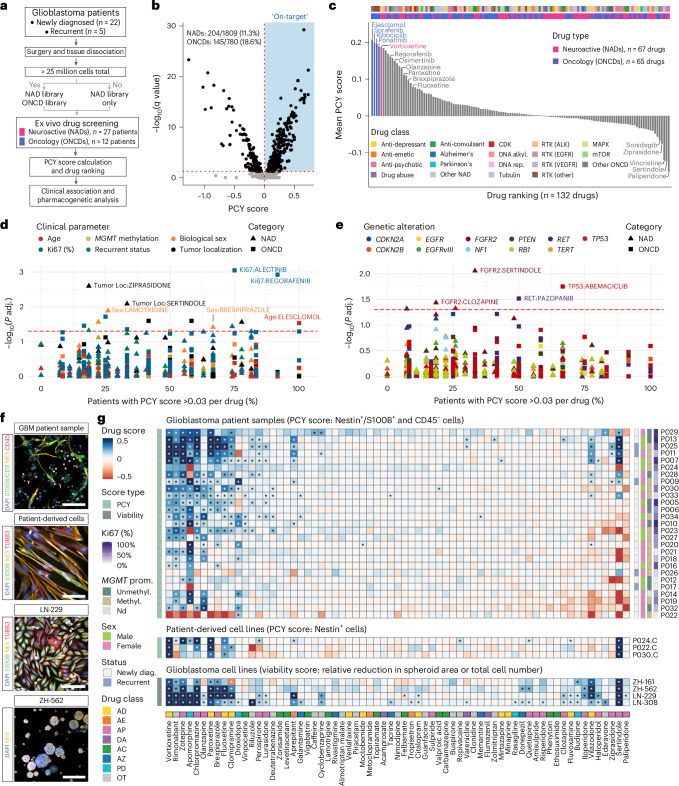
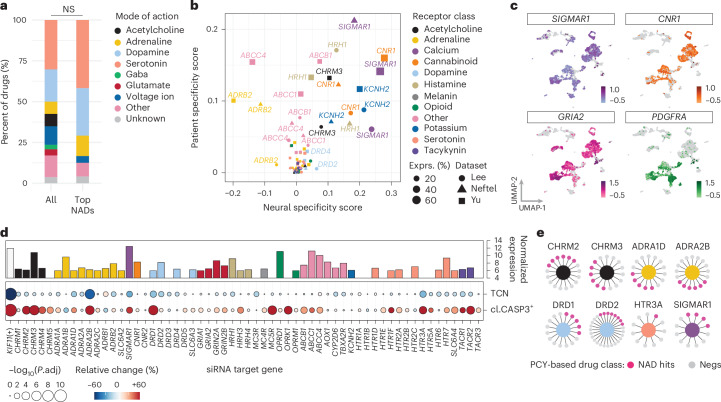
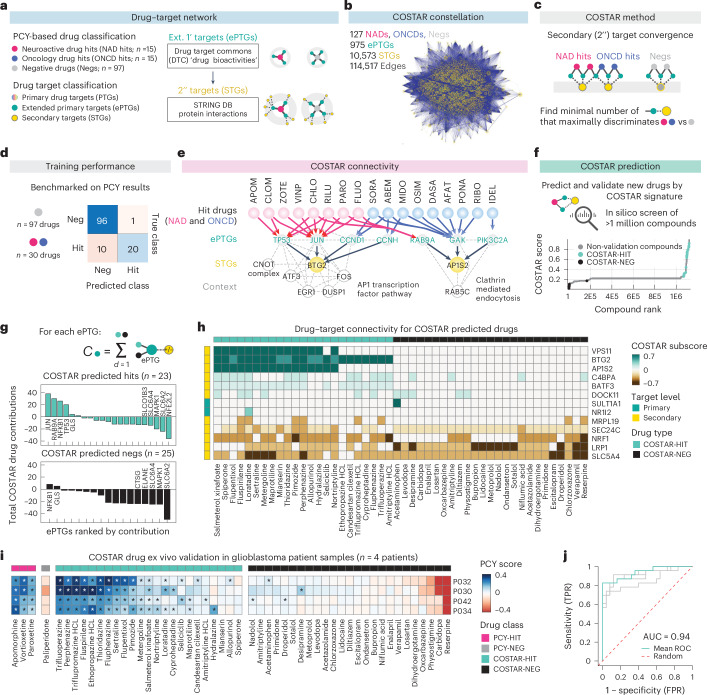
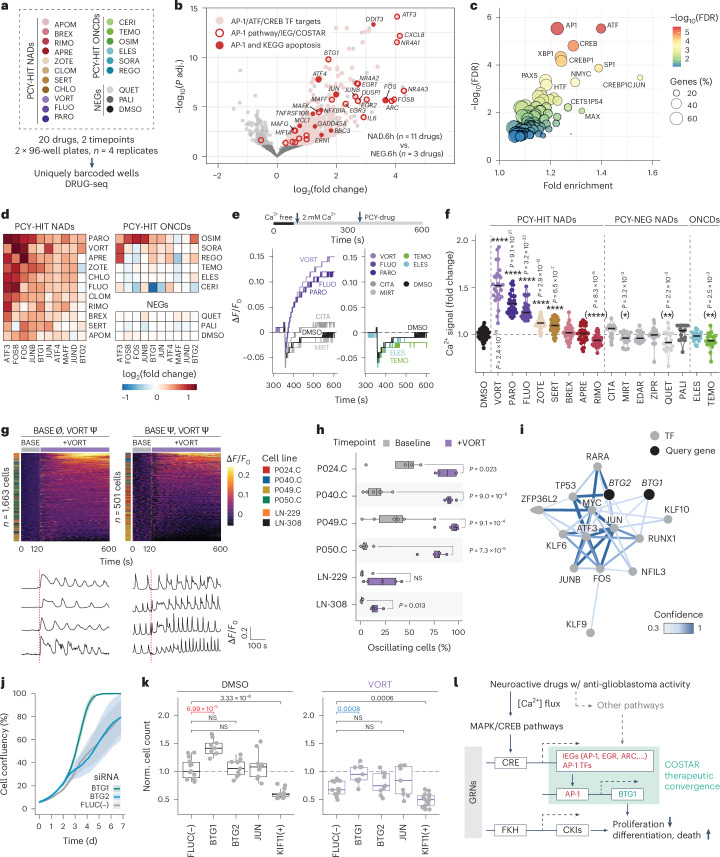
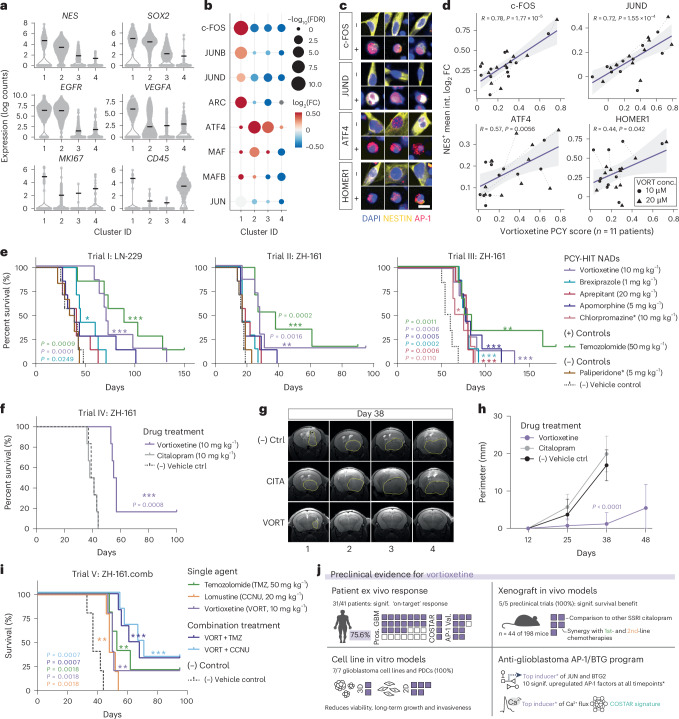
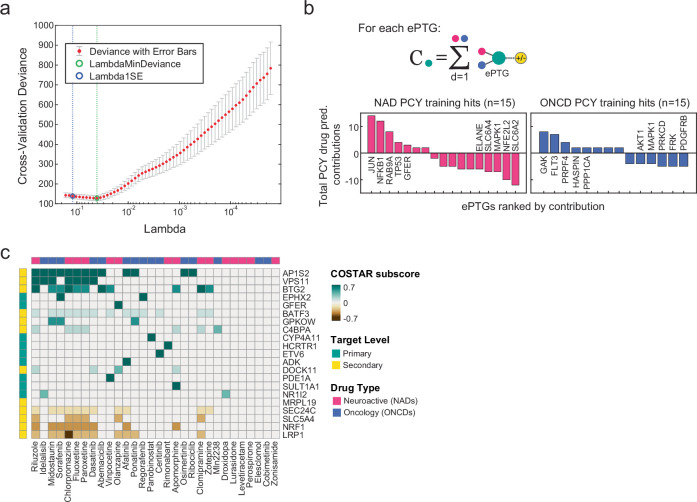
Glioblastoma, the most aggressive primary brain cancer, has a dismal prognosis, yet systemic treatment is limited to DNA-alkylating chemotherapies. New therapeutic strategies may emerge from exploring neurodevelopmental and neurophysiological vulnerabilities of glioblastoma. To this end, we systematically screened repurposable neuroactive drugs in glioblastoma patient surgery material using a clinically concordant and single-cell resolved platform. Profiling more than 2,500 ex vivo drug responses across 27 patients and 132 drugs identified class-diverse neuroactive drugs with potent anti-glioblastoma efficacy that were validated across model systems. Interpretable molecular machine learning of drug-target networks revealed neuroactive convergence on AP-1/BTG-driven glioblastoma suppression, enabling expanded in silico screening of more than 1 million compounds with high patient validation accuracy. Deep multimodal profiling confirmed Ca2+-driven AP-1/BTG-pathway induction as a neuro-oncological glioblastoma vulnerability, epitomized by the anti-depressant vortioxetine synergizing with current standard-of-care chemotherapies in vivo. These findings establish an actionable framework for glioblastoma treatment rooted in its neural etiology.


Conflict of interest statement

Competing interests B.S. is scientific co-founder and shareholder of Prevision Medicine AG and Graph Therapeutics. T.W. has received honoraria from Philogen. M.C.N. received a research grant from Novocure and honoraria for consulting or lectures from WISE, Merck Sharp & Dohme, Osteopore and Novocure. M.W. has received research grants from Novartis, Quercis and Versameb and honoraria for lectures or advisory board participation or consulting from Anheart, Bayer, Curevac, Medac, Neurosense, Novartis, Novocure, Orbus, Pfizer, Philogen, Roche and Servier. The other authors declare no competing interests.

Figures

Fig. 1
Fig. 1. Clinical concordance of single-cell ex vivo drug profiling for glioblastoma.
a, Prospective multimodal profiling of a glioblastoma patient cohort (n = 27 patients) and diverse glioblastoma disease models. Patient numbers are indicated per data type. b, Percent of cells expressing each gene (y axis) per subpopulation (x axis; n = 22 patients; data points; shape indicates scRNA-seq dataset). P values were calculated by two-tailed Wilcoxon test. Box plots show 25th–75th percentiles with a line at the median; whiskers extend to 1.5 times the interquartile range. c, Inferred CNA analysis based on scRNA-seq datasets in b. Matched patient samples are connected by gray lines. Patients with less than 5% of cells with detected CNAs are excluded. d, Overview of the prospective cohort (n = 27 patients). See Supplementary Table 1 for full cohort information. conf., confidence. e, Real-time image-based ex vivo drug screening (PCY) workflow of glioblastoma patient samples. f, Example IF image of a glioblastoma patient sample (P040; scale bar, 60 µm). g, Baseline cellular composition across the prospective glioblastoma cohort measured by PCY. Underlines indicate patients with recurrent glioblastoma. h, GSD (rows; n = 3 drugs) response across patient samples (columns). GSD response is averaged across concentrations for TMZ and lomustine/carmustine (CCNU and BCNU, respectively). i,j, Stratification of newly diagnosed glioblastoma patient survival based on ex vivo TMZ sensitivity of (Nestin+/S100B+ and CD45) cells (blue, TMZ sensitive; red, TMZ resistant). Kaplan–Meier survival curves are compared using the log-rank (Mantel–Cox) test, and the optimal TMZ PCY score cutpoint to stratify patients was determined by maximally selected rank statistics. i, PFS of the prospective glioblastoma cohort (n = 16 annotated patients) stratified by TMZ PCY score (100 µM). Tick mark indicates ongoing response. j, PFS (left) and OS (right) of the retrospective cohort (n = 18 patients) stratified by mean TMZ PCY score. k, TMZ PCY scores (dots; n = 34 patients across both cohorts) stratified by clinically reported median PFS to first-line TMZ chemoradiotherapy. Wilcoxon test. l, TMZ (50 µM) PCY scores across both cohorts (dots; n = 41 patients) stratified by MGMT promoter methylation status. Wilcoxon test. Box plots as in b. GBM, glioblastoma. Source data
Fig. 2
Fig. 2. PCY identifies repurposable NADs with tumor-intrinsic anti-glioblastoma activity.
a, PCY overview for screening neuroactive (NAD) and oncological (ONCD) drug libraries across the prospective patient cohort (n = 27 patients) ex vivo. b, Volcano plot of all measured glioblastoma PCY scores and corresponding significance (FDR-adjusted q value, Student’s two-tailed t-test). ‘On-target’ responses (blue; PCY score > 0, −log10(q value) > 1.3) per drug library are indicated. c, Drug ranking (n = 132 drugs) by mean PCY scores across patients. alkyl., alkylation; rep., replication. d, Relationship between clinical parameters and PCY score across NADs and ONCDs. Each datapoint represents a [clinical parameter:drug] association. e, As in d but for genetic alterations. d,e, Colored by clinical parameter/gene, and shape denotes drug category. Red dashed line, significance threshold. Adjusted P values were calculated by Wilcoxon test for two groups and by Kruskal–Wallis test for three or more, excluding cases where any category was present in fewer than three patients. f, Example patient sample image (P040; scale bar, 100 µm), PDC line (P040.PDC; scale bar, 100 µm), adherent glioblastoma cell line (LN-229; scale bar, 150 µm) and glioblastoma-initiating cell line (ZH-562; scale bar, 250 µm). Stains are indicated in their respective colors. g, NAD score matrix (n = 67 drugs; columns) across patient samples (n = 27; rows), PDC lines (n = 3; patient ID followed by ‘.C’) and glioblastoma cell lines (n = 4). Drug score (color scale) indicates the PCY score for patient samples and PDC lines (one-tailed t-test) or viability score for glioblastoma cell lines (two-tailed t-test). Values beyond color scale limits were set to either minimum or maximum values. For clinical and drug annotations, see Supplementary Tables 1 and 2. *FDR-adjusted P < 0.05. Source data
Fig. 3
Fig. 3. Divergent genetic dependencies on canonical primary target genes of NADs.
a, Drug mode of action for all NADs (n = 67 drugs; left) and top NAD hits (n = 15 drugs with a mean patient PCY score > 0.03; right) represented as stacked bar plots. NS, not significant by hypergeometric enrichment test. b, NAD PTG expression in 22 glioblastoma patient samples across three scRNA-seq datasets (shape) plotted as the neural specificity score (x axis) versus patient specificity score (y axis) for each PTG (dot, gene; size, percent expression; color, receptor class). c, scRNA-seq log10(expression) of selected neuroactive PTGs (SIGMAR1, CNR1 and GRIA2) and oncogenic RTK (PDGFRA) visualized on the UMAP projection, as in Extended Data Fig. 1b. d, Baseline RNA-seq expression (top panel; y axis; color, receptor class) as in b and siRNA-mediated gene silencing of PTGs in LN-229 cells (n = 59 siRNA conditions; columns; bottom panel). Total cell number (TCN) reduction and cleaved CASP3+ fraction increase (cl.CASP3+) relative to the (−) control FLUC siRNA condition depicted as a circle per gene. Two-tailed t-test where circle sizes scale with the −log10(FDR-adjusted P value), and color represents relative change for each tested PTG. e, Example PTGs with genetic dependencies (core nodes) linking to both PCY-hit (pink; NAD hits) and PCY-negative (gray; Negs) drugs. PTGs are colored according to receptor class as in b. Source data
Fig. 4
Fig. 4. Molecular convergence on a neuroactive drug–target connectivity signature predictive of anti-glioblastoma efficacy.
a, COSTAR workflow. b, COSTAR network of 127 PCY-tested drugs, 965 ePTGs and 10,573 STGs, connected by 114,517 edges. c, COSTAR method by logistic LASSO regression. See also Methods. d, COSTAR training model performance compared to PCY-based experimental ground truth. e, COSTAR connectivity (solid lines) reveals convergence of NAD (pink) and ONCD (blue) hits to key ePTGs (gray) and STGs (yellow). See Extended Data Fig. 5c for the full model. Additional proteins (white nodes) with high-confidence interactions to STGs (dashed lines) are shown. f, In silico drug screen across 1,120,823 compounds by COSTAR. Compounds are ranked (x axis) by their predicted PCY-hit probability (COSTAR score; y axis). Predicted drug hits (COSTAR-HIT; mint green) and predicted non-hits (COSTAR-NEG; black) selected for experimental validation are indicated. g, ePTGs (x axis) ranked by their integrated contribution ‘C’ to predict a hit (+1) or a non-hit (−1) (y axis) in the COSTAR model, separated for COSTAR-HITs (top) and COSTAR-NEGs (bottom) (‘d’). h, Drug–target connectivity of select COSTAR-predicted drugs (columns; n = 23 COSTAR-HIT drugs; n = 25 COSTAR-NEG drugs) to primary and secondary drug targets (rows). COSTAR subscore (heatmap color scale) is the LASSO model coefficient multiplied by the integrated connectivity of drug to target mapping. Target genes with absolute COSTAR LASSO coefficients greater than 0.1 are displayed. i, Experimental ex vivo validation by PCY of COSTAR-HIT (n = 23; mint green) and COSTAR-NEG (n = 25; black) drugs (columns) across four glioblastoma patient samples (rows) including positive (PCY-hits; pink; n = 3) and negative (PCY-negative; dark gray; n = 1) control drugs. Heatmap color scale indicates the PCY score of glioblastoma cells. One-tailed t-test; *FDR-adjusted P < 0.05. Outliers beyond color scale limits are set to minimum and maximum values. j, Receiver operating characteristic (ROC) curves (gray, n = 4 patients; mint green, mean across patients; red dashed, random classifier) describing the COSTAR validation accuracy in glioblastoma patient samples of the COSTAR-predicted drugs (n = 48 drugs; corresponding to i). FPR, false-positive rate; PCY-HIT, PCY-hit; PCY-NEG, PCY-negative; TPR, true-positive rate. Source data
Fig. 5
Fig. 5. NADs alter glioblastoma neurophysiology and engage an anti-proliferative AP-1/BTG GRN.
a, Workflow for DRUG-seq of drug-treated LN-229 cells. b, Transcriptional response of PCY-hit NAD-treated cells compared to NEG-treated cells (6 h; as in a). Significant genes by two-tailed Wald test (DESeq2) in light gray or colored according to their gene annotations (see legend). c, TFBS enrichment analysis of significantly upregulated genes in b. Circles, TF annotations. d, log2(fold change) of AP-1 TF and BTG family gene expression (columns) significantly upregulated by 6-h PCY-hit NAD (rows) treatment compared to NEG. e, Calcium response (ΔF/F0; y axis) over time (x axis) of LN-229 cells upon drug treatment. Timeline depicts FLIPR assay setup. Representative traces showing ΔF/F0, change in fluorescence intensity relative to baseline for NAD (left) and ONCD (right) drug conditions. f, Fold change in extracellular calcium influx upon drug treatment relative to DMSO measured as in e (n = 8 assay plates; n = 17 conditions; n = 18–30 wells per drug; DMSO, n = 47 wells). Asterisks in parentheses, median [Ca2+ fold change] < 0. Black line, median value. g, Single-cell-resolved calcium response (ΔF/F0) measured by ratiometric Fura-2 imaging over time at baseline (BASE) and after vortioxetine treatment (+VORT; 20 µM) across six cell lines (n = 3,561 cells; see also Extended Data Fig. 7c–f). Panels depict single-cell calcium responses (rows) over time (columns), stratified by the presence (Ψ) or absence (Ø) of calcium oscillations at baseline and VORT treatment. Representative single-cell traces (n = 4 per heatmap) are depicted below. h, Percent of cells displaying calcium oscillations (x axis) at baseline (gray) and after VORT treatment (purple) across cell lines (y axis; n = 6). Dots, independent experiments (n = 4–6 experiments per line). Paired two-tailed t-test. i, BTG1/2 transcriptional regulation (PathwayNet). Black nodes, query genes; gray nodes, top 13 inferred TF interactions. Edge colors, relationship confidence. j, LN-229 confluency by live-cell imaging (y axis) over time (x axis) after gene knockdown. Mean (line) and standard deviation (bands) of n = 4 replicate wells are shown. k, LN-229 cell counts (y axis) after gene knockdown (columns) at baseline (left) and vortioxetine treatment (10 µM; right; n = 9–14 replicate wells per condition, n = 2 experiments). Normalized to FLUC at baseline. a,e,f, Drug abbreviations are in Supplementary Table 2. f,k, Two-tailed t-test. P values were adjusted for multiple comparisons by Holm correction. l, Summary diagram by which NADs target glioblastoma. CRE, cAMP response element; CKI, cyclin-dependent kinase inhibitor; FKH, forkhead binding motif. Box plots as in Fig. 1b. NS, not significant; PCY-HIT, PCY-hit; PCY-NEG, PCY-negative. Source data
Fig. 6
Fig. 6. The anti-depressant vortioxetine confers significant survival benefit across preclinical trials and synergizes with standard-of-care glioblastoma treatments.
a, scRNA-seq expression of select marker genes in patient sample P024. Cluster IDs are based upon UMAP clusters in Extended Data Fig. 9a. Black lines, median. b, Differentially expressed AP-1 TFs and effector gene ARC per scRNA-seq cluster in a, upon vortioxetine (VORT) treatment relative to DMSO. Circle sizes, −log10(adjusted P value); color scale, VORT-induced log2(fold change (FC)) compared to DMSO-treated cells per cluster. c, Example single-cell image crops from patient P040 of Nestin+ (yellow) cells after VORT treatment (+; 20 µM) and DMSO at 24 h stained with different AP-1 factors (red) and DAPI (blue). Scale bar, 15 µm. d, VORT ex vivo response (x axis; PCY score) versus AP-1 induction in Nestin+ glioblastoma cells by IF (y axis; log2(fold change) in mean intensity relative to DMSO) across patient samples (n = 11) at 24 h after VORT treatment (10 µM and 20 µM; VORT conc.). Pearson’s linear correlation coefficients and two-tailed P values are indicated. e, Survival analysis across three independent in vivo trials—Trial I: LN-229, Trial II: ZH-161 and Trial III: ZH-161—each with n = 6–7 tumor-bearing mice per treatment group and n = 7 treatments per trial. Doses are denoted in parentheses, and * indicates drugs used in a subset of the three trials. f, Survival analysis of in vivo Trial IV: ZH-161-iRFP720 tumor-bearing mice (n = 6 mice per treatment group). g, Representative MRI images of ZH-161-iRFP720 transplanted mice (columns; Trial IV; n = 4 mice) 38 d after tumor implantation (n = 3 drugs) with tumor perimeters indicated (yellow). h, Tumor perimeters of drug-treated mice in g, at multiple timepoints after tumor implantation by MRI. One-way ANOVA with adjusted P value from Tukey’s multiple comparisons test at day 38. i, Survival analysis of in vivo Trial V: ZH-161 tumor-bearing mice (n = 5–6 mice per group). j, Preclinical evidence for the top PCY-hit NAD VORT across modalities. AP-1 Val., AP-1 validation samples (n = 10 and n = 1 overlap with COSTAR); COSTAR, COSTAR validation samples (n = 4); Pros. GBM, prospective patient cohort (n = 27). *, among tested drugs and timepoints. e,f,h, Survival plotted as Kaplan–Meier curves and P values (colored by drug) calculated using log-rank (Mantel–Cox) test. Censored mice are denoted as tick marks. PCY-HIT, PCY-hit. Source data
Extended Data Fig. 1
Extended Data Fig. 1. Single-cell RNA-Seq analysis and ex vivo drug profiling of standard-of-care treatment for glioblastoma.
a, Example FACS gates of patient sample P011 to enrich for glioblastoma cells prior to scRNA-Seq (n = 50,000 cells shown). b, c, UMAP projection of 7684 single-cell transcriptomes colored by b, patient (P007: 3,475 cells; P011: 1,490 cells; P012: 330 cells; P013: 2,389 cells, this study), and c, cluster-id. TME, tumor microenvironment; OPC, oligodendrocyte precursor cells; EC, endothelial cell; TAM, tumor-associated macrophage; NK, natural killer cell. d, % cells expressing genes (y-axis) per patient (data points) and subpopulation (x-axis) across 22 glioblastoma patient samples (dots) and 3 scRNA-Seq datasets (shape). e, Example IF images of patient samples (P047, P049) labeled with different glioblastoma markers (Nestin, EGFR, and CX43). f, Quantification of IF images in e across n = 4 glioblastoma patient samples (dots) for EGFR and CX43 expression in either Nestin+ or Nestin- cells. Two-tailed t-test. g, Genes (columns) enriched in (NES-, S100B-, and CD45-) triple-negative cells (‘Other’) compared to ([NES+ or S100B + ] and CD45-) cells across 22 patients (rows) from three scRNA-seq cohorts. Heatmap depicts log2(fold change) of genes enriched in ‘Other’ cells. Expression of top-10 genes (columns) per patient (rows) clustered into 3 gene modules. h, Cell-type specific enrichment analysis (Web-CSEA) of the ‘Other’ enriched gene modules as in g. Dots represent individual Web-CSEA datasets, example member genes of their respective gene modules annotated above. i, Example single-cell crops of cleaved CASP3 + /- negative cells by IF in the image dataset used to train a convolutional neural network (CNN) based on nuclear (DAPI) and cell morphology (Brightfield) to detect apoptotic cells. j, Apoptotic classifier CNN performance in classifying the test image dataset (n = 1,214 single-cell crops). k, % cells classified as apoptotic by the CNN across the prospective cohort (n = 27 patients) and marker defined populations. l, Temozolomide PCY score (TMZ; rows; n = 4 concentrations) across patient samples (columns; prospective cohort, n = 27; retrospective cohort, n = 18). Color indicates the PCY score for glioblastoma cells. Values beyond color scale limits set to minimum and maximum values. m, Clinical predictability of ex vivo TMZ response (averaged across n = 4 concentrations) in stratifying progression free survival (PFS) of the prospective cohort (n = 16 patients). P-values from survival curve comparison by the log-rank (Mantel-Cox) test. d,f,k, Boxplots as in Fig. 1b. Source data
Extended Data Fig. 2
Extended Data Fig. 2. Real-time neuroactive and oncology drug screening in samples from patients with glioblastoma.
a, PCY score matrix of oncology drugs (ONCDs; columns; n = 65 drugs) across glioblastoma patient samples (rows; n = 12 patients). Heatmap color scale indicates the PCY score of glioblastoma cells (Nestin + /S100B+ and CD45-). Asterisks (*) denote FDR-adjusted P < 0.05 from a one-tailed t-test. b, PCY score matrix of neuroactive drugs (NADs, n = 67 drugs) averaged across glioblastoma patient samples (n = 27 patients) for each cell population defined by IF markers and total cell number (TCN). Heatmap color scale indicates the mean PCY score of each respective population averaged across patients. a, b, Outliers beyond color scale limits were correspondingly set to minimum and maximum values. For clinical and drug annotations, see Supplementary Tables 1 and 2. c-g Glioblastoma PCY scores (y-axis) plotted per patient against selected parameters (x-axis). c, Age versus Elesclomol response. Linear regression line with a 95% confidence interval. Pearson correlation coefficient with two-tailed P-value annotated. d, TP53 mutational status versus Abemaciclib response. e, RET mutational status versus Pazopanib response. f, Biological sex versus Brexpiprazole response. g, FGFR2 copy number loss versus Sertindole response. Conf: confidence. h, Example IF images of a patient sample (P025) at baseline (DMSO control) and treated with Vortioxetine. Scale bar, 60 µm. i-k, Comparison of neuroactive drug PCY scores of glioblastoma cells (n = 67 NADs; original PCY score) to NAD PCY scores calculated by excluding cleaved CASP3+ apoptotic cells. Apoptotic cells are defined either by IF (PCY score without IF CASP3 + ) or by the apoptotic CNN classifier (PCY score without CNN CASP3 + ; see also Methods). Pearson correlation coefficients with P-values annotated. i, j, NAD screens performed in two validation patient samples (P048, P049). i, Comparison of the original PCY score to the PCY score without IF CASP3+ j, Comparison of the PCY score without IF CASP3+ the PCY score without CNN CASP3+ k, Comparison of the original PCY score to the PCY score without CNN CASP3+ across the prospective cohort (n = 27 patients) and neuroactive drugs (n = 67 drugs). d-g, Two-tailed Wilcoxon test. Boxplots as in Fig. 1b. Source data
Extended Data Fig. 3
Extended Data Fig. 3. Concentration-response curves of glioblastoma cell lines.
a-d, Concentration-response curves of glioblastoma cell lines (a, LN-229; b, LN-308; c, ZH-161; d, ZH-562) for a subset of neuroactive drugs (n = 9 drugs) across different concentrations (logarithmically spaced x-axis, n = 5 concentrations). a, b, Y-axis denotes relative cell counts or c, d, relative 2D-projected spheroid area for 3D cultures normalized to DMSO control. Concentration-response curves (solid black lines) are fitted when possible with a two-parameter log-logistic distribution with 95% confidence intervals (shaded per cell line) and ED50 (red dashed lines). n = 3-5 replicate wells/drug (dots), n = 15 DMSO wells. Source data
Extended Data Fig. 4
Extended Data Fig. 4. Functional genetic dependencies of glioblastoma on heterogeneously expressed neuroactive drug targets.
a, PCY score matrix of antidepressants (left, n = 11 drugs) and antipsychotics (right, n = 16 drugs) across glioblastoma patient samples (n = 27 patients) subsetted from the original matrix, as shown in Fig. 2g. b, UMAP projection of 7684 single-cell transcriptomes from four glioblastoma patient samples (P007, P011, P012, P013), colored by aggregate scRNA-Seq expression across primary target genes (PTG) per receptor class in Fig. 3b. Color scaled to percent of maximum expression per receptor class. c, Neural specificity score (x-axis) versus patient specificity score (y-axis) for three independent glioblastoma scRNA-Seq datasets. Each dot represents a gene, with key marker genes annotated with labels. Key marker genes colored by mean detected expression across cells and dot size scales with percent of expressed cells. All other detected genes are colored in grey. (Lee et al., this study; n = 4 patients, n = 7684 cells, n = 15,668 genes; Neftel et al., n = 9 patients, n = 13,519 cells, n = 22,160 genes; Yu et al., n = 9 patients, n = 4307 cells, n = 19,098 genes). d, Example IF images of siRNA-mediated gene silencing of the positive control gene (KIF11 (+) ctrl; left), negative control gene (FLUC (-) ctrl; middle), and ADRA2B (right). Scale bar, 60 µm. Cells are stained for DAPI (blue), cleaved CASP3 (yellow) and TUBB3 (red). e, Kaplan-Meier survival analysis and associated risk tables of the TCGA primary glioblastoma cohort (n = 120 patients) based on RNA-Seq expression of 4 PTGs (panels) that significantly reduce cell viability in Fig. 3d and stratify patient survival. Optimal cut-point for patient stratification (high, low) is determined by maximally selected rank statistics. Survival curves are compared using the log-rank (Mantel-Cox) test. 95% confidence intervals of Kaplan-Meier estimates are indicated in shaded curves. Source data
Extended Data Fig. 5
Extended Data Fig. 5. Drug-target connectivity identified by COSTAR.
a, Visualization of the local optimum in the cross-validated predictive power of COSTAR LASSO regression when fitting a binomial model to predict drug activity by PCY (hit vs neg) based on a drug’s connectivity pattern (COSTAR constellation, shown in Fig. 4b). X-axis denotes the Lambda regularization parameter (n = 60 unique values) and the y-axis denotes the cross-validated error of the model (deviance) across independent bootstrapped runs (n = 20 runs). Red dots (average) and light grey error bars (standard deviation) are indicated. Vertical dashed lines and colored circles indicate either the Lambda value with the minimal mean squared error (green, MSE) or the more conservative Lambda value with minimal MSE plus one standard deviation (blue, MSE + 1STD). b, ePTGs (x-axis) ranked by their integrated contribution ‘C’ to predict a hit (+1) or non-hit (-1) (y-axis) in the COSTAR model, separated for PCY-hit NADs (left) and ONCD (right). c, Drug-target connectivity of PCY-hit drugs that were part of the COSTAR training data (columns; n = 30 drugs) to primary and secondary drug targets (rows). COSTAR subscore (heatmap color scale) is the LASSO model coefficient multiplied by the integrated connectivity of drug-to-target mapping. Target genes with absolute COSTAR LASSO coefficients >0.1 are displayed. Target level (primary or secondary target) is annotated per gene on the left. Source data
Extended Data Fig. 6
Extended Data Fig. 6. DRUG-Seq confirms an AP-1 mediated transcriptional response specific to neuroactive drugs with anti-glioblastoma efficacy.
a, Number of features detected by DRUG-Seq (y-axis) per drug condition (columns) and by time-point n = 20 drugs, n = 2 time-points, n = 4 replicates per drug/time-point. b, Principal component analysis (PCA) of averaged RNA-Seq counts per drug (color) and time-point (shape). c, Comparisons of drug induced transcriptional profiles by DRUG-Seq shown as log2(fold change) versus –log10(adjusted P-value) for NADs vs NEGs (22 h, left), ONCDs vs CTRLs (6 h, middle), and ONCDs vs CTRLs (22 h, right). Significant genes by two-tailed Wald test (DESeq2) in light grey. Highlighted genes (blue) include AP-1 transcription factor (TF) network genes (PID AP1 PATHWAY) and key COSTAR signature genes. d, Top enriched KEGG terms for differentially expressed genes based on DESeq2 comparisons of NADs vs NEGs (6 h, left) and NADs vs NEGs (22 h, right). Bars represent the number of differentially expressed genes present in the annotation, and colors indicate –log10(false discovery rate). e, Four AP-1 transcription factors that are down-regulated or unchanged after PCY-hit NAD treatment at 6 h. (y-axis, normalized RNA-Seq counts). Box plot groups (x-axis) correspond to drug categories and dots represent the average expression per drug (colored as in Extended Data Fig. 6b). ‘PCY-hit NAD’ and ‘PCY-hit ONCD’ abbreviated to NAD and ONCD, respectively. Two-tailed t-test. f, Transcription factor binding site enrichment analysis of genes that were upregulated in NAD treated cells in Extended Data Fig. 6c (22 h, left). Circles correspond to transcription factor annotations, circle sizes scale with the fraction of genes present in the annotation, and colors indicate –log10(false discovery rate). g, Correlation of average COSTAR signature expression (x-axis) with ex vivo patient neuroactive drug response (y-axis) plotted per drug (color) and time-point (shape). Mean glioblastoma PCY score across patients (n = 27 patients) of neuroactive drugs (n = 11 PCY-hit NADs, n = 3 NEGs) plotted against their corresponding geometric mean expression of AP-1 TFs and BTG1/2 genes as shown in Fig. 5d. Linear regression line with a 95% confidence interval. Pearson correlation coefficient with two-tailed P-value annotated. a, e, Boxplots as in Fig. 1b. Source data
Extended Data Fig. 7
Extended Data Fig. 7. Vortioxetine induces a robust calcium response and alters the electrophysiological properties of glioblastoma cells.
a, ER calcium store release measured by FLIPR assays in LN-229 cells (n = 4 assay plates; n = 18 conditions; n = 12 wells/drug; DMSO and Thapsigargin (TG) positive control, n = 24 wells each). b, Extracellular calcium influx measured by FLIPR assays in F050.C (n = 17 conditions as in Fig. 5f). (*) denote conditions where the median [Ca2+ fold change] < 0. Black line: median value. a, b, Fold change relative to DMSO after drug treatment. Two-tailed t-test against DMSO. P-values adjusted for multiple comparisons by Holm correction. Black line: median value. c, Single-cell-resolved calcium response (ΔF/F0) measured by ratiometric Fura-2 imaging across 6 cell lines (x-axis; n = 3,561 cells total). Mean change in calcium signal immediately after Vortioxtine treatment compared to baseline, each averaged across a 120 s time window. Paired (baseline vs drug treatment) two-tailed Wilcoxon test. d, Calcium response type stratified by the presence (Ψ) or absence (Ø) of oscillatory calcium signaling at baseline (BASE) and Vortioxetine (VORT; 20) treatment. ‘VORT 1-2 Peaks’: non-oscillatory calcium response with 1-2 peaks after VORT treatment. e, Heatmap of single-cell-resolved (rows) calcium response (ΔF/F0) for response type ‘VORT 1-2 Peaks’ across time (x-axis). NR: no response. f, Max (top) and mean (bottom) peak amplitude of ΔF/F0 for type ‘BASE Ψ, VORT Ψ’ (n = 501 cells) displaying oscillatory calcium signaling during both time spans across the 6 cell lines in d. Paired two-tailed t-test. g, Resting membrane potential (Vm) of LN-229 (n = 13) and LN-308 cells (n = 10) measured by whole-cell patch-clamp before (CTRL) and after VORT treatment (10 µM) in matched single-cells (connected by grey lines). Paired two-tailed t-test. h, Representative single-cell current traces for each cell line (LN-229, LN-308) and condition (CTRL, VORT) corresponding to the voltage-clamp protocol (legend). i, Current-voltage characteristics (I-V curves) of LN-229 (n = 13) and LN-308 cells (n = 10) in g, before (CTRL) and after VORT treatment (10 µM) in matched single-cells. Standard error of the mean (SEM) shown as error bars. See Methods for description of summary statistics. j, Relative gene (panels) expression upon siRNA knockdown (columns) normalized to the FLUC negative control siRNA (n = 3 biological replicates; dots). Two-tailed t-test with adjusted P-values after Holm correction. Boxplots as in Fig. 1b. Source data
Extended Data Fig. 8
Extended Data Fig. 8. Vortioxetine induces an immediate and potent AP-1 response as measured by time-resolved transcriptomics, proteomics, and phosphoproteomics.
a, Time-course visualization of AP-1 (PID) and MAPK (KEGG) pathway induction following Vortioxetine treatment (20 µM) in LN-229 cells measured by RNA-Seq (n = 6 time-points) and by proteomics (n = 3 time-points). n = 3 replicates/time-point. Genes selected for visualization are significantly differentially expressed by RNA-Seq at all time-points compared to the first time-point (0 h). Heatmap color scale represents log2(fold change) compared to the 0 h time-point. b, Principal component analysis (PCA) of replicate-averaged RNA-Seq counts following Vortioxetine treatment (20 µM) in LN-229 cells (n = 3 replicates/time-point) colored by time-point. c, Time-point comparisons (left, 3 h vs 0 h; right, 9 h vs 0 h) of proteomics measurements following Vortioxetine treatment (Vort, 20 µM; n = 3 replicates/condition) in LN-229 cells shown as volcano plots of log2(fold change) versus –log10(P-value). Proteins above a –log10(0.05 P-value) threshold are colored in purple. Two-tailed t-test. d, Gene Ontology (GO) gene set enrichment analysis of signed –log10(P-value) of comparisons inc. Bars represent the normalized enrichment score (NES) and colors indicate –log10(false discovery rate). e, Log2(fold change) in protein expression per time-point (rows; relative to 0 h) for the proteins (columns) contributing to enriched GO term “GO:0001216 DNA-binding transcription activator activity” in Extended Data Fig. 8d. AP-1 transcription factors are labeled in red. f, Connected protein-protein interaction network of differentially abundant phosphoproteins upon Vortioxetine treatment (20 µM; n = 3 replicates/condition) in LN-229 cells at any time-point. 22 out of 67 connected and significantly enriched phosphoproteins are shown (asterisks; black labels) with high confidence STRING protein interactions (grey labels). Cluster IDs (node colors) are based on the MCL algorithm with annotated biological pathways. Heatmap depicts protein abundance-normalized phosphopeptide (rows) intensities of JUN and HSPB1 across time-points (columns). Both genes are also significantly upregulated at the transcript level across all time-points. Source data
Extended Data Fig. 9
Extended Data Fig. 9. Single-cell RNA-Seq and immunofluorescence of Vortioxetine-treated glioblastoma patient cells.
a, UMAP projection of 1736 single cells from patient sample P024 upon 3 h of treatment with Vortioxetine (VORT; n = 577 cells; purple; 20 µM) or DMSO vehicle control DMSO; n = 1159 cells; grey). b, Expression levels of the top five marker genes expressed in more than 10% of cells per scRNA-Seq cluster (columns) in Extended Data Fig. 9a. Circle sizes scale with the percent of cells within each cluster expressing each gene. Color scale represents log10(mean+0.1) expression. c, Cell cycle inference for each cluster in Extended Data Fig. 9b using Seurat version 4.3.0. d, Percent of CD45+ immune or NES+ glioblastoma cells expressing AP-1 factors measured by immunofluorescence in glioblastoma patient samples (n = 11 patients) 24 h after DMSO control or Vortioxetine-treatment ex vivo (10 and 20 µM). Patient-matched paired two-tailed t-test (compared to DMSO control) with FDR-adjusted P-values. Boxplots show 25th–75th percentiles with a line at the median; whiskers extend to 1.5 times the interquartile range. Source data
Extended Data Fig. 10
Extended Data Fig. 10. Vortioxetine reduces tumor burden in vivo independent of serotonin modulation and affects tumor invasiveness and long term growth.
a, Representative MRI images of three ZH-161 transplanted mice (columns) after 15 days of drug treatment (Trial II; n = 7 drugs). Tumor perimeters indicated in yellow. b, Quantification of tumor perimeters corresponding to a. Dots: individual mice per drug (columns); Red lines: mean values. Two-tailed t-test. c, Spheroid formation analyzed by the 2D-projected area of the ZH-562 line measured after 12 days of Vortioxetine treatment (0.1-5 µM; n = 45-47 wells/condition). Data is shown as a boxplot, individual data points, and histogram. d, Number of migrated cells in a collagen-based spheroid invasion assay after 36 h of Vortioxetine treatment (2, 3.5, 5 µM) across four glioblastoma cell lines; LN-229 (n = 560-1125 cells/well), LN-308 (n = 137-426 cells/well), ZH-161 (n = 200-574 cells/well), ZH-562 (n = 38-253 cells/well). e, Mean cell migration distance per condition (n = 5 replicate wells) for d. c-e, One-tailed t-test with adjusted P-values after Holm correction. f, Clonogenic survival measured by a resazurin-based cell viability assay after 11-13 days of Vortioxetine treatment (7 concentrations; 0.625-20 µM, n = 6 replicate wells/concentration) across four glioblastoma cell lines; LN-229 (n = 50 cells/well), LN-308 (n = 300 cells/well), ZH-161 (n = 500 cells/well), and ZH-562 (n = 500 cells/well). Dose-response fitted with a two-parameter log-logistic distribution with 95% confidence intervals (grey) and ED50 (dashed lines). g, Representative immunohistochemistry images of brain sections (n = 3 mice/treatment group) stained with human-specific Ki67 and Vimentin (VIM). h, Ki67 tumor intensity normalized to background with n = 3-4 mice (dots) analyzed per group. Two-tailed t-test comparing CITA and VORT treatment to (-) ctrl. i, Vortioxetine ex vivo PCY score (n = 27 patients; prospective cohort) stratified by Ki67 levels and EGFR CNV alterations. Group 2 patients with low Ki67 levels and an absence of EGFR CNV alterations (n = 7/27; 26%) were significantly less likely to respond to Vortioxetine ex vivo compared to Group 1 (Wilcoxon test; P = 0.011). Among the clinical/genetic parameters in Fig. 2d, e, Ki67 and EGFR alterations were the most predictive two parameters based on a regression subset selection for ex vivo Vortioxetine response. c, d, e, i, h, Boxplots as in Fig. 1b. Source data

References

    1. Cancer Genome Atlas Research Network. Comprehensive genomic characterization defines human glioblastoma genes and core pathways. Nature455, 1061–1068 (2008). - PMC - PubMed
    1. Brennan, C. W. et al. The somatic genomic landscape of glioblastoma. Cell155, 462–477 (2013). - PMC - PubMed
    1. Suvà, M. L. et al. Reconstructing and reprogramming the tumor-propagating potential of glioblastoma stem-like cells. Cell157, 580–594 (2014). - PMC - PubMed
    1. Neftel, C. et al. An integrative model of cellular states, plasticity, and genetics for glioblastoma. Cell178, 835–849 (2019). - PMC - PubMed
    1. Klughammer, J. et al. The DNA methylation landscape of glioblastoma disease progression shows extensive heterogeneity in time and space. Nat. Med.24, 1611–1624 (2018). - PMC - PubMed

Substances