. 2025 Jan;31(1):294-305.
doi: 10.1038/s41591-024-03279-x. Epub 2024 Sep 20.

Lipid profiling identifies modifiable signatures of cardiometabolic risk in children and adolescents with obesity

Affiliations

Lipid profiling identifies modifiable signatures of cardiometabolic risk in children and adolescents with obesity

Yun Huang et al. Nat Med. 2025 Jan.

Abstract

Pediatric obesity is a progressive, chronic disease that can lead to serious cardiometabolic complications. Here we investigated the peripheral lipidome in 958 children and adolescents with overweight or obesity and 373 with normal weight, in a cross-sectional study. We also implemented a family-based, personalized program to assess the effects of obesity management on 186 children and adolescents in a clinical setting. Using mass spectrometry-based lipidomics, we report an increase in ceramides, alongside a decrease in lysophospholipids and omega-3 fatty acids with obesity metabolism. Ceramides, phosphatidylethanolamines and phosphatidylinositols were associated with insulin resistance and cardiometabolic risk, whereas sphingomyelins showed inverse associations. Additionally, a panel of three lipids predicted hepatic steatosis as effectively as liver enzymes. Lipids partially mediated the association between obesity and cardiometabolic traits. The nonpharmacological management reduced levels of ceramides, phospholipids and triglycerides, indicating that lowering the degree of obesity could partially restore a healthy lipid profile in children and adolescents.


Conflict of interest statement

Competing interests: The data and paper were prepared while K.S. was employed at the Steno Diabetes Center Copenhagen. In the process of revision and publication, K.S. has started a position at Novo Nordisk. C.L.-Q. has received consultancy fees from Pfizer. C.L.-Q. has received honoraria, travel or speakers’ fees from Biogen and research funds from Pfizer and Novo Nordisk. C.L.-Q. is the director of the company BrainLogia. All of these activities are unrelated to this study. The other authors declare no competing interests.

Figures
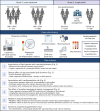
Fig. 1
Fig. 1. Schematic study design.
Lipidomic profiles were measured in 373 children and adolescents with normal weight and 958 with overweight or obesity. We investigated lipid dysregulation in relation to overweight/obesity, cardiometabolic risk profiles, known CVD-related and inflammatory markers, and the predictive ability to detect hepatic steatosis. In addition, lipidomic profiles were measured in a subset of children and adolescents who received nonpharmacological obesity treatment. The lipidome response to BMI SDS reduction and longitudinal associations between lipids and cardiometabolic traits were examined. Mediation and sensitivity analyses were conducted. Created with BioRender.com.
Fig. 2
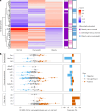
Fig. 2. Overview of the plasma lipidome associated with overweight/obesity.
a, Significant differences were identified in the mean normalized intensities of 142 lipid species across normal weight, overweight and obesity (n = 373, 192 and 766, respectively). Analysis was performed using an analysis of variance (ANOVA), with P values adjusted for multiple testing using the FDR method (P < 5% FDR). Three paired comparisons were subsequently conducted using Tukey’s HSD test. b, Overall, 87 lipid species were associated with overweight/obesity compared to normal weight tested by logistic regression adjusted for age and sex (n = 958 and 373, P < 5% FDR). Bubble plot showing the odds ratio (OR) with error bars representing the 95% CI of lipid species in each lipid class. Gray circles denote nonsignificant associations. The proportion of significant associations (P < 5% FDR, orange denotes positive and blue denotes negative) in each lipid class are shown.
Fig. 3
Fig. 3. The interaction of obesity with age associated lipid species.
a, PLS-DA score plot of lipid species in children with normal weight between three age groups. b, PLS-DA score plot of lipid species in children with overweight or obesity from three age groups. c, Associations between age and 26 lipid species that showed significant obesity (overweight/obesity versus normal weight) interaction (P < 0.05). Linear regression analysis was performed including an interaction term for obesity and adjusting for sex. The β-coefficients with error bars representing 95% CI were shown separately for the normal weight (green) and overweight/obesity group (red). n = 958 and 373 for overweight/obesity versus normal weight. d, Box plot showed the normalized intensities of five lysophospholipids that were most increased in normal weight children among three age groups. Data are presented as median values, box edges are IQR (25th to 75th percentiles) and whiskers represent 1.5 × IQR. An asterisk indicates a significant difference between two groups (P < 0.05). NS, not significant. n = 207, 126 and 40 and 212, 612 and 134 for age group 1, 2 and 3 in the normal weight and overweight/obesity group, respectively.
Fig. 4
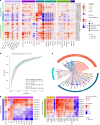
Fig. 4. Associations of lipid species with cardiometabolic risk.
a, The 34 lipids including Cer, SM, PE and PI species having at least one significant association with one cardiometabolic risk feature (P < 5% FDR). Logistic regression analysis was performed adjusting for age, sex and BMI SDS. Their associations with cardiometabolic traits tested by linear regression are shown in parallel. b, The discriminant accuracy of three lipids and liver enzymes for diagnosing hepatic steatosis, defined as liver fat ≥5.0%. The analysis includes data from 479 participants, among whom 71 cases of hepatic steatosis were identified. Each curve is accompanied by its corresponding 95% CI, depicted as a shaded area. The mean AUC values with their respective 95% CI are also provided for each ROC curve. c, Correlations of these cardiometabolic-associated lipid species with CVD and inflammation (INF)-related protein biomarkers were calculated using two-sided Spearman correlation. The size of the link represents the number of significant correlations (Spearman r > 0.2 and P < 5% FDR). Nine sphingolipids correlated with ten CVD markers, one sphingolipid correlated with one INF marker. Ten PEs and PIs correlated with 15 CVD markers and six PEs and PIs correlated with six INF markers. d, Two-sided Spearman correlations are shown. *P < 5% FDR; #P < 2.2 × 10−4. The sample size (n) for each feature/trait is listed in Table 1; the maximum observed is 1,330.
Fig. 5
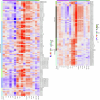
Fig. 5. The effect of nonpharmacological obesity management.
a, BMI SDS reduction was associated with changes in 62 lipids tested by linear regression, adjusting for age, sex and treatment duration (n = 186, P < 5% FDR). The β-coefficients with error bars representing 95% CI are shown. b, Changes in Cers, SMs, PEs and PIs were associated with changes in cardiometabolic traits tested by linear regression, adjusting for age, sex, treatment duration, baseline BMI SDS and change in BMI SDS (P < 5% FDR). BMI SDS reduction was calculated as the difference between BMI SDS at baseline and BMI SDS at follow-up. Changes in lipid profiles and cardiometabolic traits were calculated as the difference between the values at follow-up and those at baseline. +P < 0.05; *P < 5% FDR. c, Alluvial plot to illustrate the overall lipid class inter cohort validation, response to weight loss and proportion of mediation links: 25 validated lipids in seven lipid classes associated with baseline BMI SDS using data from overweight/obesity group in the cross-sectional (n = 958) and baseline data from children with obesity (n = 186) in the intervention study (left). Twenty-two of these lipids in six classes were significantly (P < 5% FDR) decreased with BMI SDS reduction (middle). The significant mediator role of changes in these lipids in the association between changes in BMI SDS and changes in cardiometabolic traits (right, n = 21). The colors of curved lines represent different lipid classes. NA indicates that three lipids, which did not significantly change with BMI SDS reduction, were not applicable for mediation effect. NS, nonsignificant indirect effect from mediation analysis. The sample size (n) for each trait is listed in Supplementary Table 9; the maximum observed is 185.
Extended Data Fig. 1
Extended Data Fig. 1. Associations between 227 lipid species and overweight/obesity.
Logistic regression was performed adjusting for age and sex. The odds ratio (OR) with error bars representing 95% CI of each lipid species are shown. Circles: Gray denotes no significant associations; orange and blue denote positive and negative significant associations adjusted for multiple testing (P < 5% FDR), respectively. n = 958/373 for overweight/obesity and normal weight groups.
Extended Data Fig. 2
Extended Data Fig. 2. Obesity interaction on the association between age and lipid species.
Linear regression analysis was performed including an interaction term for obesity and adjusting for sex. The top 10 lipid species within each directionality of association (10 positive and 10 negative) in normal weight (n = 373) and overweight/obesity (n = 958) groups are labeled.
Extended Data Fig. 3
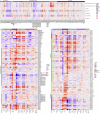
Extended Data Fig. 3. Associations between lipid species and cardiometabolic risk.
a, 135 lipids have at least one significant association (P < 5% FDR) with one risk feature tested by logistic regression, adjusting for age, sex and BMI SDS. b, 207 lipids have at least one significant association (P < 5% FDR) with one trait tested by linear regression, adjusting for age, sex and BMI SDS. An asterisk indicates P < 5% FDR; a hash indicates P < 2.2 × 10−4. The sample size (n) for each feature is listed in Table 1, the maximum observed is 1,330.
Extended Data Fig. 4
Extended Data Fig. 4. Associations between 25 cardiometabolic-associated lipids with 14 traits that showed significant obesity interaction (P < 5% FDR).
Linear regression analysis was performed including an interaction term for obesity (overweight/obesity vs. normal weight) and adjusting for sex. The β-coefficients with error bars representing 95% CI are shown separately for the normal weight (green) and overweight/obesity group (red). The sample size (n) for each trait is listed in Table 1.
Extended Data Fig. 5
Extended Data Fig. 5. The mediation proportion of 83 lipid profiles on the association between obesity and 19 cardiometabolic traits.
Mediation analysis was performed adjusting for age and sex. Each dot represents a significant indirect effect (P < 5% FDR), with dot size indicating the mediation proportion categorized into <5%, 5–10%, 10–20%, and ≥ 20%. Colors denote the direction of effects, with orange indicating positive and blue negative. The sample size (n) for each trait is listed in Table 1.
Extended Data Fig. 6
Extended Data Fig. 6. Lipid changes associated with obesity management.
Sixty-seven lipids showed significant changes (n = 186, P < 5% FDR), 23 decreased (blue) and 44 increased (orange). These changes were tested by a linear mixed model, adjusting for age and sex. The β-coefficients with error bars representing 95% CI were shown.
Extended Data Fig. 7
Extended Data Fig. 7. Associations between BMI SDS reduction and changes in 145 lipid species.
Linear regression analysis was performed adjusting for age, sex, and treatment duration year (n = 186, P < 5% FDR). The β-coefficients with error bars representing 95% CI are shown. BMI SDS loss was calculated by BMI SDS at baseline - BMI SDS at follow-up. Changes in lipid profiles were calculated by value at follow-up - value at baseline.
Extended Data Fig. 8
Extended Data Fig. 8. Associations between changes in 145 lipid species and changes in cardiometabolic traits.
Linear regression analysis was performed adjusting for age, sex, treatment duration, baseline BMI SDS, and change in BMI SDS. A plus sign indicates P < 0.05; an asterisk indicates P < 5% FDR. The sample size (n) for each trait is listed in Extended Data Table 1, the maximum observed is 185.
Extended Data Fig. 9
Extended Data Fig. 9. The proportion mediated by changes of 66 lipid profiles on the association between BMI SDS reduction and changes in eight cardiometabolic traits.
Mediation analysis was performed adjusting for age, sex, and treatment duration. Each dot represents a significant indirect effect, with dot size indicating the mediation proportion categorized into 5–10%, 10–20%, and ≥ 20%. Colors denote the direction of effects, with orange indicating positive and blue negative. BMI SDS reduction was calculated as the difference between BMI SDS at baseline and BMI SDS at follow-up. Changes in lipid profiles and cardiometabolic traits were calculated as the difference between the values at follow-up and those at baseline. The sample size (n) for each trait is listed in Extended Data Table 1.

References

    1. World Health Organization. Obesity and overweight. https://www.who.int/news-room/fact-sheets/detail/obesity-and-overweight (2024).
    1. Jebeile, H., Kelly, A. S., O’Malley, G. & Baur, L. A. Obesity in children and adolescents: epidemiology, causes, assessment, and management. Lancet Diabetes Endocrinol.10, 351–365 (2022). - PMC - PubMed
    1. Loos, R. J. F. & Yeo, G. S. H. The genetics of obesity: from discovery to biology. Nat. Rev. Genet.23, 120–133 (2022). - PMC - PubMed
    1. Maes, H. H., Neale, M. C. & Eaves, L. J. Genetic and environmental factors in relative body weight and human adiposity. Behav. Genet.27, 325–351 (1997). - PubMed
    1. Vajravelu, M. E., Tas, E. & Arslanian, S. Pediatric obesity: complications and current day management. Life10.3390/life13071591 (2023). - PMC - PubMed

MeSH terms

LinkOut - more resources