. 2024 Nov;43(21):4984-5017.
doi: 10.1038/s44318-024-00244-9. Epub 2024 Sep 20.

TBK1-Zyxin signaling controls tumor-associated macrophage recruitment to mitigate antitumor immunity

Affiliations

TBK1-Zyxin signaling controls tumor-associated macrophage recruitment to mitigate antitumor immunity

Ruyuan Zhou et al. EMBO J. 2024 Nov.

Abstract

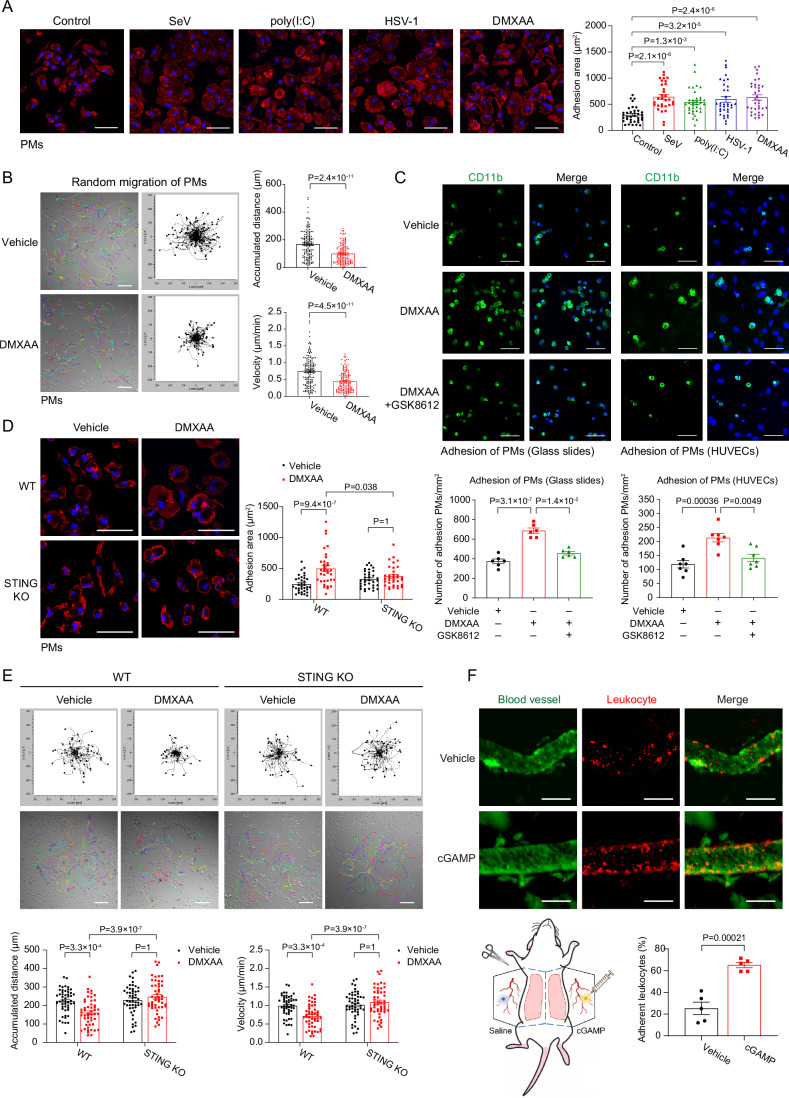
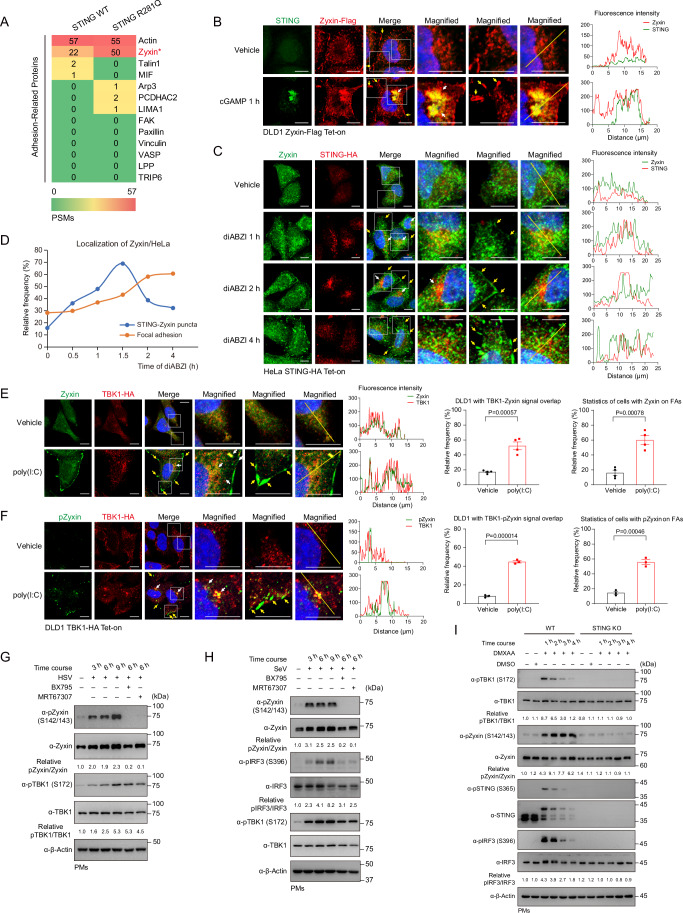
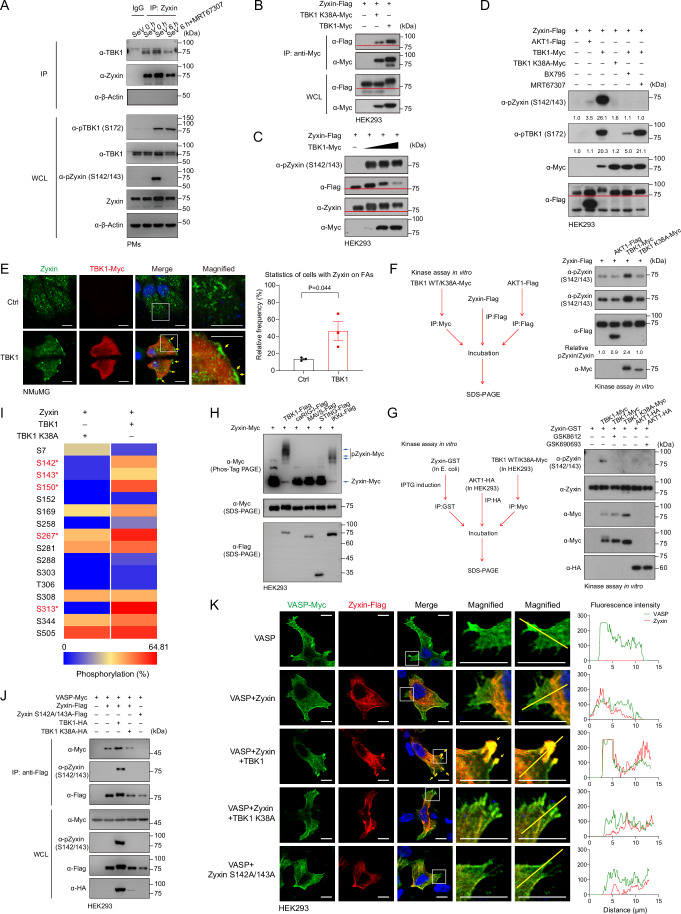
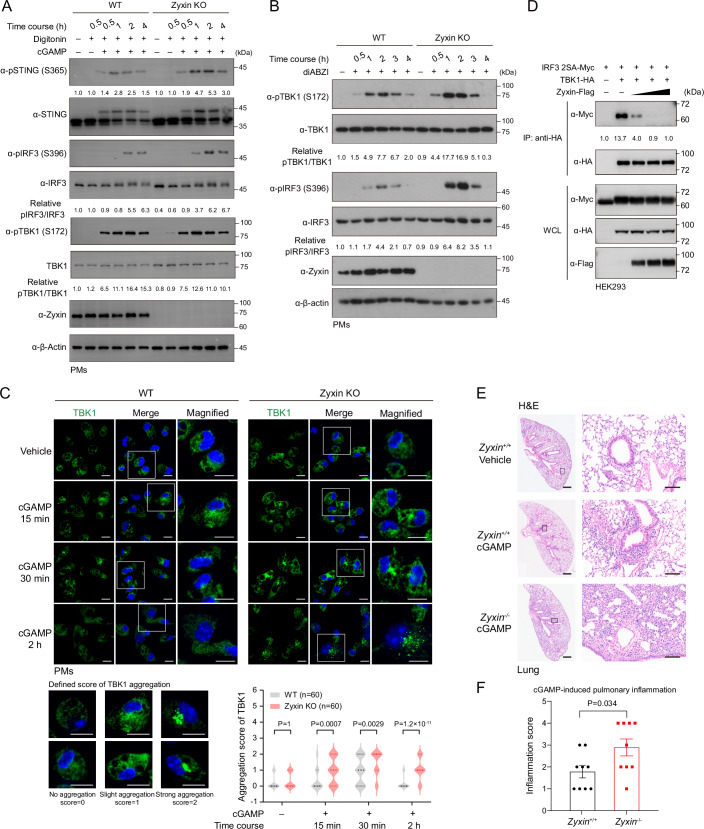
Mechanical control is fundamental for cellular localization within a tissue, including for tumor-associated macrophages (TAMs). While the innate immune sensing pathways cGAS-STING and RLR-MAVS impact the pathogenesis and therapeutics of malignant diseases, their effects on cell residency and motility remain incompletely understood. Here, we uncovered that TBK1 kinase, activated by cGAS-STING or RLR-MAVS signaling in macrophages, directly phosphorylates and mobilizes Zyxin, a key regulator of actin dynamics. Under pathological conditions and in STING or MAVS signalosomes, TBK1-mediated Zyxin phosphorylation at S143 facilitates rapid recruitment of phospho-Zyxin to focal adhesions, leading to subsequent F-actin reorganization and reduced macrophage migration. Intratumoral STING-TBK1-Zyxin signaling was evident in TAMs and critical in antitumor immunity. Furthermore, myeloid-specific or global disruption of this signaling decreased the population of CD11b+ F4/80+ TAMs and promoted PD-1-mediated antitumor immunotherapy. Thus, our findings identify a new biological function of innate immune sensing pathways by regulating macrophage tissue localization, thus providing insights into context-dependent mitigation of antitumor immunity.

Keywords: Antitumor Immunity; Cell Motility; TBK1; Tumor-associated Macrophages; cGAS-STING.


Conflict of interest statement

The authors declare no competing interests.

Figures

Figure 1
Figure 1. Nucleic acid sensing regulates the adhesion and motility of macrophages.
(A) Immunofluorescence imaging and statistics revealed enlarged adhesion areas of primary murine peritoneal macrophages (PMs) upon treatments of SeV (RNA virus, 9 h), poly(I:C) (RNA analogs, 3 h), HSV-1 (DNA virus, 9 h), or DMXAA (murine STING agonist, 1 h), which activated RLR-MAVS-mediated RNA sensing or cGAS-STING-mediated DNA sensing, respectively. DAPI (Blue) and TRITC-conjugated phalloidin (Red) labeled the nucleus and F-actin. Scale bar, 50 μm. Control group, n = 36; SeV group, n = 31; poly(I:C) group, n = 35; HSV-1 group, n = 34; DMXAA group, n = 35. (B) Representative migration plots indicated the movement of PMs upon the treatment of vehicle or DMXAA (10 μg/mL) for 4 h, monitoring by live-cell microscopy (left panel). Statistics of the accumulated distance of cell movement revealed (right panel). Scale bar, 100 μm. n = 150 cells per group. (C) PMs pretreated for 2 h with vehicle or DMXAA (10 μg/mL) in the absence or presence of TBK1 inhibitor GSK8612 (10 μM) were incubated on glass slides (left panel) or HUVECs (endothelial cell line, right panel) for 0.5 h. After washing off non-adherent cells, the remaining macrophages were labeled by anti-CD11b (green). Statistics of PMs attached to the glass slides (n = 6 per group) or HUVECs (n = 7 per group) were displayed. Scale bar, 50 μm. (D) Immunofluorescence imaging and statistics of cell adhesion area were shown in PMs from Sting1+/+ or Sting1−/− (STING KO) mice and upon treatment with DMXAA (10 μg/mL) for 2 h. Scale bar, 50 μm. n = 34 cells per group. (E) Genetic ablation of STING enhanced macrophage motility, as evidenced by representative migration plots and statistics under live-cell microscopy Scale bar, 100 μm. n = 50 cells per group. (F) The murine vessels were visualized with FITC-Dextran, and the leukocytes (rhodamine-6G+) that adhered to the blood vessels were imaged and quantitated in mice injected with saline or cGAMP (5 μg) for 2 h. Scale bar, 100 μm. n = 5 vessels in the injection site for imaged per group. Data information: unless otherwise indicated, n = 3 independent biological experiments (mean ± SEM). *P < 0.05, **P < 0.01, and ***P < 0.001, compared with the control condition (One-way ANOVA test and Bonferroni correction). Source data are available online for this figure.
Figure 2
Figure 2. STING or MAVS signalosomes recruit and phosphorylate Zyxin.
(A) Heatmap represented the mass spectrometry analyses of enriched adhesion-related proteins associating with stably expressed STING, wild-type, or constitutively activated (caSTING, R281Q). Zyxin was an interacting protein of STING in mass spectrometry assays, with a higher affinity to caSTING. (B) Immunofluorescence imaging detected an overlap of the cellular distribution of stably expressed Zyxin in STING signalosomes formed upon cGAMP treatment. cGAMP drove a colocalization of Zyxin into STING aggregates (white arrowed) and focal adhesions (yellow arrowed). Scale bar, 10 μm. (C, D) STING agonist diABZI induced an association of endogenous Zyxin with STING signalosomes (white arrowed) and its sequential distribution into focal adhesions (yellow arrowed) in HeLa cells (C). Statistics for the percentage of total cells of three experiments with Zyxin in STING signalosomes or focal adhesions were shown (D). Scale bar, 10 μm. (E) Upon poly(I:C) stimulation (3 h), immunofluorescence and statistics revealed a signal overlap of endogenous Zyxin with stably expressed TBK1 (white arrowed) or on focal adhesions (yellow arrowed). n = 4 per group. (F) Immunofluorescence and statistics showed pZyxin, revealed by a phospho-Zyxin (S142/S143) antibody, was exclusively colocalized with TBK1 in the puncta (white arrowed) or on focal adhesions (yellow arrowed). Scale bar, 10 μm. n = 3 per group. (G, H) Nucleic acid sensing in PMs, induced by the infections of HSV-1 (G, DNA sensing) or SeV (H, RNA sensing), triggered robust Zyxin phosphorylation at S142/S143 residues. (I) Genetic ablation of STING in primary macrophages abrogated DMXAA-induced phosphorylation of TBK1, STING, IRF3, and Zyxin. Data information: unless otherwise indicated, n = 3 independent biological experiments (mean ± SEM). *P < 0.05, **P < 0.01, and ***P < 0.001, compared with the control condition (One-way ANOVA test and Bonferroni correction). Source data are available online for this figure.
Figure 3
Figure 3. TBK1 directly phosphorylates S143 residue to facilitate Zyxin focal adhesion localization.
(A) Coimmunoprecipitation assay revealed an endogenous complex comprising Zyxin and TBK1 in PMs. Infection of SeV (6 h) enhanced the formation of this complex, while inhibition of TBK1 by MRT67307 (10 μM) attenuated it. (B) Coimmunoprecipitation assay revealed the association of Zyxin and TBK1, either in wild-type or kinase-dead (K38A) form. (C) Ectopic expression of TBK1 in HEK293 cells phosphorylated Zyxin proteins at residues S142/S143 in a dose-dependent manner. (D) Robust signals of pZyxin (S142/S143) were detected in HEK293 cells in the presence of TBK1, compared to AKT1, a kinase reported for phosphorylating Zyxin at S142. pZyxin was abrogated in the presence of specific TBK1 inhibitors BX795 (6 μM) or MRT67307 (10 μM). (E) Immunofluorescence imaging and statistics revealed a localization of Zyxin on focal adhesion driven by TBK1 (yellow arrowed). Scale bar, 10 μm. n = 3 per group. (F, G) An in vitro kinase assay was performed by separately expressed and purified Zyxin from HEK293 cells (F) or bacteria E. coli (G) and purified TBK1 and AKT1, revealing that TBK1 directly phosphorylated S142/S143 residues of Zyxin. TBK1 inhibitor GSK8612, but not AKT1 inhibitor GSK690693, blocked this Zyxin phosphorylation (G). (H) Phos-Tag electrophoresis showed robust phosphorylation of Zyxin when coexpressed with TBK1 or IKKε. (I) Mass spectrometry analyses showed that the phosphorylation of multiple residues on Zyxin proteins was upregulated by active TBK1 (labeled as *), including S142, S143, S150, S267, and S313. (J) Coimmunoprecipitation assay showed that TBK1 enhanced the association of Zyxin with VASP, a core component of focal adhesion. Zyxin S142A/S143A mutation failed to interact with VASP. (K) The subcellular localization of WT Zyxin and the S142A/143A mutant with VASP was visualized by immunofluorescence, promoted on focal adhesion (yellow arrowed) by active TBK1, but attenuated by the S142A/143A mutant. Scale bar, 10 μm. Data information: unless otherwise indicated, n = 3 independent biological experiments (mean ± SEM). *P < 0.05, **P < 0.01, and ***P < 0.001, compared with the control condition (One-way ANOVA test and Bonferroni correction). Source data are available online for this figure.
Figure 4
Figure 4. The TBK1-Zyxin cascade restricts macrophage motility.
(A, B) Immunofluorescence and statistics indicated that SeV infection triggered a focal adhesion location of endogenous Zyxin proteins in macrophages (indicated by the yellow arrows). The phospho-Zyxin (S142/S143) signal, induced by SeV infection, was translocated exclusively into focal adhesions, a process blocked by TBK1 inhibitor MRT67307 (10 μM, 6 h). Scale bar, 20 μm. (B) n = 3 per group. (CF) Immunofluorescence and statistics revealed that DMXAA induced Zyxin aggregations (C, D) and phosphorylation (E, F) on focal adhesions (yellow arrowed), a process entirely blocked in PMs from STING KO mice. Scale bar, 20 μm. (D, F) n = 4 per group. (G, H) Genetic ablation of Zyxin enhanced macrophage motility on the surface of mVCAM Fc-coated glass slides, as evidenced by representative migration plots and statistics under live-cell microscopy in the absence or presence of DMXAA (10 μg/mL, 6 h). Scale bar, 100 μm. (H) n = 50 cells. (I, J) Zyxin+/+ or Zyxin−/− mice were injected with saline or cGAMP (5 μg) for 2 h, and their blood vessels were visualized with FITC-Dextran. Leukocytes (rhodamine-6G+) that adhered to the blood vessels were imaged and quantitated. Scale bar, 100 μm. (J) n = 5 vessels in the injection site for imaged per group. Data information: unless otherwise indicated, n = 3 independent biological experiments (mean ± SEM). *P < 0.05, **P < 0.01, and ***P < 0.001, compared with the control condition (One-way ANOVA test and Bonferroni correction). Source data are available online for this figure.
Figure 5
Figure 5. Zyxin deficiency enhances inflammatory responses.
(AC) Zyxin deficiency promoted cGAMP or diABZI-induced cGAS-STING signaling in PMs moderately (A, B) and stabilized endogenous TBK1 aggregation (C). Scale bar, 10 μm. (C) WT Vehicle group, n = 54; WT cGAMP 15 min group, n = 42; WT cGAMP 30 min group, n = 59; WT cGAMP 2 h group, n = 59; Zyxin KO Vehicle group, n = 40; Zyxin KO cGAMP 15 min group, n = 52; Zyxin KO cGAMP 30 min group, n = 60; Zyxin KO cGAMP 2 h group, n = 58. (D) Coimmunoprecipitation assays to detect the TBK1-IRF3 interaction in the absence or presence of Zyxin, revealing a competitive inhibition of Zyxin on the association of TBK1-IRF3 2SA (a documented IRF3 mutant used to detect subtle TBK1-IRF3 interaction). (E, F) Representative images and statistics showed that Zyxin-deficiency mice with severe symptoms of cGAMP-induced pulmonary inflammation, including the disruption of the alveolar architecture and infiltration of granulocytes. (F) n = 9 per group. Data information: unless otherwise indicated, n = 3 independent biological experiments (mean ± SEM). *P < 0.05, **P < 0.01, and ***P < 0.001, compared with the control condition (One-way ANOVA test and Bonferroni correction). Source data are available online for this figure.
Figure 6
Figure 6. Interventing in STING-TBK1-Zyxin signaling improves antitumor immunity and synergizes with PD-1 immunotherapy.
(AD) B16-F10 melanoma cells were implanted subcutaneously into Zyxin KO or WT C57BL/6 mice with intratumoral injection of cGAMP every 3 days (A). Volumes (B), weights (C), and photos (D) of melanoma revealed that Zyxin deficiency substantially suppressed tumor growth in the B16-F10 melanoma syngeneic model. (B, C) Zyxin+/+ Vehicle group, n = 8; Zyxin−/− Vehicle group, n = 8; Zyxin+/+ cGAMP group, n = 8; Zyxin−/− cGAMP group, n = 9. (E, F) Infiltration of CD4+ and CD8+ T lymphocytes and macrophages (F4/80+) were imaged and evaluated in B16-F10 tumors; Zyxin deficiency diminished the proportion of TAMs but enhanced CD8+ T lymphocytes in melanoma. Scale bars, 20 μm. (F) n = 3 per group. (G, H) Intratumoral CD86+ and CD206+ macrophages (F4/80+) were imaged and evaluated in B16-F10 tumors; Zyxin deletion in mice decreased CD206+ M2-type macrophages but increased CD86+ M1-type macrophages in tumors, which potentially promoted antitumor immunity. Scale bars, 20 μm. (H) n = 4 per group. (IK) Wild-type B16-F10 melanoma cells were implanted subcutaneously into WT or Zyxin KO mice, which were intraperitoneally injected with anti-PD-1 antibodies or vehicle every 3 days. Photos (I), volumes (J), and weights (K) of melanoma showed that anti-PD-1 therapy had a marginal effect on the B16-F10 melanoma syngeneic model in wild-type mice but significantly suppressed tumor growth in Zyxin KO mice. (J, K) Zyxin+/+ Vehicle group, n = 8; Zyxin−/− Vehicle group, n = 9; Zyxin+/+ anti-PD-1 group, n = 8; Zyxin−/− anti-PD-1 group, n = 8. Data information: unless otherwise indicated, n = 3 independent biological experiments (mean ± SEM). *P < 0.05, **P < 0.01, and ***P < 0.001, compared with the control condition (One-way ANOVA test and Bonferroni correction). Source data are available online for this figure.
Figure 7
Figure 7. STING-TBK1-Zyxin signaling retains TAM residency to suppress antitumor immunity.
(A) A clodronate liposome-mediated macrophage depletion strategy was employed in the B16-F10 syngeneic antitumor model. (B, C) B16-F10 melanoma cells were implanted subcutaneously into Zyxin KO or WT C57BL/6 mice and treated with vehicle or clodronate liposomes that depleted macrophage in vivo. The volumes (B) and weights (C) of B16-F10 tumors indicated that macrophage depletion rescued tumor growth arrest phenotypes in Zyxin KO mice. (B, C) n = 10 per group. (DF) Zyxin deletion in B16-F10 tumors failed to influence tumor growth in immunodeficient NSG mice. The photos (D), volumes (E), and weights (F) showed no difference in the growth of WT and Zyxin-deletion B16-F10 in NSG mice, and intratumoral cGAMP injection modestly reduced B16-F10 tumor growth and weight in NSG mice. (E) n = 16 per group. (F) WT Tumor group, n = 16; WT Tumor+cGAMP group, n = 16; mZyxin KO Tumor group, n = 14; mZyxin KO Tumor+cGAMP group, n = 16. (GI) B16-F10 melanoma cells were implanted subcutaneously into Sting1+/+ or Sting1−/− mice with intratumoral injection of cGAMP every 3 days. The photos (G), volumes (H), and weights (I) of B16-F10 tumors indicated that cGAMP-induced antitumor immunity depended on STING. (H) Sting+/+ Vehicle group, n = 6; Sting−/− Vehicle group, n = 11; Sting+/+ cGAMP group, n = 6; Sting−/− cGAMP group, n = 11. (I) Sting+/+ Vehicle group, n = 6; Sting−/− Vehicle group, n = 10; Sting+/+ cGAMP group, n = 6; Sting−/− cGAMP group, n = 10. (J, K) Statistics of tumor weight (J) and immunofluorescence (K) of B16-F10 melanoma from wild-type mice were shown, with or without TBK1 inhibitor (GSK8612). White arrows indicated the pZyxin+F4/80+ macrophages. Inhibition of TBK1 reduced tumor growth, F4/80+ macrophage infiltration, and pZyxin+ cell proportion. Scale bars, 20 μm. (J, K) n = 6 per group. (LN) Statistics showed tumor photos (L), weight (M), and immunofluorescence (N) of B16-F10 melanoma from Irf3+/+;Zyxin+/+, Irf3+/+;Zyxin−/−, Irf3−/−;Zyxin+/+, or Irf3−/−;Zyxin−/− mice. Zyxin deletion induced tumor growth arrest in IRF3 KO mice (L, M). Representative images showed that Zyxin deletion promoted antitumor immunity through downregulated F4/80+ macrophage proportion, a process independent of IRF3 (N). White arrows indicated the pZyxin+F4/80+ macrophages. Scale bars, 20 μm. (M) Irf3+/+;Zyxin+/+group, n = 12; Irf3+/+;Zyxin−/− group, n = 11; Irf3−/−;Zyxin+/+ group, n = 12; Irf3−/−;Zyxin−/− group, n = 10. (N) Irf3+/+;Zyxin+/+group, n = 6; Irf3+/+;Zyxin−/− group, n = 4; Irf3−/−;Zyxin+/+ group, n = 6; Irf3−/−;Zyxin−/− group, n = 4. Data information: unless otherwise indicated, n = 3 independent biological experiments (mean ± SEM). *P < 0.05, **P < 0.01, and ***P < 0.001, compared with the control condition (One-way ANOVA test and Bonferroni correction). Source data are available online for this figure.
Figure EV1
Figure EV1. Nucleic acid sensing regulates the adhesion and motility of macrophages.
(A) THP-1 cells, human monocytes, were differentiated into macrophages with PMA treatment, and their adhesion and migration were analyzed under the effects of SeV (RNA virus), poly(I:C) (RNA analog), HSV-1 (DNA virus), or diABZI (STING agonist). Scale bar, 20 μm. Control group, n = 21; SeV group, n = 21; poly(I:C) group, n = 14; HSV-1 group, n = 17; diABZI group, n = 16. (B) Representative migration plots indicated the movement of PMs upon the treatment of vehicle or poly(I:C). Statistics of the accumulated distance and velocity of cell movement were revealed. n = 50 cells per group. Scale bar, 100 μm. (C) diABZI or poly(I:C) promoted THP-1 adhesion to HUVECs, which was compromised by GSK8612, a TBK1 inhibitor. THP-1 cells were labeled by 5-chloromethyl fluorescein diacetate (CMFDA, green). Scale bar, 20 μm. n = 5 per group. Data information: unless otherwise indicated, n = 3 independent biological experiments (mean ± SEM). *P < 0.05, **P < 0.01, and ***P < 0.001, compared with the control condition (One-way ANOVA test and Bonferroni correction).
Figure EV2
Figure EV2. STING or MAVS signalosomes recruit and phosphorylate Zyxin.
(A) Statistics of cGAMP-induced Zyxin-STING signal overlap in Fig. 2B were shown. n = 3 per group. (B) Immunofluorescence imaging and statistics indicated an association of endogenous Zyxin proteins with STING signalosomes (white arrowed) in response to stimulation and its sequential distribution on focal adhesions (yellow arrowed) in primary macrophages. Scale bar, 5 μm. n = 3 per group. (C) Immunofluorescence and statistics showed diABZI induced an association of endogenous Zyxin with TBK1 signalosomes (white arrowed) and its sequential distribution on focal adhesions (yellow arrowed) in DLD1 cells. Scale bar, 5 μm. n = 3 per group. (D) Poly(I:C)-induced RNA sensing triggered Zyxin phosphorylation at S142/S143 residues in PMs. (E) Genetic ablation of IRF3 in primary macrophages failed to eliminate the DMXAA-induced phosphorylation of TBK1, STING, and Zyxin. (F) mIFNα (100 U, 6 h) or mIFNβ (100 U, 6 h) increased PM adhesion area, which was reversed upon treating anti-INFAR1 neutralizing. Scale bar, 20 μm. Vehicle group, n = 68; mIFNα group, n = 63; mIFNα+Anti-IFNAR1 group, n = 59; mIFNβ group, n = 64; mIFNβ+Anti-IFNAR1 group, n = 65. (G) An elevated level of Zyxin mRNA was detected upon the activation of cGAS-STING signaling at 4 h. n = 4 per group. (H, I) mIFNα (100 U, 6 h) and mIFNβ (100 U, 6 h) induced an increase in mRNA (H) and protein levels of Zyxin (I), which was reversed by an anti-IFNAR1 neutralizing antibody. (H) n = 3 per group. Data information: unless otherwise indicated, n = 3 independent biological experiments (mean ± SEM). *P < 0.05, **P < 0.01, and ***P < 0.001, compared with the control condition (One-way ANOVA test and Bonferroni correction).
Figure EV3
Figure EV3. TBK1 directly phosphorylates S143 residue to facilitate Zyxin focal adhesion localization.
(A) Alphafold predicted the protein structure of human Zyxin proteins, implying an interaction between a long α-helix containing S143 and the C-terminal LIM domain. (B) Zyxin phosphomimetic mutants mimicking TBK1-mediated phosphorylation were individually reconstituted in Zyxin KO HEK293 cells; immunofluorescence imaging and statistics revealed a substantial subset of Zyxin S143D or S142D/S143D mutant localized on focal adhesions (yellow arrowed), in contradiction to wild-type Zyxin. Scale bar, 10 μm. n = 3 per group. (C) Immunofluorescence imaging and statistics indicated the cellular localization of Zyxin truncations in NMuMG cells. n = 3 per group. (D, E) Domain mapping by coimmunoprecipitations between TBK1 or Zyxin truncations showed that the kinase domain of TBK1 (a.a. 1–382) and the LIM domain of Zyxin (a.a. 380–572) were responsible for their mutual interaction. (F) Statistics of Zyxin-VASP signal overlap on focal adhesions in HEK293 cells are shown in Fig. 3K. n = 3 per group. (G, H) The signal overlap of endogenous Zyxin and VASP on focal adhesions (yellow arrowed) in DLD1 cells under TBK1 activation (diABZI or poly(I:C), 4 h) or inhibition (STING inhibitor H151 or TBK1 inhibitor GSK8612), respectively. Scale bar, 10 μm. (H) n = 4 per group. Data information: unless otherwise indicated, n = 3 independent biological experiments (mean ± SEM). *P < 0.05, **P < 0.01, and ***P < 0.001, compared with the control condition (One-way ANOVA test and Bonferroni correction).
Figure EV4
Figure EV4. The TBK1-Zyxin cascade restricts macrophage motility.
(A, B) Statistics revealed that SeV infection upregulated the adhesion area of PMs, blocked by TBK1 inhibitor MRT67307 (A) and dependent on STING (B). (A) Vehicle group, n = 52; SeV group, n = 42; SeV+MRT67307 group, n = 51; (B) WT Vehicle group, n = 38; WT DMXAA group, n = 32; STING KO Vehicle group, n = 31; STING KO DMXAA group, n = 36. (C) Immunofluorescence and statistics revealed the adhesion of Zyxin KO macrophages upon the activation of innate RNA sensing by poly(I:C) transfection. The enhanced cellular adhesion induced by poly(I:C) was attenuated upon Zyxin deletion. Scale bar, 20 μm. WT Vehicle group, n = 18; WT poly(I:C) group, n = 20; WT poly(I:C) + GSK8612 group, n = 25; Zyxin KO Vehicle group, n = 14; Zyxin KO poly(I:C) group, n = 19; Zyxin KO poly(I:C) + GSK8612 group, n = 20. (D) Genetic ablation of Zyxin attenuated STING signaling-enhanced cellular adhesion, as revealed by immunofluorescence imaging and statistics of PMs from Zyxin+/+ or Zyxin−/− mice treated with DMXAA (10 μg/mL, 4 h). Scale bar, 20 μm. n = 50 per group. (E) Macrophage motility inhibited by poly(I:C) transfection was relieved upon Zyxin deletion. Scale bar, 100 μm. WT Vehicle group, n = 49; WT poly(I:C) group, n = 50; Zyxin KO Vehicle group, n = 44; Zyxin KO poly(I:C) group, n = 50. (F, G) Immunofluorescence and statistics indicated Zyxin distribution at focal adhesions (indicated by the yellow arrows), induced by poly(I:C) transfection, was blocked by either TBK1 inhibitor GSK8612 or Zyxin deletion. Scale bar, 20 μm. (F) n = 5 per group. (H, I) Poly(I:C) transfection promoted the adhesion of murine PMs on glass slides and HUVEC, a process restored upon TBK1 inhibition or Zyxin deletion. Scale bar, 50 μm. (I) n = 4 per group. Data information: unless otherwise indicated, n = 3 independent biological experiments (mean ± SEM). *P < 0.05, **P < 0.01, and ***P < 0.001, compared with the control condition (one-way ANOVA test and Bonferroni correction).
Figure EV5
Figure EV5. Zyxin deficiency enhances inflammatory responses.
(A, B) The strategy of generating Zyxin KO mice by CRISPR-mediated genome editing was described (A), and spontaneous skin lesions in 8-month-old Zyxin knockout mice were found (B). (C, D) Poly(I:C)-induced RNA sensing and LPS-induced TLR4 signaling moderately increased pIRF3 (S396) levels in Zyxin-deficient cells. (E) Coimmunoprecipitation assays to detect the TBK1-IRF3 interaction in the absence or presence of Zyxin.
Figure EV6
Figure EV6. Interventing in STING-TBK1-Zyxin signaling improves antitumor immunity and synergizes with PD-1 immunotherapy.
(A) Intratumoral injection of cGAMP induced the signal of phospho-Zyxin (S142/143) in melanoma specimens from WT mice but not STING KO mice. (B, C) Images and statistics showed cGAMP administration in mice induced the phospho-Zyxin mainly in F4/80+ macrophages and, to a lesser extent, in CD4+ T cells (indicated by the white arrows). Scale bars, 50 μm. (C) n = 6 per group. (D) Wild-type or Zyxin KO B16-F10 melanoma specimens in the absence or presence of cGAMP were analyzed by flow cytometry, and statistical results of TAMs (CD11b+ F4/80+) were displayed. Zyxin+/+ Vehicle group, n = 9; Zyxin−/− Vehicle group, n = 9; Zyxin−/− cGAMP group, n = 5. (EG) Knockout of Zyxin compromised the growth of MC38 colon adenocarcinoma in the syngeneic tumor model. (F, G) Zyxin+/+ group, n = 12; Zyxin−/− group, n = 8. (H, I) Immunofluorescence and flow cytometry showed that cGAMP increased pZyxin (S142/143) levels, majorly in myeloid cells (CD11b+) of tumor tissues. STING KO mice showed a decreased proportion of CD11b+pZyxin+ cells. Scale bars, 50 μm. (H) n = 4 per group. (J) Statistics represented the individual abundance of TAMs (CD11b+ F4/80+) and CD8+ T cells in B16-F10 tumors analyzed by flow cytometry, showing a substantially low proportion of TAMs and a high proportion of CD8+ T cells under the combinational condition of Zyxin KO and anti-PD-1 administration. Zyxin+/+ Vehicle group, n = 8; Zyxin−/− Vehicle group, n = 8; Zyxin+/+ anti-PD-1 group, n = 4; Zyxin−/− anti-PD-1 group, n = 5. Data information: unless otherwise indicated, n = 3 independent biological experiments (mean ± SEM). *P < 0.05, **P < 0.01, and ***P < 0.001, compared with the control condition (One-way ANOVA test and Bonferroni correction).
Figure EV7
Figure EV7. STING-TBK1-Zyxin signaling retains TAM residency to suppress antitumor immunity.
(AC) Immunofluorescence imaging and statistics of F4/80+ and pZyxin+ cells in B16-F10 tumors. Administration of clodronate liposomes decreased F4/80+ macrophages and pZyxin signals in B16-F10 tumors. Scale bars, 20 μm. White arrows indicated the pZyxin-positive TAMs. (B, C) n = 4 per group. (DF) Immunofluorescence imaging and statistics of pZyxin (S142/143) and pTBK1 (S172) in B16-F10 tumors transplanted into Sting1flox/flox or Cx3cr1creSting1flox/flox mice were shown, in the absence or presence of intratumoral injected cGAMP. cGAMP administration induced pZyxin and pTBK1 in TAMs, whereas tamoxifen-induced myeloid STING deficiency attenuated pZyxin and pTBK1 puncta in F4/80+ macrophages. White arrows indicated the pTBK1-positive TAMs or pZyxin-positive TAMs. Scale bars, 20 μm. (E, F) n = 4 per group. (G) The diagram: cGAS-STING-Zyxin signaling converts biological signals into mechanical cues to reorganize the actin cytoskeleton that retains tumor-associated macrophages in the tumor microenvironment to mitigate antitumor immunity. Data information: unless otherwise indicated, n = 3 independent biological experiments (mean ± SEM). *P < 0.05, **P < 0.01, and ***P < 0.001, compared with the control condition (One-way ANOVA test and Bonferroni correction).

References

    1. Bakhoum SF, Ngo B, Laughney AM, Cavallo JA, Murphy CJ, Ly P, Shah P, Sriram RK, Watkins TBK, Taunk NK et al (2018) Chromosomal instability drives metastasis through a cytosolic DNA response. Nature 553:467 - PMC - PubMed
    1. Call GS, Chung JY, Davis JA, Price BD, Primavera TS, Thomson NC, Wagner MV, Hansen MDH (2011) Zyxin phosphorylation at serine 142 modulates the Zyxin head-tail interaction to alter cell-cell adhesion. Biochem Biophys Res Commun 404:780–784 - PubMed
    1. Chan CB, Liu X, Tang X, Fu H, Ye K (2007) Akt phosphorylation of Zyxin mediates its interaction with acinus-S and prevents acinus-triggered chromatin condensation. Cell Death Differ 14:1688–1699 - PubMed
    1. Chen C, Xu P (2023) Cellular functions of cGAS-STING signaling. Trends Cell Biol 33:630–648 - PubMed
    1. Chen Q, Boire A, Jin X, Valiente M, Er EE, Lopez-Soto A, Jacob LS, Patwa R, Shah H, Xu K et al (2016a) Carcinoma-astrocyte gap junctions promote brain metastasis by cGAMP transfer. Nature 533:493 - PMC - PubMed

MeSH terms

LinkOut - more resources