

Association between triglyceride glucose body mass index and urinary incontinence: a cross-sectional study from the National Health and Nutrition Examination Survey (NHANES) 2001 to 2018
- PMID: 39304881
- PMCID: PMC11415990
- DOI: 10.1186/s12944-024-02306-7
Association between triglyceride glucose body mass index and urinary incontinence: a cross-sectional study from the National Health and Nutrition Examination Survey (NHANES) 2001 to 2018
Abstract
Background: Urinary incontinence (UI) is a prevalent, health-threatening condition that causes isolation and psychological strain, leading to significant personal distress. The connection between the triglyceride glucose body mass index (TyG-BMI) and UI remains elusive. The purpose of the current research was to investigate any possible relationships between raised TyG-BMI levels and a higher likelihood of UI.
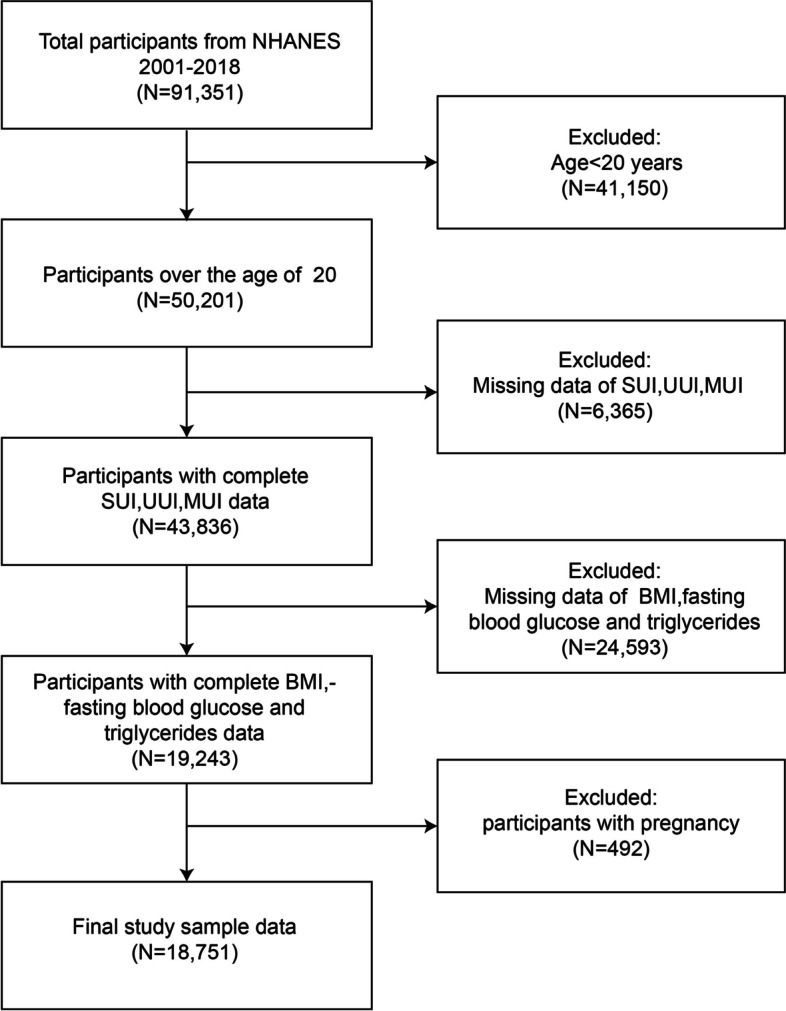
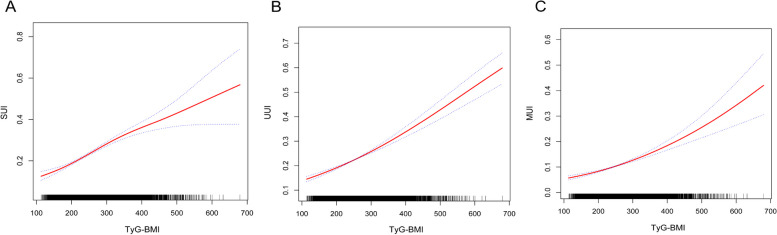
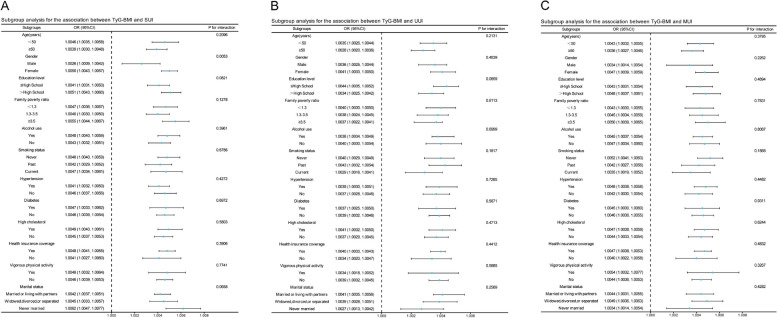
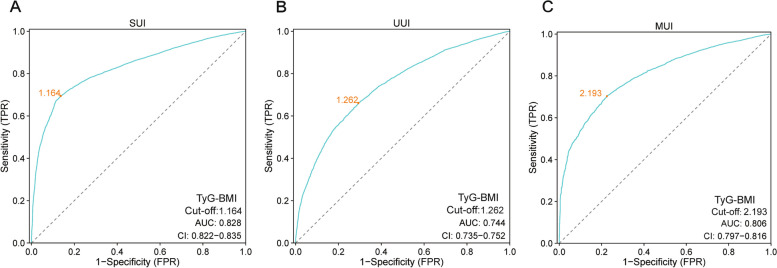
Methods: For a thorough examination, adults 20 years and older with UI were included in cross-sectional research using the data obtained from the National Health and Nutrition Examination Survey (NHANES) from 2001 to 2018. Our investigation centred on three of the significant varieties of UI: Urgent Urinary Incontinence (UUI), Mixed Urinary Incontinence (MUI), and Stress Urinary Incontinence (SUI), employing weighted multivariate logistic regression models for an in-depth evaluation. The TyG-BMI, a possible biomarker, was arranged in increasing order among participants and then assessed with a trend test (P for trend). Moreover, this investigation delved into the non-linear relationships using advanced smoothed curve fitting techniques. Meticulous subgroup analyses were executed to verify the uniformity of the UI and TyG-BMI relationship across diverse demographic groups.
Results: A thorough investigation was conducted with 18,751 subjects to analyze the prevalence and types of UI, showing that 23.59% of individuals suffered from SUI, 19.42% from UUI, and 9.32% from MUI. Considering all possible confounding variables, Multivariate logistic regression analysis showed a substantial relationship between elevated TyG-BMI values and a greater likelihood across all UI categories. Specifically, stratifying the TyG-BMI into quartiles revealed a pronounced positive correlation in the top quartile relative to the bottom, reflected in increased odds ratios for SUI, UUI, and MUI (SUI: OR = 2.36, 95% CI 2.03-2.78, P < 0.0001; UUI: OR = 1.86, 95% CI 1.65-2.09, P < 0.0001; MUI: OR = 2.07, 95% CI 1.71-2.51, P < 0.0001).
Conclusions: Among US adults, an association has been observed wherein increased TyG-BMI values correlate with a higher chance of UI. This suggests that TyG-BMI might be a helpful marker for identifying individuals at risk of UI, providing novel insights into its assessment and management.
Keywords: Cross-sectional study; Insulin resistance; NHANES; Triglyceride glucose body mass index; Urinary incontinence.
© 2024. The Author(s).
Conflict of interest statement
The authors declare no competing interests.
Figures
References
-
- Haylen BT, de Ridder D, Freeman RM, Swift SE, Berghmans B, Lee J, Monga A, Petri E, Rizk DE, Sand PK, Schaer GN. An International Urogynecological Association (IUGA)/International Continence Society (ICS) joint report on the terminology for female pelvic floor dysfunction. Int Urogynecol J. 2010;21:5–26. - DOI - PubMed
-
- Durigon Keller K, La Rosa VL, Cerentini TM, Machado de Souza C, Langlois Costa F, Viana da Rosa P, da Silva Klahr P, de Almeida Pereira E, Telles da Rosa LH. Quality of life and urinary incontinence symptoms in women undergoing bariatric surgery: a combined case-cohort study. Female Pelvic Med Reconstr Surg. 2020;26:e62–7. - DOI - PubMed
-
- Fwu CW, Schulman IH, Lawrence JM, Kimmel PL, Eggers P, Norton J, Chan K, Mendley SR, Barthold JS. Association of obesity, metabolic syndrome, and diabetes with urinary incontinence and chronic kidney disease: analysis of the national health and nutrition examination survey, 2003–2020. J Urol. 2024;211:124–33. - DOI - PubMed
MeSH terms
Substances
LinkOut - more resources
Full Text Sources
Medical
