. 2024 Sep 20;23(1):204.
doi: 10.1186/s12943-024-02110-y.

Developmental interplay between transcriptional alterations and a targetable cytokine signaling dependency in pediatric ETO2::GLIS2 leukemia

Affiliations

Developmental interplay between transcriptional alterations and a targetable cytokine signaling dependency in pediatric ETO2::GLIS2 leukemia

Verónica Alonso-Pérez et al. Mol Cancer. .

Abstract

Background: Several fusion oncogenes showing a higher incidence in pediatric acute myeloid leukemia (AML) are associated with heterogeneous megakaryoblastic and other myeloid features. Here we addressed how developmental mechanisms influence human leukemogenesis by ETO2::GLIS2, associated with dismal prognosis.

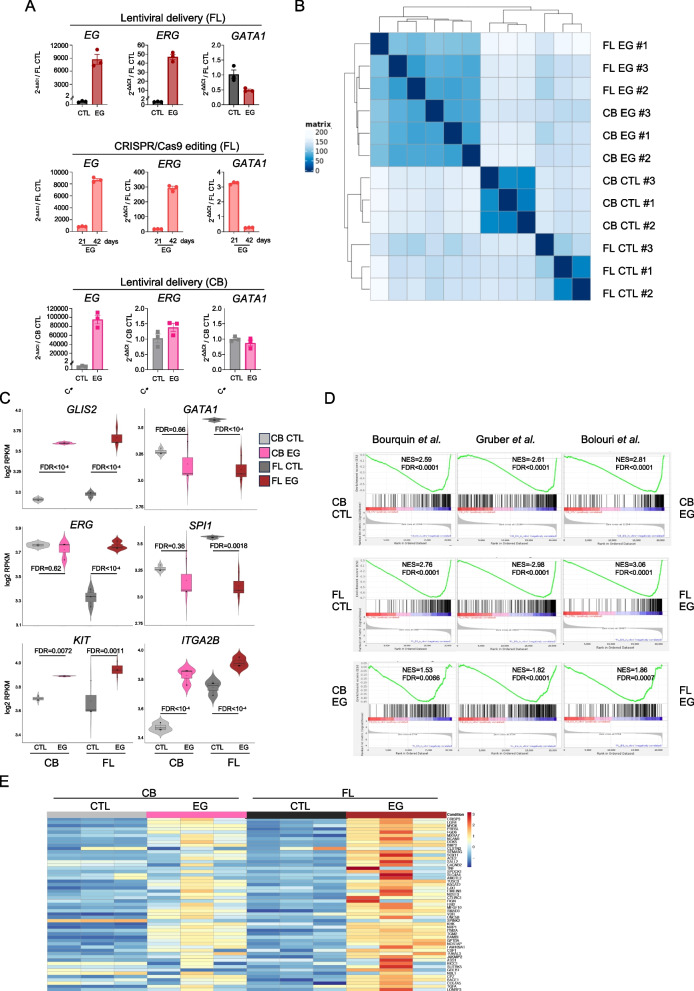
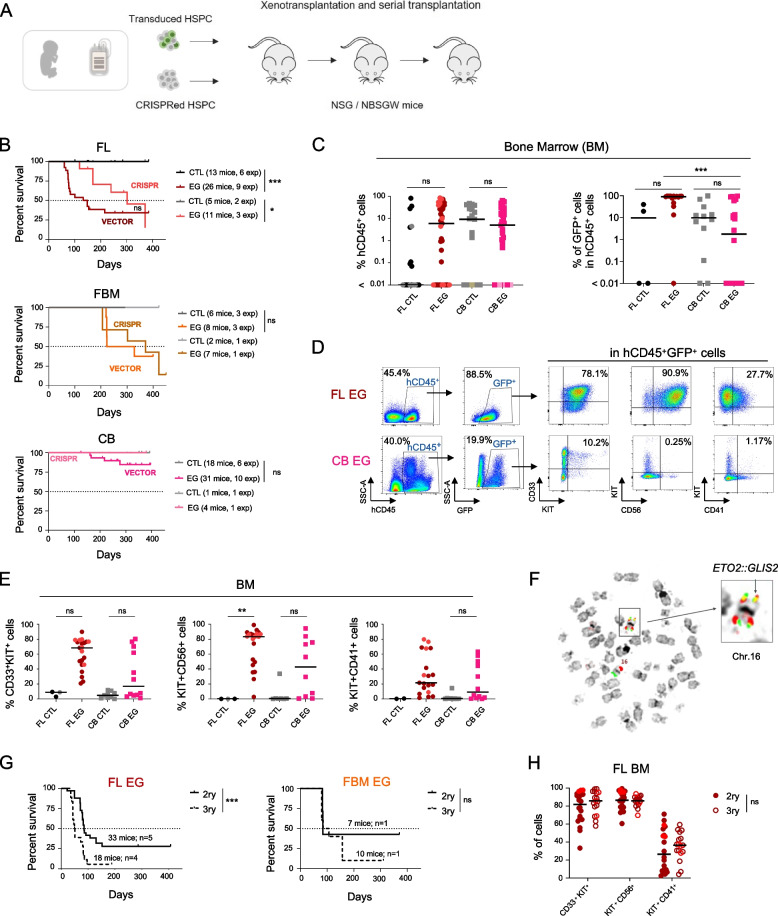
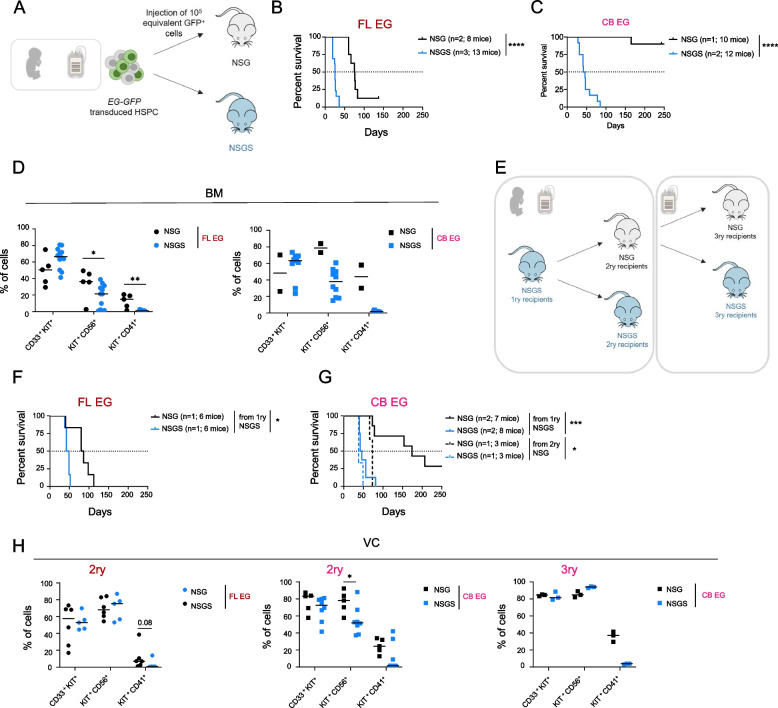
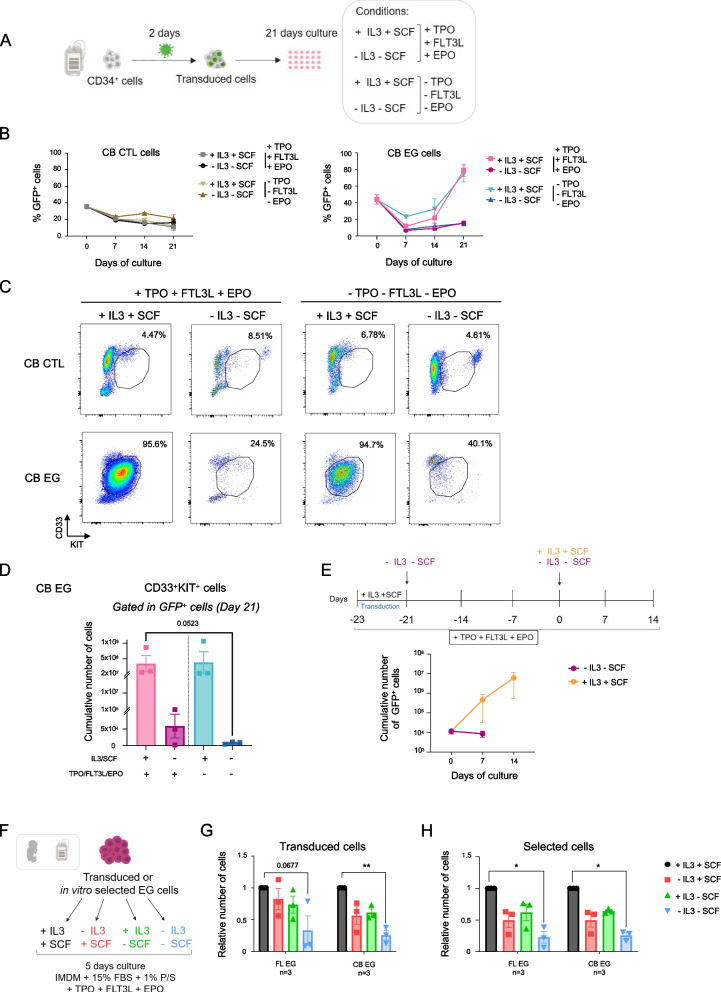
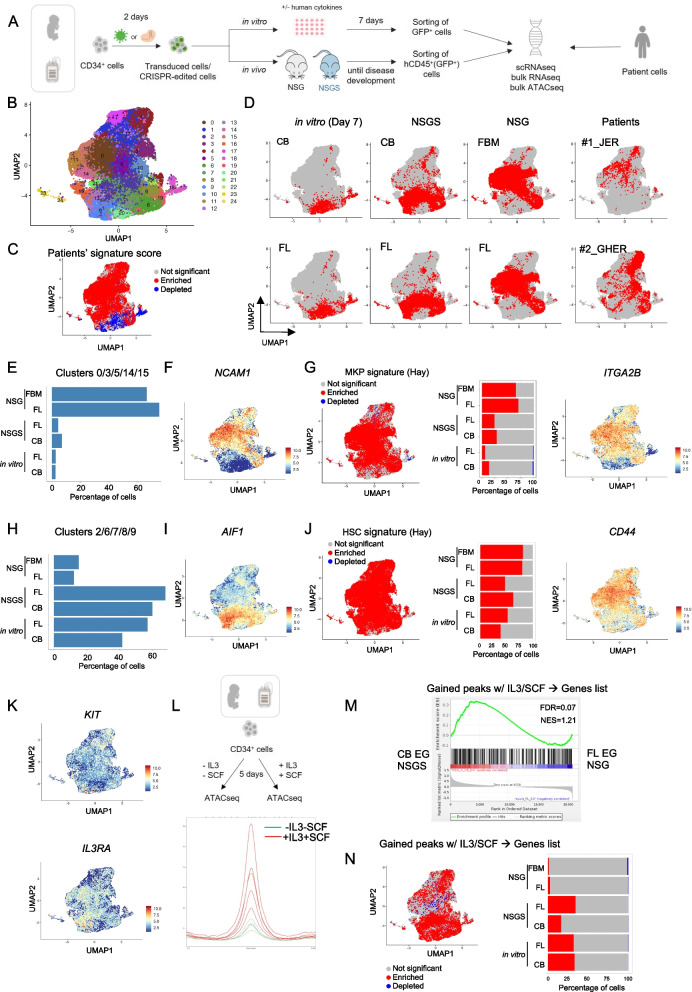
Methods: We created novel ETO2::GLIS2 models of leukemogenesis through lentiviral transduction and CRISPR-Cas9 gene editing of human fetal and post-natal hematopoietic stem/progenitor cells (HSPCs), performed in-depth characterization of ETO2::GLIS2 transformed cells through multiple omics and compared them to patient samples. This led to a preclinical assay using patient-derived-xenograft models to test a combination of two clinically-relevant molecules.

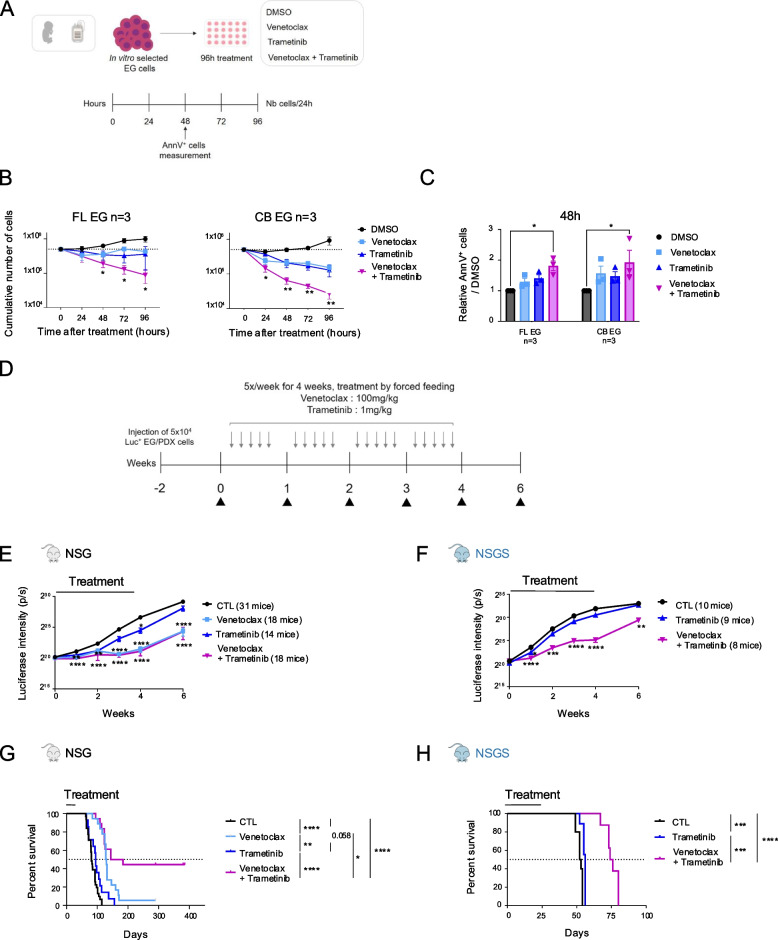
Results: We showed that ETO2::GLIS2 expression in primary human fetal CD34+ hematopoietic cells led to more efficient in vivo leukemia development than expression in post-natal cells. Moreover, cord blood-derived leukemogenesis has a major dependency on the presence of human cytokines, including IL3 and SCF. Single cell transcriptomes revealed that this cytokine environment controlled two ETO2::GLIS2-transformed states that were also observed in primary patient cells. Importantly, this cytokine sensitivity may be therapeutically-exploited as combined MEK and BCL2 inhibition showed higher efficiency than individual molecules to reduce leukemia progression in vivo.

Conclusions: Our study uncovers an interplay between the cytokine milieu and transcriptional programs that extends a developmental window of permissiveness to transformation by the ETO2::GLIS2 AML fusion oncogene, controls the intratumoral cellular heterogeneity, and offers a ground-breaking therapeutical opportunity by a targeted combination strategy.


Conflict of interest statement

The authors declare no competing interests.

Figures

Fig. 1
Fig. 1
ETO2::GLIS2 induces AMKL features in fetal liver and bone marrow, cord blood but not adult HSPCs. A Experimental design to address the impact of the ETO2::GLIS2 (EG) fusion gene on fetal, early post-natal and adult HSPCs. CD34+ cells were isolated from fetal liver (FL), fetal bone marrow (FBM), cord blood (CB), allogenic bone marrow (ABM) and mobilized peripheral blood (mPB) mononuclear cells. EG expression was induced by lentiviral vector delivery (GFP+ cells) or engineered from the endogenous loci by CRISPR/Cas9. Control (CTL) and EG-expressing cells were tested in long-term liquid culture (LT-LC) and colony forming unit assay (CFU), and transcriptomic analysis was performed at different stages of LT-LC. B Cumulative number of total cells (upper panels) and percentage of GFP+ cells (lower panels) of CTL and EG-transduced FL (n = 9 samples, ≥ 3 biological replicates/time point, except %GFP in CTL, 42 days, n = 1), FBM (n = 4 samples, ≥ 2 biological replicates/time point, except %GFP in CTL, 35 days, n = 1), CB (n = 9, ≥ 5 biological replicates/time point), ABM (n = 2, 2 biological replicates/time point, except 7, 28, 42 days, n = 1) and mPB (n = 2, 2 biological replicates/time point) CD34+ cells during LT-LC. Mean ± SEM of biological replicates is shown. C Representative flow cytometry analysis of CD33, KIT, CD56 and CD41 expression in EG and CTL GFP+ FL, FBM and CB cells at day 21 of LT-LC. CD56 and CD41 expression are gated in CD33+KIT+ cells (D) EG fusion frequency assessed by PCR amplification of EG derivative at 2 days (Donor (FL) 1) and 3 days (Donor (FL) 2) after electroporation. PCR were performed in duplicates on DNA dilutions starting from 50 ng DNA (≈ 8 000 cells) to 0.3 ng DNA (≈ 50 cells) [30]. E Cumulative number of CD33+KIT+ cells along culture of CRISPR-edited inv(16) FL CD34+ cells. Mean of technical triplicates is shown for each FL donor (CTL n = 1, EG n = 2). F Representative flow cytometry analysis of CD33, KIT, CD56 and CD41 expression on CRISPR-edited inv(16) FL EG CD34+ cells at day 40–44 of LT-LC. CD56 and CD41 expression are gated in CD33+KIT+ cells (G) May-Grünwald Giemsa stained cytospins from FL cultures (CTL and EG-transduced and EG-engineered cells) at day 20 of LT-LC. Magnification: × 40. H Colony potential assessment upon culture of 500 (P1, CD34+) or 50,000 (P2-4) CTL and EG-FL (n = 8), FBM (n = 3), CB (n = 4) and ABM (n = 2) cells in semi-solid methylcellulose culture medium. Serial replating was performed every 12 to 14 days. P1: first passage, P2: secondary, P3: tertiary, P4: quaternary. Mean ± SEM of biological replicates is shown. Statistical significance is indicated as p values (B and H: Mann–Whitney non parametric test). *: p < 0.05, **: p < 0.01
Fig. 2
Fig. 2
ETO2::GLIS2 differentially modifies the gene expression profile of fetal liver and cord blood HSPCs in long-term liquid culture. A Quantitative RT-PCR expression of EG, ERG and GATA1. Upper panel: control (CTL) and EG-transduced CD34+ FL cells cultured for 22 days. Middle panel: CRISPR-edited CD34+ FL cells cultured for 21 and 42 days. Lower panel: CTL and EG-transduced CD34+ CB cells cultured for 47 days. Mean ± SEM of technical triplicates is shown (n = 1). B Clustering of RNAseq data obtained from EG-transduced FL and CB CD34+ cells after 37–78 days of culture. Control (CTL) cells are 0–3 days cultured CD34+ FL or CB cells. C Violin plot representation of gene expression extracted from the RNAseq normalized expression table. Same conditions as in (B). D Gene Set Enrichment Analysis (GSEA) using EG patient highly expressed gene signatures from 3 independent expression analysis [8, 16, 37]. The compared conditions are indicated on each side of the panel, respectively. Same conditions as in (B). E Within genes common to at least two of the three patients signature lists indicated in (D), the heatmap represents those that are more highly expressed in EG FL vs EG CB cells
Fig. 3
Fig. 3
ETO2::GLIS2 expression induces leukemic transformation in FL HSPCs in vivo. Experimental design of in vivo experiments. EG-expressing FL, FBM and CB HSPCs (via lentiviral vectors delivery or CRISPR/Cas9-editing) were injected into NSG mouse strains following 2–11 days of culture. Mice were monitored daily and sacrificed when exhibiting disease symptoms. Recovered cells from primary (1ry) recipients were serially transplanted into secondary (2ry) and tertiary (3ry) recipients. Phenotypic and transcriptomic analysis were performed on the recovered cells and murine organs were assessed by histological analysis. B Kaplan–Meier survival plot of 1ry recipients injected with FL, FBM and CB CTL vs EG cells. Median survival of mice with FL EG-transduced and CRISPR-edited cells are 141 days and 302 days respectively, 275.5 and 371 days for FBM EG-transduced and CRISPR-edited cells respectively. C Percent of hCD45+ (left panel) and GFP+ cells (gated in hCD45+ cells) (right panel) measured in the BM of 1ry mice injected with CTL and EG FL and CB cells. Data from mice with CRISPR/Cas9-edited (GFP) cells are presented in light red (left panel). D Representative flow cytometry analysis of cells recovered from the vertebral column (VC) of 1ry recipients injected with FL and CB EG cells (lentiviral delivery). E Percent of CD33+KIT+, KIT+CD56+ and KIT+CD41+ cells in the BM of 1ry mice, gated in hCD45+(GFP+) cells. CRISPR/Cas9-edited (GFP) cells are shown in light red. F Fluorescent in-situ hybridization (FISH) analysis of human cells recovered from a 1ry sick NSG recipient injected with FL EG-CRISPR/Cas9-edited cells. G Kaplan–Meier survival plot of mice serially transplanted with 1 × 106 FL EG cells and FBM EG cells. Median survival of 2ry recipients was 85 and 84 days for FL and FBM groups respectively. Median survival of 3ry recipients was 50 and 96 days for FL and FBM groups respectively. H Percent of CD33+KIT+, KIT+CD56+ and KIT+CD41+ cells in BM of 2ry and 3ry mice injected with FL EG cells, gated in hCD45+(GFP+ or GFP (Inv(16) engineered)) cells. Data of mice with CRISPR/Cas9-edited (GFP) cells are presented in light red. Statistical significance is indicated as p values (B and G: Log-rank test, C and E: Kruskal–Wallis test, H: Mann–Whitney test). *: p < 0.05, **: p < 0.01, ***: p < 0.001. ns, non significant
Fig. 4
Fig. 4
EG-expressing cord blood cells are dependent on IL3 and/or SCF signaling for leukemic transformation in vivo, while FL EG cells show sensitivity. A Experimental design: EG-transduced FL or CB CD34+ cells (105 GFP+ equivalent cells) were injected side-by-side in NSG and NSGS mice. Mice were monitored daily and sacrificed when exhibiting disease symptoms as in Fig. S2. B-C Kaplan–Meier survival plot of primary recipient mice injected with FL EG (B) and CB EG (C). Median survival of mice injected with FL EG cells was 75.5 days in NSG and 25 days in NSGS recipients. For the CB EG group, the median survival was 44 days in NSGS recipients. Only 1/10 mice got sick in the NSG group. D Percent of CD33+KIT+, KIT+CD56+ and KIT+CD41+ cells gated in hCD45+GFP+ cells in the BM of primary recipient mice injected with FL EG (left panel) and CB EG (right panel) cells. E Design of serial transplantation, 105 GFP+ equivalent cells from primary NSGS recipients were transplanted side-by-side into secondary NSG and NSGS mice. Propagation of CB EG leukemia was further tested by transplantation of cells from 2ry NSG mice into tertiary NSG or NSGS mice. F-G Kaplan–Meier survival plot of serially transplanted mice injected with FL-derived (F) and CB-derived (G) grafts. Median survivals were 83 and 45.5 days for NSG and NSGS recipients of 2ry FL EG cells. Median survivals were 174 and 44 days for NSG and NSGS recipients of 2ry CB EG recipients, and 73 and 38 days for NSG and NSGS recipients of 3ry CB EG recipients. H Same analyses as in (D), but in the BM of vertebral columns (VC) of mice from (F-G). Statistical significance is indicated as p values (B-C, F-G: Log-rank test, D, H: Mann–Whitney test). *: p < 0.05, **: p < 0.01, ***: p < 0.001
Fig. 5
Fig. 5
EG-expressing FL and CB cells have a growth dependency on IL3 and SCF human cytokines. A Experimental design: CB CD34+ cells were transduced with CTL/EG-GFP lentiviral vectors and cultured for 21 days in the indicated cytokine conditions. B Percent of GFP+ cells during the culture for CTL (upper panel) and EG (lower panel) cells. Mean ± SEM of 3 biological replicates is shown. C Example of flow cytometry dot plots showing the percent of CD33+KIT+ cells obtained after 21 days of culture in the different cytokine conditions. D Cumulative cell numbers of CD33+KIT+ cells in GFP+ CB EG cells at day 21 of culture. Mean ± SEM of 3 biological replicates is shown. E Experimental design: freshly transduced CB EG CD34+ cells were cultured for 21 days with TPO/FLT3L/EPO and without IL3/SCF. At that time point, IL3 and SCF were added or not to the culture medium and cells were grown for 14 more days (upper panel). Lower panel shows the mean ± SEM cumulative number of GFP+ cells of 3 biological replicates. F Experimental design: FL and CB EG cells were deprived of IL3 and/or SCF during 5 days of culture, after transduction or after their in vitro selection. The number of cells was counted at day 5 of culture ± cytokines. G Absolute numbers of EG GFP+ cells generated from transduced cells after transduction (condition with TPO/FLT3L/EPO). Mean ± SEM of 3 biological replicates. H Absolute numbers of EG GFP+ cells from in vitro selected EG cells. Mean ± SEM of 3 biological replicates. Statistical significance is indicated as p values (B,D,G,H: Kruskal–Wallis test, E: Mann–Whitney test). *: p < 0.05, **: p < 0.01
Fig. 6
Fig. 6
The cytokine stimulation controls ETO2::GLIS2 leukemia cellular and molecular features. A Experimental design: Fetal or CB CD34+ EG transduced or CRISPR-edited cells were either cultured for 7 days in the LT-LC medium (± IL3/SCF) or injected into sublethally irradiated NSG or NSGS mice. After 7 days of culture or at disease development in vivo, EG cells were collected and live hCD45+(GFP+) cells were sorted prior to single cell and bulk transcriptome analysis. Patient cells (n = 4) were also analysed by scRNAseq. B UMAP representation of the integration of cells from all conditions and cluster identification. Clusters were defined using the Louvain algorithm. C Score of enrichment of the gene signature [8] upregulated in ETO2::GLIS2 patients projected on the UMAP of the integration (red: cells presenting an enrichment of the signature; blue: cells with a depletion of the signature; grey: lack of significance). D Cells from each condition are highlighted in red on the UMAP of the integration. E Percentage of cells in clusters 0 + 3 + 5 + 14 + 15 for each condition. F Projection of the level of expression of NCAM1 on cells of the integration. G Left panel: score of enrichment of a megakaryocyte progenitor gene signature (MSigDB, Hay et al., [63]) on the integration. Middle panel: percentage of cells presenting enrichment of the signature (red). Right panel: projection of the level of expression of ITGA2B on cells of the integration. H Percentage of cells in clusters 2 + 6 + 7 + 8 + 9 for each condition. I Projection of the level of expression of AIF1 on cells of the integration. J eft panel: score of enrichment of a HSC gene signature (MSigDB, Hay et al., [63]) on the integration. Middle panel: percentage of cells presenting enrichment of the signature (red). Right panel: projection of the level of expression of CD44 on cells of the integration. K Projection of the level of expression of KIT and IL3RA on cells of the integration. L Upper panel: experimental design of the ATACseq approach. Lower panel: histogram representation of the intensity at loci that present gained accessibility in + IL3 + SCF vs –IL3-SCF cells. M Peaks differentially gained in (L) were annotated to the closest gene. The corresponding gene list was used to compared bulk RNAseq data from leukemic cells in CB NSGS vs FL NSG using GSEA. N Score of enrichment of the gene list used in (M) projected on the integration
Fig. 7
Fig. 7
EG leukemogenic dependency on cytokines can be targeted by inhibiting signal transduction and survival pathways. A In vitro experimental design: FL and CB EG in vitro selected cells were treated with DMSO, Venetoclax (0.1 µM), Trametinib (0.1 µM) or the combination of both. Cells were counted every 24 h after treatment and cell death was measured at 48 h. B Cumulative number of FL EG (left panel) and CB EG (right panel) cells during 96 h control in presence of the inhibitors. Mean ± SEM of 3 biological replicates is shown. C Relative percentage of apoptotic (AnnV+) cells at 48 h of treatment. Mean ± SEM of 3 biological replicates. D In vivo experimental design: 5 × 104 PDX luciferase-expressing cells injected NSG (3 pooled experiments) or NSGS (1 experiment) mice were treated for four weeks, five times a week, with Venetoclax (100 mg/kg), Trametinib (1 mg/kg) or the combination of both molecules. Arrowheads indicate timing of the imaging of the luciferase-expressing PDX leukemic cells. Leukemia development was monitored by bioluminescence tracking and mice were euthanized upon disease symptoms detection. E–F Follow up of luciferase intensity in photon per second (p/s) during and after treatment of NSG (E) and NSGS (F) mice. Mean ± SEM of the indicated number of mice per group is shown. G Kaplan–Meier survival plot of NSG mice after treatment. Median survival was 81 days for the sham treated (CTL) group, 129 days for Venetoclax alone, 95 days for the Trametinib alone and 164 days for the combination group. H Kaplan–Meier survival plot of NSGS mice after treatment. Median survival was 52.5 days for the CTL group, 56 days for the Trametinib alone group and 75 days for the combination group. Statistical significance is indicated as p values (B-C-E–F: Kruskal–Wallis test, G-H: Log-rank test). *: p < 0.05, **: p < 0.01, ***: p < 0.001, ****: p < 0.0001

References

    1. de Rooij JDE, Zwaan CM, van den Heuvel-Eibrink M. Pediatric AML: From Biology to Clinical Management. J Clin Med. 2015;4:127–49. - PMC - PubMed
    1. Greaves M. A causal mechanism for childhood acute lymphoblastic leukaemia. Nat Rev Cancer. 2018;18:471–84. - PMC - PubMed
    1. Wiemels JL, Xiao Z, Buffler PA, Maia AT, Ma X, Dicks BM, et al. In utero origin of t(8;21) AML1-ETO translocations in childhood acute myeloid leukemia. Blood. 2002;99:3801–5. - PubMed
    1. McHale CM, Wiemels JL, Zhang L, Ma X, Buffler PA, Feusner J, et al. Prenatal origin of childhood acute myeloid leukemias harboring chromosomal rearrangements t(15;17) and inv(16). Blood. 2003;101:4640–1. - PubMed
    1. Schlosser M-P, Bucking S, Lemyre B, Grynspan D, Padmore R, Johnston D. Prenatally Diagnosed Infant AML. J Pediatr Hematol Oncol. 2018;40:238. - PubMed

LinkOut - more resources