. 2024 Sep 21;81(1):410.
doi: 10.1007/s00018-024-05409-7.

Involvement of extracellular vesicle microRNA clusters in developing healthy and Rett syndrome brain organoids

Affiliations

Involvement of extracellular vesicle microRNA clusters in developing healthy and Rett syndrome brain organoids

Nasim Bahram Sangani et al. Cell Mol Life Sci. .

Abstract

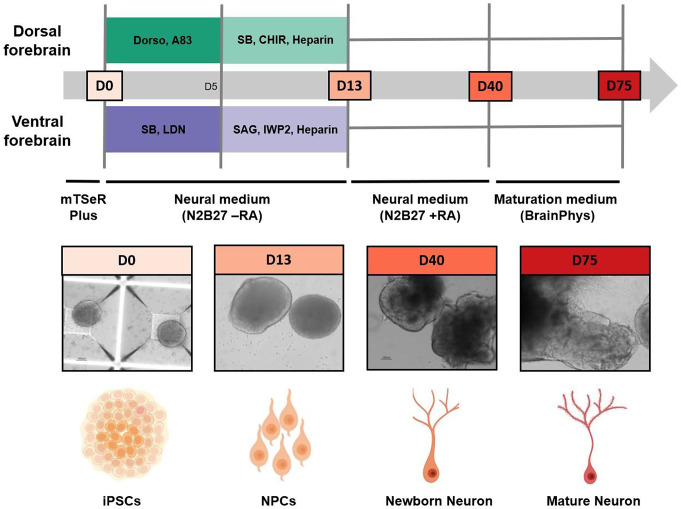
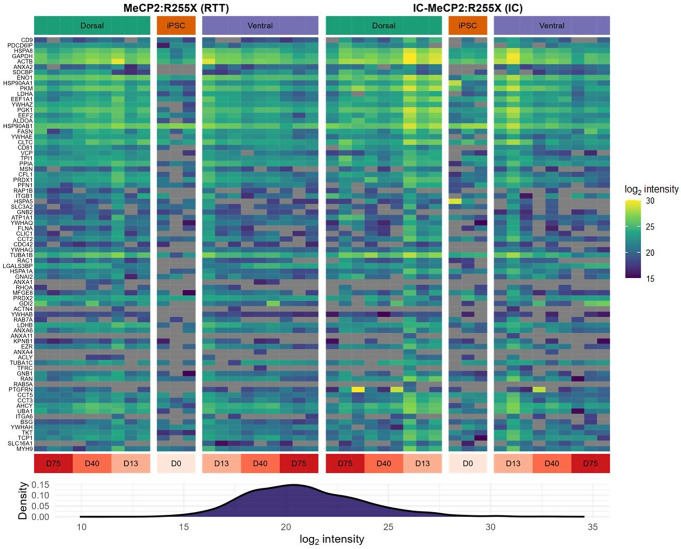
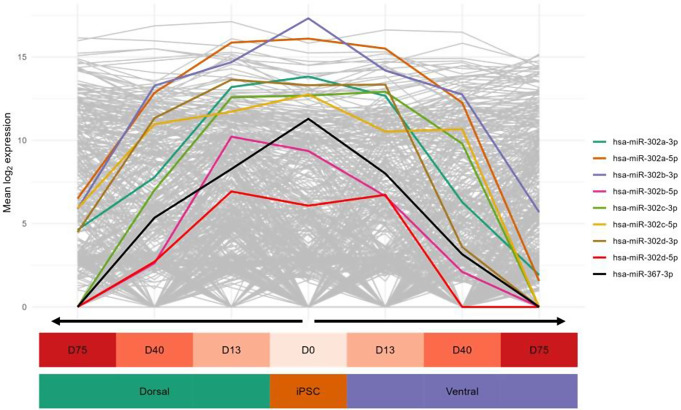
Rett syndrome (RTT) is a neurodevelopmental disorder caused by de novo mutations in the MECP2 gene. Although miRNAs in extracellular vesicles (EVs) have been suggested to play an essential role in several neurological conditions, no prior study has utilized brain organoids to profile EV-derived miRNAs during normal and RTT-affected neuronal development. Here we report the spatiotemporal expression pattern of EV-derived miRNAs in region-specific forebrain organoids generated from female hiPSCs with a MeCP2:R255X mutation and the corresponding isogenic control. EV miRNA and protein expression profiles were characterized at day 0, day 13, day 40, and day 75. Several members of the hsa-miR-302/367 cluster were identified as having a time-dependent expression profile with RTT-specific alterations at the latest developmental stage. Moreover, the miRNA species of the chromosome 14 miRNA cluster (C14MC) exhibited strong upregulation in RTT forebrain organoids irrespective of their spatiotemporal location. Together, our results suggest essential roles of the C14MC and hsa-miR-302/367 clusters in EVs during normal and RTT-associated neurodevelopment, displaying promising prospects as biomarkers for monitoring RTT progression.

Keywords: Brain organoids; Extracellular vesicles; Hsa-miR-302/367 cluster; MicroRNA, chromosome 14 miRNA cluster; Rett syndrome.


Conflict of interest statement

The authors NBS, JK, LMGC, CPR and LMTE are inventors to a patent application that is owned by Maastricht University and that describes miRNAs in neurodevelopmental disorders.

Figures

Fig. 1
Fig. 1
Overview of the applied methodology. Extracellular vesicle miRNA and protein expression data from dorsal and ventral forebrain organoids were collected at four time points, corresponding to the different developmental stages. At day 0 (D0) human iPSCs are seeded in microwell plates to form aggregates. At day 13 (D13) neural progenitor cells (NPCs) as well as neural rosettes appear. At day 40 (D40) of differentiation, newborn neurons of deep cortical layers VI and V emerge. Finally, at day 75 (D75) neurons are mature and fully functional. At this stage, dorsal forebrain cells resemble glutamatergic (excitatory) neurons while cells from the ventral forebrain mimic GABAergic (inhibitory) neurons. Brain organoids also contain astrocytes and glial cells, however, they are not schematically represented here. Photos are representative images taken at each time point. Schematic visualization was created using BioRender.com
Fig. 2
Fig. 2
Protein expression of the top 100 ExoCarta exosomal markers. The heatmap shows the normalized log2 intensity at different time points (day 0 - day 75) of the top 100 ExoCarta exosomal markers with a detectable expression in at least one sample. The proteins are ordered from top to bottom according to their rank in ExoCarta. The predominantly yellow color on the top of the heatmap indicates that the highly ranked exosomal markers have a high expression in our samples. To give context to the expression level of the exosomal markers, the density plot of the distribution of the log2 intensities of all LCMS-identified proteins in all samples is shown at the bottom
Fig. 3
Fig. 3
miRNAs with a dynamic temporal expression profile in IC samples. The heatmap shows the standardized (zero centered) expression (log2 CPM) of 20 miRNAs (vertical axis) for each replicate per region and time point (horizontal axis) in the IC samples. The shown miRNAs are significantly differentially expressed (FDR-adjusted P value < 0.05) between at least two time points in the ventral and/or dorsal region (see color bar on the left). The yellow and pink clusters include miRNAs with a, respectively, decreasing and increasing expression over time, while the gray cluster encompasses the remaining miRNAs
Fig. 4
Fig. 4
Expression of the hsa-miR-302/367 cluster over time in IC samples. The mean expression (log2 CPM) per time point and region is shown for all members of the hsa-miR-302/367 cluster in the IC samples. All members show a decreasing expression over time. The gray lines in the background are the expression patterns of all other miRNAs
Fig. 5
Fig. 5
Heatmap of differentially expressed miRNAs. The log2FC per time point and region are shown for the miRNAs with a significantly different expression between RTT (MeCP2:R255X) and IC in at least one time point. The black border indicates statistical significance (i.e., FDR-adjusted P value < 0.05). The color bar on the left indicates whether the corresponding miRNA is part of the chromosome 14 miRNA cluster (C14MC)
Fig. 6
Fig. 6
Expression of miRNAs from the chromosome 14 miRNA cluster (C14MC). Mean expression per time point and region is shown for the genomic location of members of the C14MC (genome build: GRCh38). There is an overall elevated expression among the C14MC members in the RTT (MeCP2:R255X) samples
None

References

    1. Amir RE, Van den Veyver IB, Wan M, Tran CQ, Francke U, Zoghbi HY (1999) Rett syndrome is caused by mutations in X-linked MECP2, encoding methyl-CpG-binding protein 2. Nat Genet 23:185–188 - PubMed
    1. Bedogni F, Gigli CC, Pozzi D, Rossi RL, Scaramuzza L, Rossetti G, Pagani M, Kilstrup-Nielsen C, Matteoli M, Landsberger N (2016) Defects during Mecp2 null embryonic cortex development precede the onset of overt neurological symptoms. Cereb Cortex 26:2517–2529 - PubMed
    1. Lancaster MA, Renner M, Martin CA, Wenzel D, Bicknell LS, Hurles ME, Homfray T, Penninger JM, Jackson AP, Knoblich JA (2013) Cerebral organoids model human brain development and microcephaly. Nature 501:373–379 - PMC - PubMed
    1. Adams JW, Cugola FR, Muotri AR (2019) Brain organoids as tools for modeling Human Neurodevelopmental disorders. Physiology 34:365–375 - PMC - PubMed
    1. Luo C, Lancaster MA, Castanon R, Nery JR, Knoblich JA, Ecker JR (2016) Cerebral organoids recapitulate epigenomic signatures of the human fetal brain. Cell Rep 17:3369–3384 - PMC - PubMed

MeSH terms

LinkOut - more resources