. 2024 Nov 20;112(22):3680-3696.e8.
doi: 10.1016/j.neuron.2024.08.019. Epub 2024 Sep 20.

A fast and responsive voltage indicator with enhanced sensitivity for unitary synaptic events

Affiliations

A fast and responsive voltage indicator with enhanced sensitivity for unitary synaptic events

Yukun A Hao et al. Neuron. .

Abstract

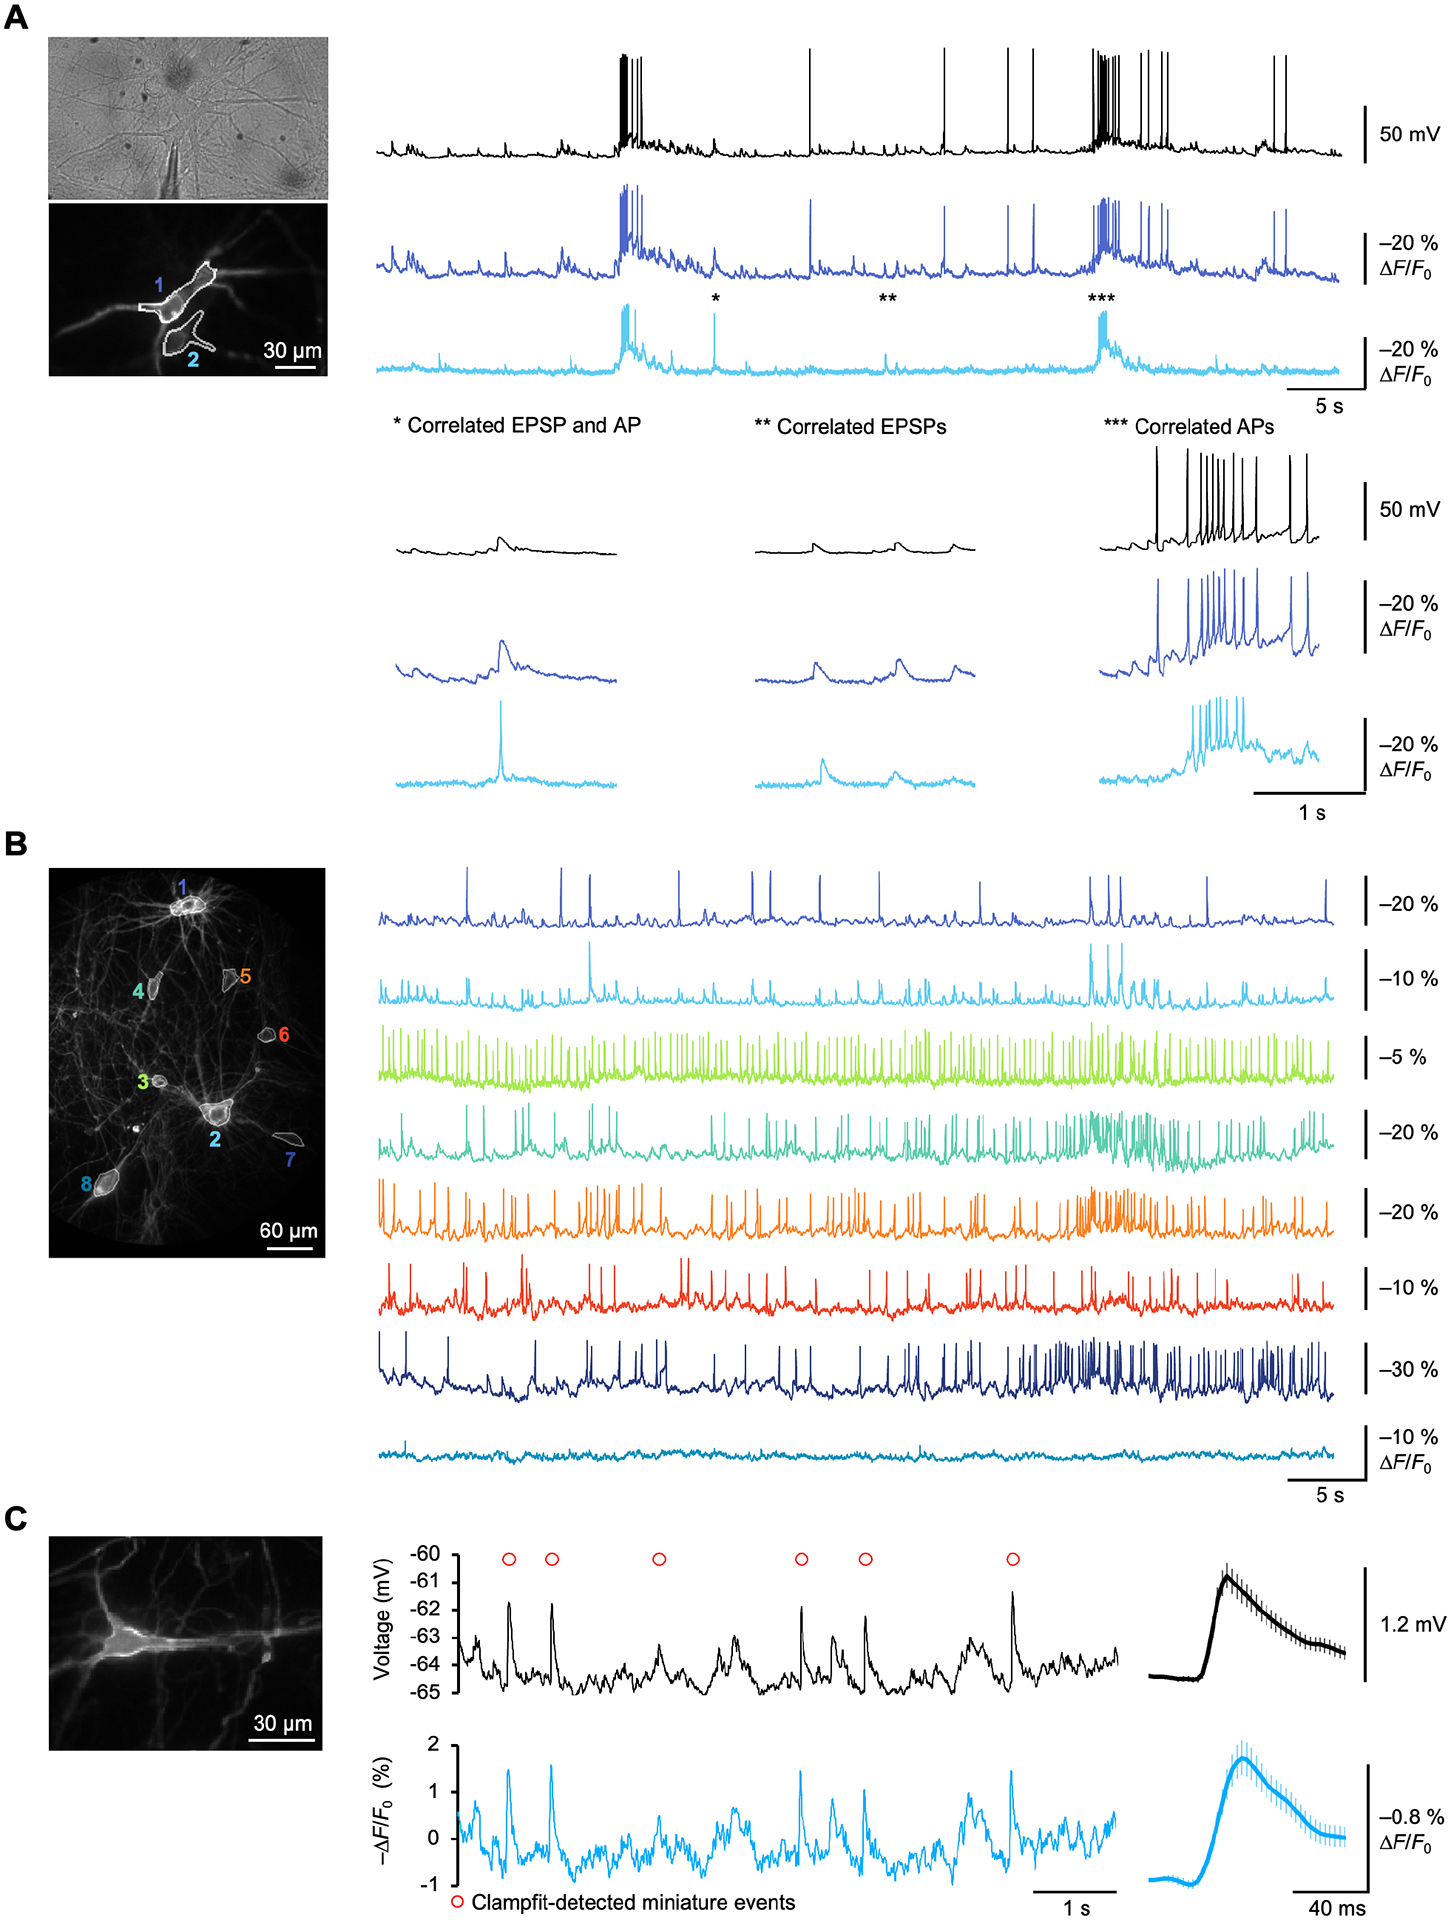
A remaining challenge for genetically encoded voltage indicators (GEVIs) is the reliable detection of excitatory postsynaptic potentials (EPSPs). Here, we developed ASAP5 as a GEVI with enhanced activation kinetics and responsivity near resting membrane potentials for improved detection of both spiking and subthreshold activity. ASAP5 reported action potentials (APs) in vivo with higher signal-to-noise ratios than previous GEVIs and successfully detected graded and subthreshold responses to sensory stimuli in single two-photon trials. In cultured rat or human neurons, somatic ASAP5 reported synaptic events propagating centripetally and could detect ∼1-mV EPSPs. By imaging spontaneous EPSPs throughout dendrites, we found that EPSP amplitudes decay exponentially during propagation and that amplitude at the initiation site generally increases with distance from the soma. These results extend the applications of voltage imaging to the quantal response domain, including in human neurons, opening up the possibility of high-throughput, high-content characterization of neuronal dysfunction in disease.

Keywords: EPSP; GEVI; action potentials; subthreshold activities; voltage imaging.


Conflict of interest statement

Declaration of interests M.Z.L. is an inventor on a patent for the earlier ASAP1 voltage indicator.

Figures

Figure 1.
Figure 1.. Protein engineering and biophysical properties of ASAP5
(A) A structural model of ASAP3 based on homology modeling. The engineered sites are highlighted by sticks representation. (B) 3 rounds of screening and the engineering pathway from ASAP3 to ASAP5. (C) Scatter plot for normalized kinetics index and normalized responsivity of variants in the first round of screening. ASAP5 is added for comparison. Colored lines represent the product of the two parameters, ranging from 0.2 to 2.0 with equal distance. (D) Steady-state fluorescence-voltage (F-V) function normalized to −70 mV (left), and the normalized slope of this function (right). Error bars, standard deviation (SD) of 5, 5 HEK293A cells for ASAP3 and ASAP5, respectively. (E) Example traces of action potentials induced by current injection in cultured hippocampal neurons expressing ASAP3 (left) or ASAP5 (right), recorded by electrode and camera (800 fps). (F) Left: averaged voltage and fluorescence waveforms of current-induced spikes in cultured rat hippocampal neurons at room temperature. N = 10 cells, shaded area: ± 1 SEM. Right: Statistical comparison of the peak amplitudes of the voltage and optical spikes. Optical recording was at 800 fps. Welch’s t test was used for the four comparisons. (G) Relative brightness of GEVI to fused mCyRFP3 in cultured hippocampal neurons. N = 21 and 27 neurons for ASAP3 and ASAP5, respectively. Welch’s t test was used for the comparison.
Figure 2.
Figure 2.. Comparative performance of ASAP5 in vivo under 1-photon illumination
(A) Left, schematic drawing of a head-fixed mouse running on a wheel during in vivo voltage imaging. Right, Representative post-hoc histology images of sparsely labelled CaMKIIα+ neurons expressing soma-targeted versions of ASAP3, JEDI-2P, JEDI-1P, and ASAP5. (B) Left, representative baseline-corrected 2-min 500 fps GEVI recordings. Middle, single-AP examples. Right, average waveform of all detected APs for each GEVI. Error bars, SEM. N = 17 cells from 6 mice for ASAP3-Kv, 16 cells from 4 mice for JEDI-1P-Kv, 11 cells for 5 mice for JEDI-2P-Kv, and 15 cells from 4 mice for ASAP5-Kv. (C) Statistical analyses for ΔF/F0 amplitude, cellular brightness averaged from the first second, SNR for detected optical spikes, and detected spike numbers (mean ± SEM). Outlined dots correspond with the displayed traces in (B). (D) An ASAP5-Kv expressing cortical neuron showing spikes time-locked to the running periods. The pseudo-colored bar below the fluorescence trace shows the running speed. Red ticks in (B) and (D) indicate spikes detected by VolPy.
Figure 3.
Figure 3.. Single-trial imaging of graded and action potentials in fruit flies
(A) Comparison of ASAP5 and JEDI-2P in Mi1 neurons. Left: 2-photon voltage imaging of Mi1 neurites in the M10 layer of the medulla in awake flies. Middle: Stimulus-triggered average of fluorescence trace, peak response, SNR at peak, and time of detected peak response, in response to a 24-ms contrast increment or decrement (gray box). Right: photostability and baseline brightness of ASAP5 and JEDI-2P. Shadow represents SEM. N = 59 ASAP5 neurons from 5 flies and 60 JEDI-2P neurons from 5 flies. Each dot represents one neuron. Welch’s t test was used for all the comparisons. (B) Left: Example single trials of JEDI-2P or ASAP5-expressing Mi1 neurons responding to visual stimuli. Red ticks denote the onset of a 24 ms contrast increment; magenta ticks denote the onset of a 24 ms contrast decrement. Traces were binned to 70 fps. Right: Stimulus-triggered average of the example traces. (C) Left: The scanned image of the fly brain with two ASAP5-expressing TPN-II neurons and a template fly brain showing R60H12-Gal4 expression pattern. Middle: example traces of two ASAP5-expressing TPN-II neurons firing spikes recorded using a 3D AOD random-access scope (Femtonics) at 3288 fps. Gaussian filter (sigma=1.5 frame) was applied to the trace. Red ticks denote the peaks of each spike. Right: Averaged waveform of all spikes in each cell, as well as the spike-triggered average of the response of the other neuron. Dots represent the measurement points.
Figure 4.
Figure 4.. Single-trial 2-photon imaging of supra- and sub-threshold activities in awake mice
(A) Comparison of ASAP5-Kv and JEDI-2P-Kv 2-photon performance. Left: representative layer-2 motor cortex neurons expressing JEDI-2P-Kv or ASAP5-Kv. Middle: Corresponding baseline-corrected fluorescence traces, with shaded intervals enlarged at the right. Right: Comparison of SNR and brightness corrected for post-objective power (mW) used for each neuron, spike amplitudes in ΔF/F0, and depth of each neuron from dura (mean ± SEM). N = 12 JEDI-2P-Kv cells from 3 mice, and 7 ASAP5-Kv cells from 4 mice. Outlined dots correspond with the displayed traces. (B) Schematic of voltage imaging in mouse barrel cortex during whisker stimulation, and representative images of ASAP5-Kv in layer-2 neurons. Green arrowhead, a neuron in the C2 column analyzed in (C). (C) Top: ASAP5-Kv traces from a neuron responding to stimulation on either C2 or D2 whisker, imaged at 397 fps. The orange line is the subthreshold component obtained by a long-pass filter. Middle: Post-stimulus time histogram (PSTH) showing spike rates during whisker stimulation. Bottom: Averaged subthreshold traces for C2 (left) or D2 (right) whisker stimulation. (D) Correlation between whisker-evoked EPSP and whisker-evoked IPSP amplitude, for 5 cells imaged in the same field (colors). Lines show linear regression for each cell. Right, distribution of Pearson’s correlation coefficient for each cell (n = 28), showing that whisker-evoked excitation and inhibition are generally correlated. Neurons were in the C2, B1 or C1 columns. (E) Top: Mean PSTH of all cells (n = 28) for each stimulated whisker. Bottom: Mean fluorescence traces across all cells (n = 28) showing subthreshold activity for each whisker stimulation. Dashed lines in (C) and (E) represent stimulus onset.
Figure 5.
Figure 5.. Optical detection of mEPSPs in cultured rat hippocampal neurons
(A) Left: a neuron expressing ASAP5-Kv. Middle: simultaneous voltage and optical recording of the neuron. The voltage recording was downsampled to match the optical recording. Red circles denote mEPSPs detected in the voltage recording. Green circles denote mEPSPs detected in the optical recording. Right: The amplitude of mEPSP voltage signals and the corresponding optical signals from the example neuron. Black line is the linear fitting of the data. (B) A neuron expressing Voltron2525-Kv and the recording of mEPSPs. Panels are the same with (A). (C) Above, SNR of the peak amplitude of mEPSPs. Below, responsivity of the indicators for reporting mEPSPs. Each dot is a neuron. Welch’s t test was used for statistical comparison of the mean. (D) Above, mean electrical waveforms (left) and optical waveforms (right) of detected mEPSPs of the two sensors. Each optical waveform was normalized to its peak value for comparing kinetics. Below, time-lagged cross-correlograms of simultaneous voltage and optical recordings. Shaded area: SEM. Number of neurons: 6 (ASAP5-Kv) and 7 (Voltron2525-Kv). Welch’s t test was used to compare the mean of the peak cross-correlations. (E) Fidelity of optical detection of mEPSPs using deconvolution-based method. Top: Averaged false positive (FP) rate as a function of mEPSP amplitude for all events from all neurons. Bottom: Averaged false negative (FN) rate as a function of mEPSP amplitude for all events from all neurons. Shaded area: SEM. Number of neurons and events detected per neuron: 6, 89 ± 31 (ASAP5-Kv; mean ± SD) and 7, 61 ± 29 (Voltron2525-Kv; mean ± SD). (F) Fidelity of optical detection of mEPSPs using miniML trained on paired electrophysiological and optical recordings. Top: Averaged FP rate as a function of mEPSP amplitude for all events from all neurons. Bottom: Averaged FN rate as a function of mEPSP amplitude for all events from all neurons. Shaded area: SEM. Number of neurons and events detected per neuron: 6, 144 ± 97 (ASAP5-Kv; mean ± SD) and 7, 97 ± 99 (Voltron2525-Kv; mean ± SD).
Figure 6.
Figure 6.. Voltage imaging of dendrosomatic propagation of mEPSPs
(A) ASAP5 reveals EPSPs originating from distal dendrites in a rat hippocampal neuron (DIV 26). Top, whole-cell current clamp recording of spontaneous activity. The red boxes indicate two time periods shown below. Bottom-left, a time-period where the dendritic ROIs 2, 3, and 4 (from proximal to distal) show subthreshold events with decreasing ΔF/F0 amplitudes as it propagates from distal to the soma (marked by a black arrow). Note that these dendritic EPSPs are not present in ROIs 5, 6, and 7 which are on another dendrite. Bottom-right, another time-period where ROIs 5, 6, and 7, but not ROIs 2, 3 and 4, are showing a dendritic EPSP with larger amplitudes in distal part than in near-soma ROIs. (B) An example neuron and an observation of the spatial propagation of mEPSP. Top: An example neuron expressing ASAP5. The blue solid disk marked the initiation site of the propagation, and the blue circles marked the pixels with coincident optical signals. The yellow line marked the path along with the distance to soma was calculated. Middle: The optical traces of the propagation event at the initiation site and the soma. Black arrows indicate the time of the peak signals of the propagation. Bottom: The amplitudes of the optical signals in the propagation event as a function of the distances between the pixels and the soma. d0 marked the distance of the initiation site to the soma. Only the signals from pixels closer to the soma than the initiation site were included. The red dashed line is the exponential function that fits the data. (C) Top: amplitude of signals at the initiation sites correlates with the distance between the initiation site and the soma. Middle: amplitude of signals at the soma correlates with the distance between the initiation site and the soma. Bottom: dendrosomatic attenuation ratio correlates with the distance between the initiation site and the soma. In the three plots, each dot is a propagation event, and each color is a neuron. Two example neurons are shown here, and the black lines are the linear fit of the data. (D) Top: The Pearson correlation coefficients of signal amplitude at the initiation sites and the distance between initiation site and soma. Middle: The Pearson correlation coefficients of signal amplitude at the soma and the distance between initiation site and soma. Bottom: The Pearson correlation coefficients of dendrosomatic attenuation ratio and the distance between the initiation site and the soma. In the three plots, each dot is a neuron. Number of neurons: 21. (E) Histogram of the length constant L fit from the exponential function in (C) for all propagation events from all neurons. Welch’s t test was used to compare the data and the shuffled control in D, E and F. Number of neurons and propagation events: 21, 309.
Figure 7.
Figure 7.. Characterization of electrical activity in induced human neurons by ASAP5-Kv
(A) Two human iNs expressing ASAP5-Kv under the Ubiquitin-C (UbC) promoter imaged at 40 DIV. Cell1 was patched in whole-cell mode for simultaneous recording of its spontaneous activity in electrophysiology (black) and in ASAP5-Kv fluorescence (dark blue). Cell2 was only imaged for its fluorescence change (blue). The asterisks indicate three exemplary states of the two cells and their zoomed-in traces are shown on the lower panel. Frame rate was 400 fps. (B) Eight ASAP5-Kv expressing human iNs network (hSyn promoter; 41 DIV) imaged at 100 fps revealing their supra- and sub-threshold activity in cellular resolution. (C) Left, a human iN expressing virally introduced ASAP5-Kv (hSyn promoter; 80 DIV). Middle, simultaneous recording of spontaneous activity in electrophysiology (black) and ASAP5-Kv fluorescence (blue) with TTX (1 μM) and PTX (50 μM) in the bath solution to block AP-generated synaptic activity and inhibitory transmission. The red circles indicate miniature events detected by using a template search algorithm. Right, averages of electrical (black) and fluorescent signal (blue) for 42 mEPSPs recorded from the same neuron during 1 min.

References

    1. Bean BP (2007). The action potential in mammalian central neurons. Nat Rev Neurosci 8, 451–465. - PubMed
    1. FATT P, and KATZ B (1952). Spontaneous subthreshold activity at motor nerve endings. J Physiol 117, 109–128. - PMC - PubMed
    1. Häusser M, Spruston N, and Stuart GJ (2000). Diversity and dynamics of dendritic signaling. Science 290, 739–744. - PubMed
    1. Südhof TC (2018). Towards an Understanding of Synapse Formation. Neuron 100, 276–293. - PMC - PubMed
    1. Pak C, Danko T, Zhang Y, Aoto J, Anderson G, Maxeiner S, Yi F, Wernig M, and Südhof TC (2015). Human Neuropsychiatric Disease Modeling using Conditional Deletion Reveals Synaptic Transmission Defects Caused by Heterozygous Mutations in NRXN1. Cell Stem Cell 17, 316–328. - PMC - PubMed

LinkOut - more resources