. 2024 Oct 3;31(10):1524-1542.e4.
doi: 10.1016/j.stem.2024.08.010. Epub 2024 Sep 20.

The landscape of drug sensitivity and resistance in sarcoma

Affiliations

The landscape of drug sensitivity and resistance in sarcoma

Ahmad Al Shihabi et al. Cell Stem Cell. .

Abstract

Sarcomas are rare malignancies with over 100 distinct histological subtypes. Their rarity and heterogeneity pose significant challenges to identifying effective therapies, and approved regimens show varied responses. Novel, personalized approaches to therapy are needed to improve patient outcomes. Patient-derived tumor organoids (PDTOs) model tumor behavior across an array of malignancies. We leverage PDTOs to characterize the landscape of drug resistance and sensitivity in sarcoma, collecting 194 specimens from 126 patients spanning 24 distinct sarcoma subtypes. Our high-throughput organoid screening pipeline tested single agents and combinations, with results available within a week from surgery. Drug sensitivity correlated with clinical features such as tumor subtype, treatment history, and disease trajectory. PDTO screening can facilitate optimal drug selection and mirror patient outcomes in sarcoma. We could identify at least one FDA-approved or NCCN-recommended effective regimen for 59% of the specimens, demonstrating the potential of our pipeline to provide actionable treatment information.

Keywords: high-throughput drug screening; organoids; patient-derived models; precision medicine; sarcoma; tumor organoids.


Conflict of interest statement

Declaration of interests A.S., J.Y., P.C.B., and N.C.F. are founders and owners of Icona BioDx. A.S. is a founder and owner of MiRiO.

Figures
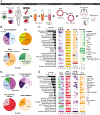
Figure 1.
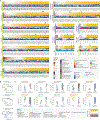
Figure 1.. Overview of the patient-derived tumor organoid pipeline, patient demographics and sample characteristics.
(A) Tissue is collected from biopsies or surgical resections of bone and soft tissue sarcomas. Organoids are generated by digesting the tissue and culturing the harvested cells in a 3D matrix. Organoids are molecularly and functionally profiled. (B) Demographics of pan-sarcoma study patients. Pediatric: 0–14 years old, AYA: 15–39 years old, adults: 40 years old and above. (C) Demographics divided by diagnosis. (D) Clinical characteristics of tumors from which tissue was collected. Prior systemic therapies include chemotherapy, targeted agents, and immunotherapy. (E) Tumor characteristics divided by disease subtype. See also Supplementary Figure 1.
Figure 2.
Figure 2.. Sarcoma organoids grow in culture and recapitulate key morphological features of the parental tumors.
(A) Representative images of sarcomas and corresponding organoids stained with H&E (columns 1 and 2). Representative brightfield images of the same sarcoma cells in culture on Day 1 (column 3) and Day 5 (column 4). Growth was tracked over time by segmenting in-focus organoids in the brightfield images using a machine learning-based pipeline and by normalizing the cross-sectional area covered by organoids to that measured on the first day of culture. Data are represented as mean ± SEM. Scale bars: 40 μM for H&E images, 100 μM for brightfield pictures. (B) Genomic and transcriptomic characterization of selected sarcoma samples. Dark boxes below sample names are the Spearman’s rank correlation coefficients comparing the frequency of RNA transcripts across RNA-sequenced tumor and organoid samples. Correlations exclude genes with expression less than 0.1 transcripts per million in either sample. The table below shows findings from genomic characterization of tumor samples with the Dana-Farber Cancer Institute OncoPanel Version 3.1. Colors in the heatmap indicate the type of the copy number variant (CNV), single nucleotide variant (SNV), or structural variant (SV). Tier, indicated by an “o” or “x” superimposed on the plot, represents the classification scale defined by Dana-Farber Cancer Institute. Tier 1 represents alterations with “well-established published evidence” of diagnostic or prognostic value, tier 2 alterations “may have clinical utility”, and tier 3 alterations have “uncertain clinical utility.” (C) Spearman’s rank correlation coefficients comparing RNA transcripts of tumor and organoids derived from two samples collected from patient SARC0139. Genes with expression less than 0.1 transcripts per million are excluded from the analysis. See also Supplementary Figure 2.
Figure 3.
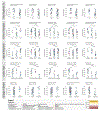
Figure 3.. Sarcoma organoid sensitivity to treatment in high-throughput drug screening experiments shows a range of responses.
(A) Heatmaps of organoid sensitivity to selected drugs of interest at 1 μM. The viability score represents each organoid model’s viability normalized to the mean response to treatment across all samples. Each column is a unique specimen, red indicates higher sensitivity to treatment than average. Colored bars underneath each heatmap represent the Z-score, lesion type, and diagnosis of each sample. * indicates passaged samples, denotes biopsies. Samples with the same SARC number are derived from the same patient. (B) Dose-response curves of organoid viability when treated with selected therapeutic regimens. Percent viability is reported compared to vehicle-treated organoids for each individual sample. Data are represented as mean ± SEM. (C) Sensitivity rank plots comparing the response of organoids derived from the indicated diagnoses (left) against pan-sarcoma specimens (right). Samples are ranked from low residual viability percentile (most responsive samples) to highest residual viability percentile (least responsive samples). Primary drug targets are indicated next to each drug’s name. The color of each point represents the diagnosis of the individual samples. Box plots represent the interquartile range. See also Supplementary Figures 3-4 and Supplementary Table 1.
Figure 4.
Figure 4.. Sarcoma organoid sensitivity correlates with clinical attributes.
Sarcoma samples are grouped by clinical features including patient age at diagnosis, lesion type, number of prior systemic therapies, prior systemic therapy within 3 months of sample procurement and change in disease status. All samples screened with the indicated drug are ranked from lowest viability percentile (reduced PDO viability, higher response to drugs) to highest viability percentile (increased PDO viability, lower response to drug) and plotted according to the rank. Primary drug targets are listed. The color of each point represents the specific diagnosis of the individual samples. Statistical significance is tested by performing a Kruskal-Wallis test with post-hoc Wilcoxon Rank Sum Test for pairwise comparisons with Bonferroni correction for comparisons across three classifications. For comparisons across two categories, a Wilcoxon Rank Sum Test was performed. Box plots represent the interquartile range. See also Supplementary Figure 4.
Figure 5.
Figure 5.. Landscape drug sensitivity patterns reveal vulnerable biological pathways.
Heatmap showing the molecular pathways most sensitive to drug targeting for each screened sample from Wiki Pathways. Similar pathways are clustered together using the Jaccard distance and samples are clustered together by their Euclidian distance. Pathways are ranked independently for each sample based upon the results of drug screening experiments. Pathways targeted by the most effective drugs are ranked highest (red). Opaque squares indicate pathways in which more than 50% of the constituent genes were targeted in the drug panel. Pathways ranked in the top 50 for 20 or more samples are plotted. White squares indicate that the pathway was not targeted by any drugs in the screening experiments. See also Supplementary Figure 5.
Figure 6.
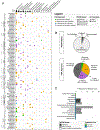
Figure 6.. Actionability of PDO predictions determined by drug approval status.
We selected drug-diagnosis pairs of interest by cross-referencing the five most effective drugs for each sample with the 10% most responsive samples for each drug. (A) Current FDA approval status and NCCN Guidelines recommendations are shown for each unique drug-diagnosis combination. Green and yellow colors indicate FDA approved drugs for the same cancer type or for other cancer indications respectively. Blue and purple represent drugs in trial for the same cancer or different cancers respectively. The shape of the symbols indicates NCCN Guideline status. Triangles shows drugs that are preferred, and squares recommended as per NCCN Guidelines. Circles are drugs not currently discussed in the guidelines,. Diamond shape signifies that the histologic subtype has no guidelines as of yet, such as in the case of DSRCT and CIC rearranged sarcoma. The size of the marker represents the number of samples for which each regimen is found amongst the most effective. Drugs are clustered by similarity in gene targets using Jaccard distance. The number of samples screened for each histologic subtype is shown in the bar charts above the graph. (B) Pie charts summarize the overall percentage of drugs that fall into each category for FDA approval and NCCN recommendations. (C) Percentage of responsive osteosarcoma PDOs to NCCN recommended treatment regimens. See also Supplementary Figures 5-6 and Supplementary Tables 2-3.
Figure 7.
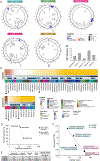
Figure 7.. Organoids provide genomic and diagnostic information.
(A) Summary of the genetic features of selected sarcomas. Sequencing was performed using OncoPanel. (B) Tumor mutational burden (TMB) for the same samples. (C) PDO viability scores for alpelisib and infigratinib. Black arrows indicate samples of interest. (D) Correlation between osteosarcoma biopsy response to MAP and percent necrosis clinically determined at time of tumor resection post neoadjuvant MAP treatment for the same patients. (E) Comparison of PDTO performance and patient outcomes. (F) Normalized time to next systemic therapy (TTNT) compared to PDO viability score for therapeutic regimens screened on organoids and administered to the patient immediately following sample procurement using simple linear regression. TTNT of the matching therapeutic regimen is normalized to the TTNT of the regimen used immediately preceding specimen collection. TTNT greater than 1 indicates that the treatment of interest yielded longer TTNT compared to the previously administered treatment. Sample diagnosis and therapeutic regimen are annotated for each point. See also Supplementary Figures 6-7.

Update of

References

    1. Mackall CL, Meltzer PS, and Helman LJ (2002). Focus on sarcomas. Cancer Cell 2, 175–178. - PubMed
    1. Miller RW, Young JL, and Novakovic B (1995). Childhood cancer. Cancer 75, 395–405. - PubMed
    1. Siegel RL, Miller KD, Fuchs HE, and Jemal A (2022). Cancer statistics, 2022. CA. Cancer J. Clin 72, 7–33. - PubMed
    1. NCCN Guidelines Version 2.2022: Soft Tissue Sarcoma (2022).
    1. NCCN Guidelines Version 2.2023: Bone Cancer (2022).

Substances

LinkOut - more resources