. 2024 Oct;300(10):107785.
doi: 10.1016/j.jbc.2024.107785. Epub 2024 Sep 19.

Nucleolin malonylation as a nuclear-cytosol signal exchange mechanism to drive cell proliferation in Hepatocarcinoma by enhancing AKT translation

Affiliations

Nucleolin malonylation as a nuclear-cytosol signal exchange mechanism to drive cell proliferation in Hepatocarcinoma by enhancing AKT translation

Liang Sun et al. J Biol Chem. 2024 Oct.

Abstract

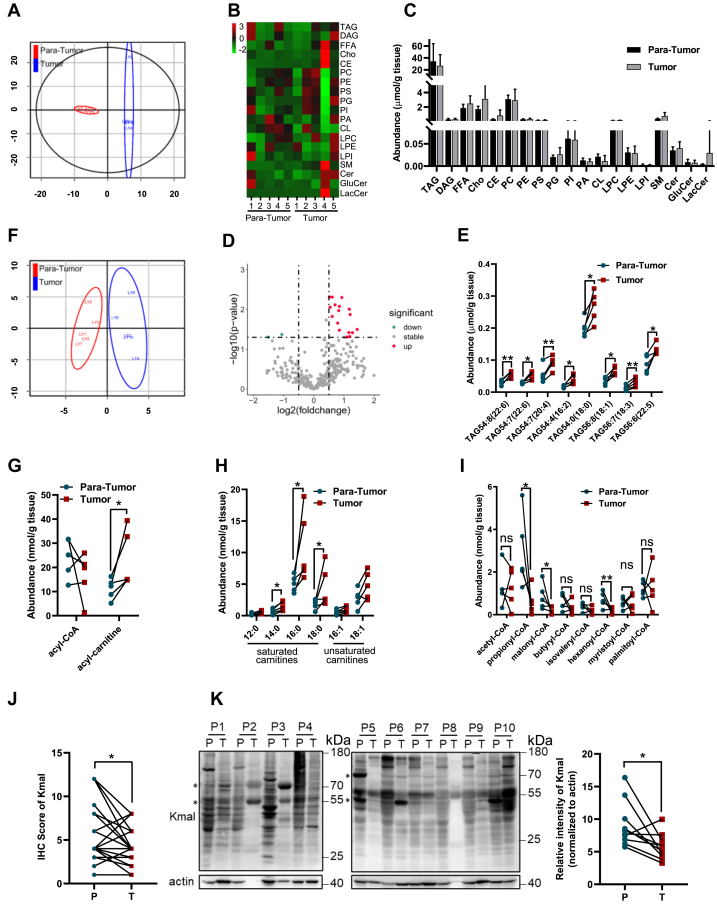
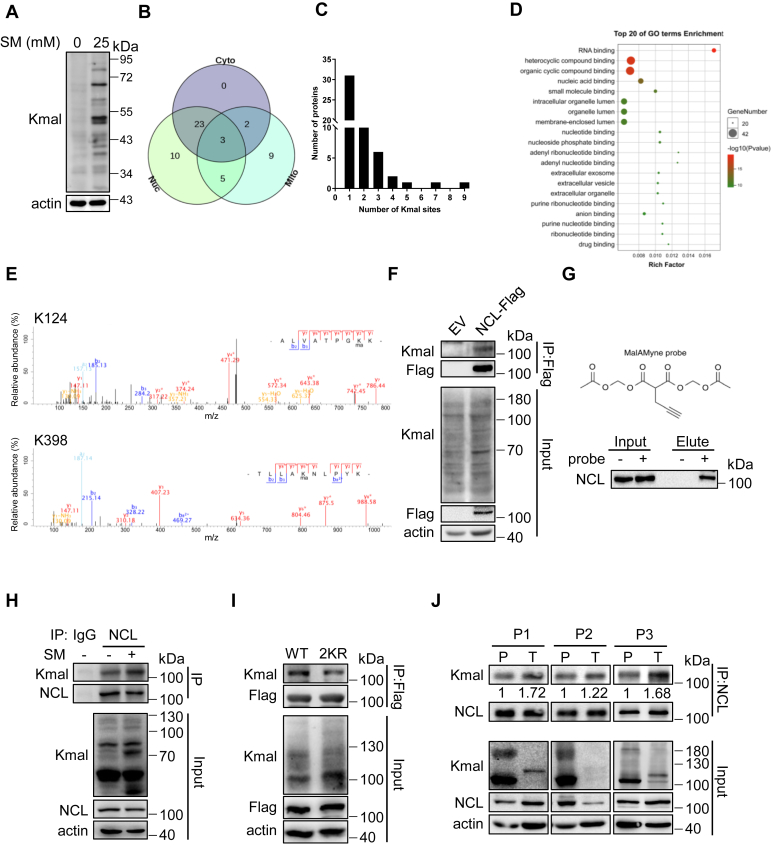
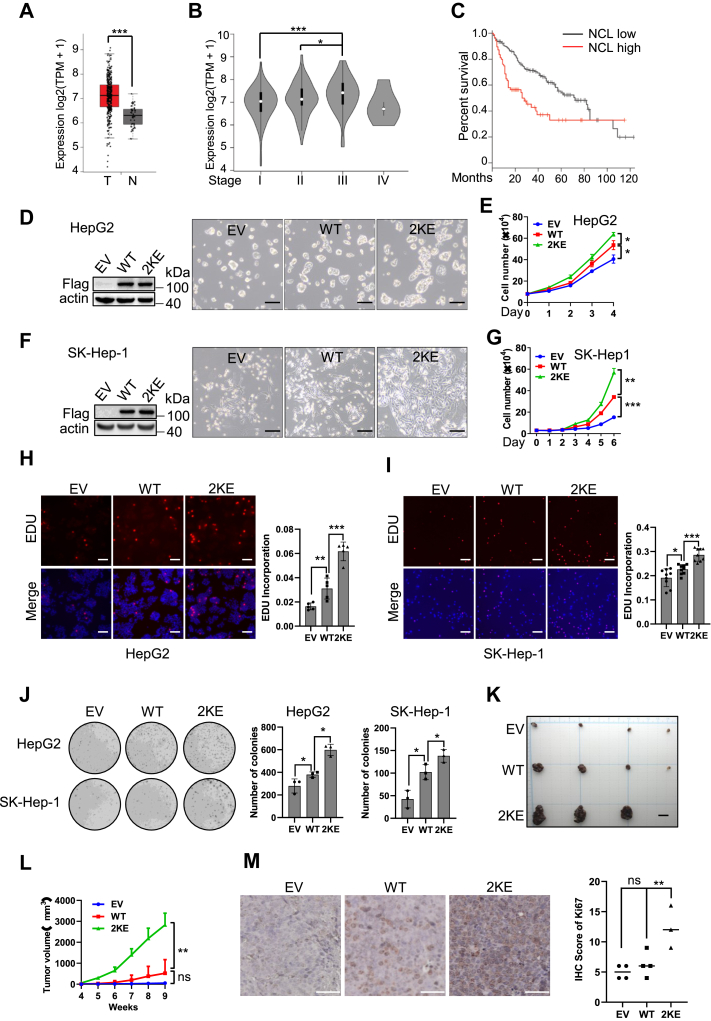
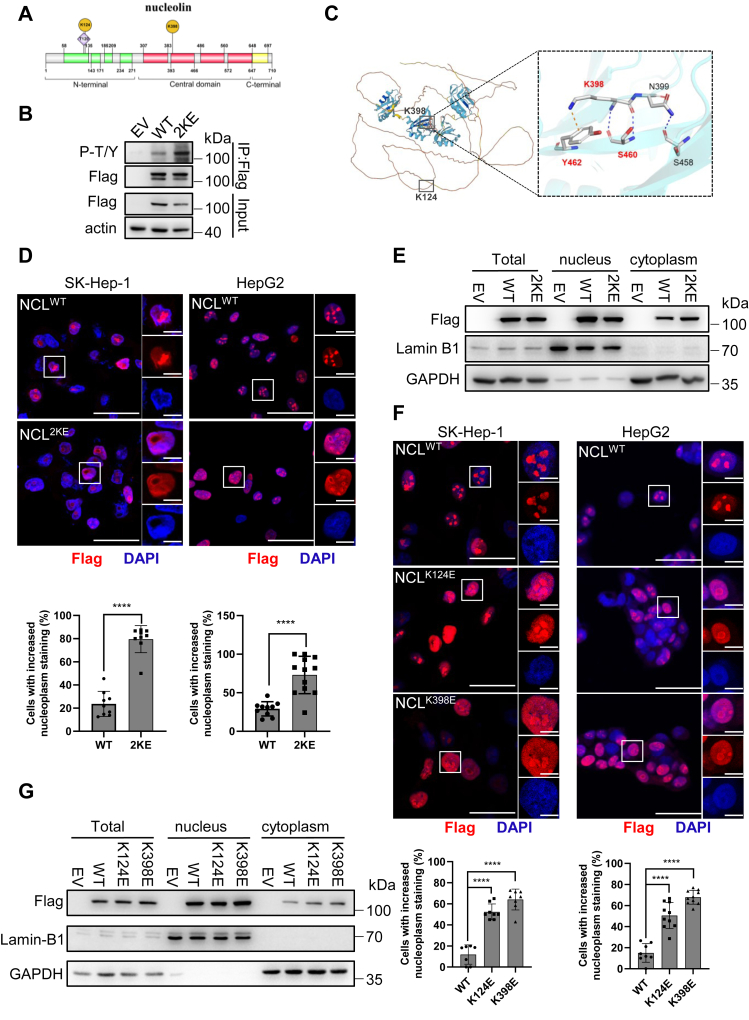
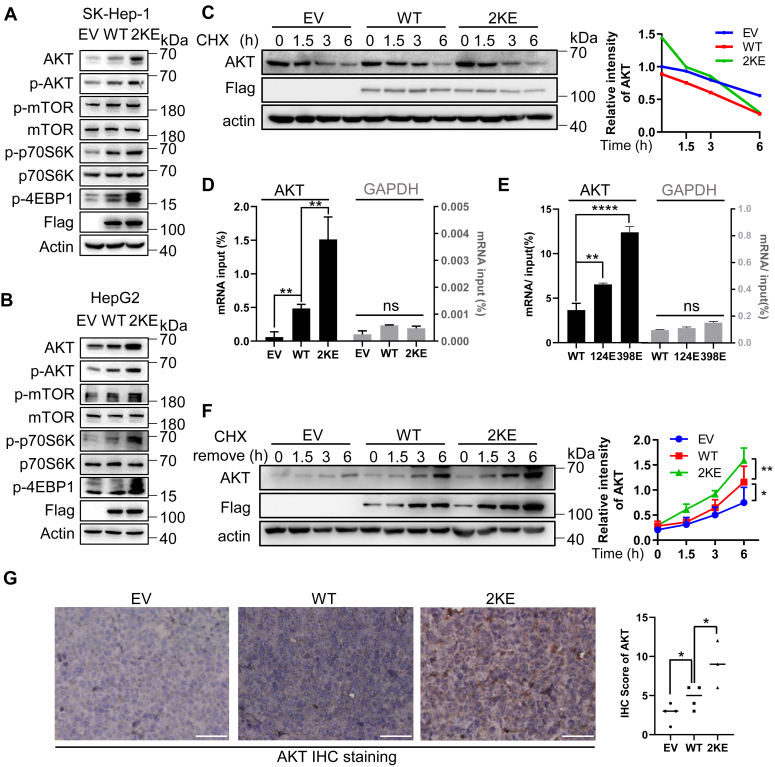
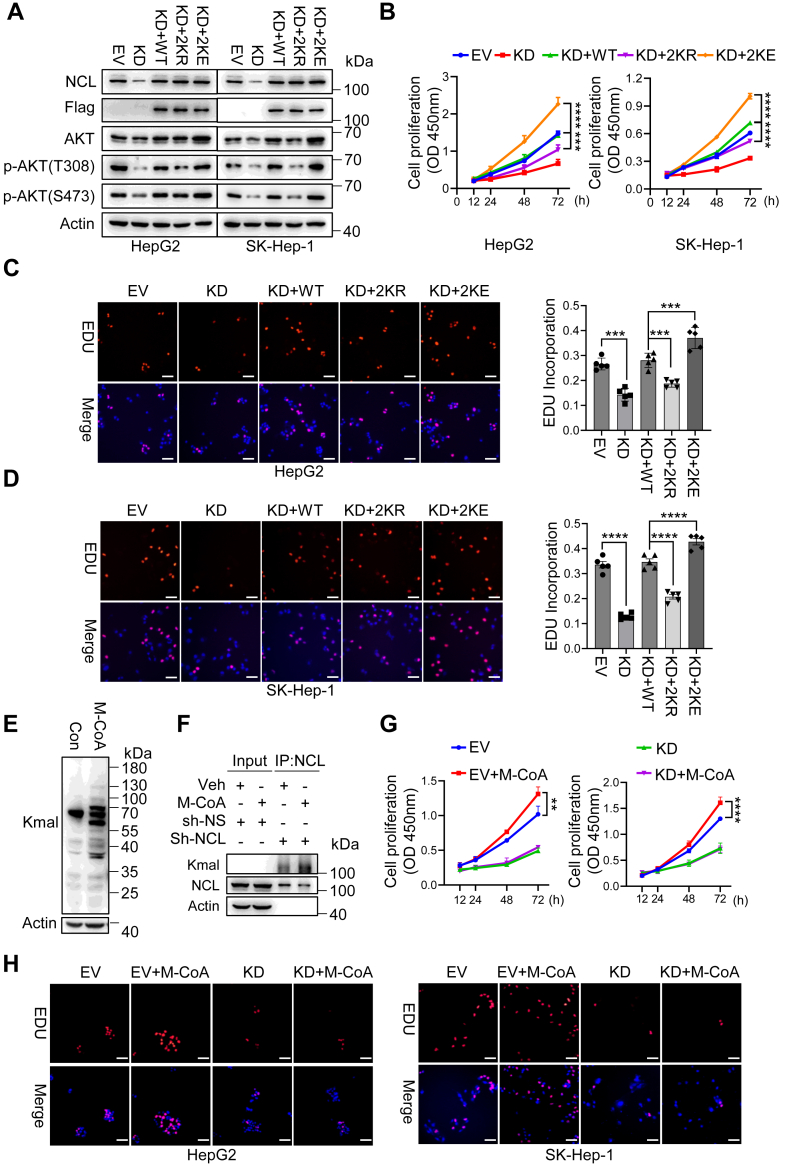
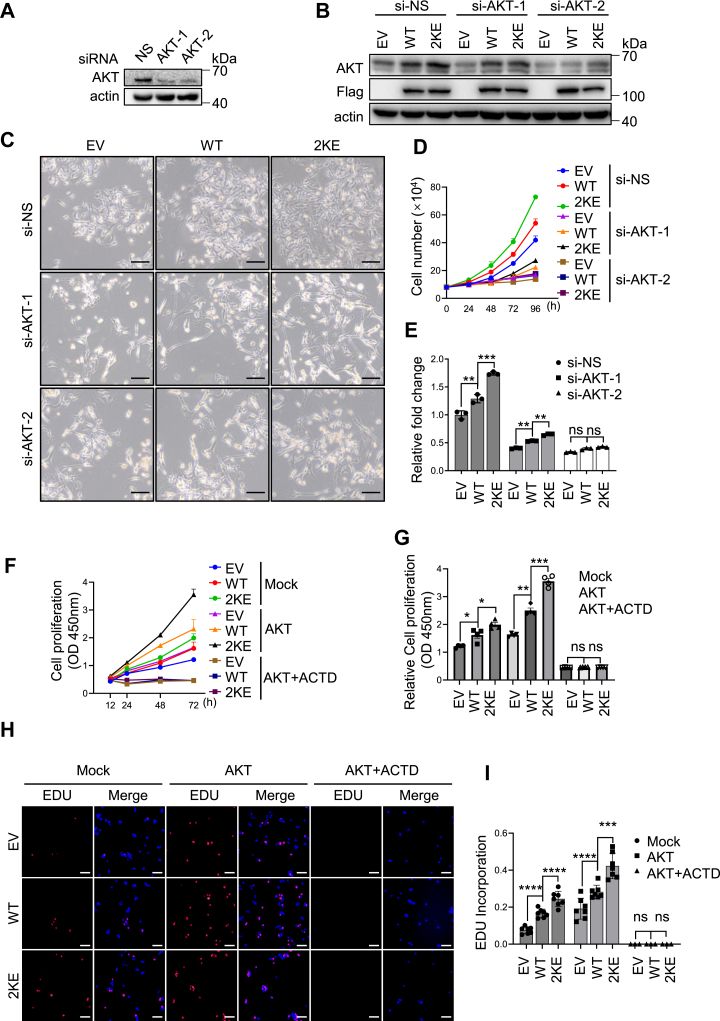
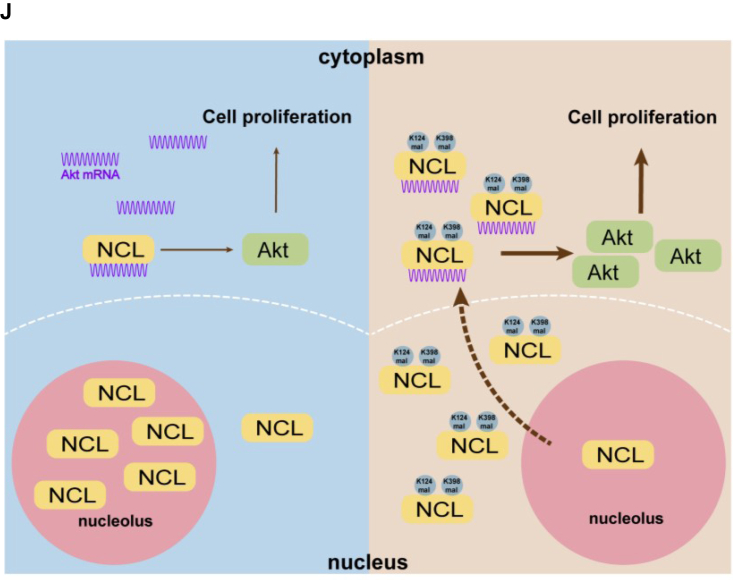
Cancer cells undergo metabolic reprogramming that is intricately linked to malignancy. Protein acylations are especially responsive to metabolic changes, influencing signal transduction pathways and fostering cell proliferation. However, as a novel type of acylations, the involvement of malonylation in cancer remains poorly understood. In this study, we observed a significant reduction in malonyl-CoA levels in hepatocellular carcinoma (HCC), which correlated with a global decrease in malonylation. Subsequent nuclear malonylome analysis unveiled nucleolin (NCL) malonylation, which was notably enhanced in HCC biopsies. we demonstrated that NCL undergoes malonylation at lysine residues 124 and 398. This modification triggers the translocation of NCL from the nucleolus to nucleoplasm and cytoplasm, binding to AKT mRNA, and promoting AKT translation in HCC. Silencing AKT expression markedly attenuated HCC cell proliferation driven by NCL malonylation. These findings collectively highlight nuclear signaling in modulating AKT expression, suggesting NCL malonylation as a novel mechanism through which cancer cells drive cell proliferation.

Keywords: Akt; cell proliferation; hepatocellular carcinoma; malonyl-CoA; malonylation(Kmal); nucleolin.


Conflict of interest statement

Conflict of interest The authors declare that they have no conflicts of interest with the contents of this article.

Figures

Figure 1
Figure 1
HCC tissues revealed lower malonyl-CoA level and reduced global malonylation.A, orthogonal projections to latent structures-discrimination analysis (OPLS-DA) score plots of total lipids derived from the ultra-performance liquid chromatography mass spectrometry (LC/MS) spectra of tumor and para-cancer samples from patients diagnosed with HCC. OPLS-DA was performed in R 4.0.5 using ropls package. B, systematic lipidomic changes occurring in different tissues. Result shown as heatmap. Pseudocolors indicated positive (red) or negative (green) correlation values. The scale represents the correlation values from 3 to −2. C, abundances of the total level of each lipid species in HCC and para-HCC tissues. D, volcano plot displaying fold change of lipids between HCC and para-HCC tissues. (p < 0.05, absolute log2 fold change > 0.5 or < −0.5, unpaired t test). Red dots: metabolites increased in tumor tissues; green dots: metabolites increased in normal liver tissues; gray dots: metabolites with no significant difference between the two groups. E, abundances of TAGs showing significant difference between HCC and para-HCC tissues. F, OPLS-DA score plots of acyl-CoAs and acyl-carnitines derived from the LC/MS spectra of HCC and para-HCC tissues. OPLS-DA was performed in R 4.0.5 using ropls package. G, abundances of total acyl-CoA and acyl-carnitine between HCC and para-HCC tissues. H, intensity of acyl-carnitines in HCC and para-HCC tissues. I, abundances of major acyl-CoA species showing significant difference between HCC and para-HCC tissues. J, statistical analysis of IHC scores. IHC analysis was carried out with pan-Kmal antibody on a tissue microarray containing 42 HCC samples as well as the corresponding para-HCC samples. ∗p < 0.05, n = 42. K, immunoblotting showing global Kmal pattern in HCC and para-HCC tissues. Actin was used as a loading control. Asterisks indicate those bands with increased signal intensity in HCC samples. Controls are para-cancer tissue samples from patients. Right panel, statistical analysis of immunoblotting result, in which the intensity of Kmal-recognized signals were normalized by actin expression. ∗p < 0.05, n = 10.
Figure 2
Figure 2
Nucleolin is malonylated in HCC cells at lysine 124 and 398.A, immunoblotting of Kmal from HepG2 cells treated with 25 mM SM for 72 h. B, Venn diagram displaying the number of Kmal proteins and their subcellular distributions as determined by the COMPARTMENTS database. Cyto indicates cytoplasmic proteins; Mito indicates mitochondrial proteins; Nuc indicates nuclear proteins. C, histogram of the number of Kmal sites per protein. D, results from DAVID gene ontology (GO) analysis showing malonylated proteins categorized by molecular function for visualization. Top 20 pathways were shown. E, the lysine-124 and -398 residues of NCL were identified to be Kmal targeting sites by mass spectrometry. F, immunoprecipitation of Flag from HepG2 cells with stable expression of empty vector (EV) or NCL-Flag. G, HepG2 cells were incubated with MalAM-yne (200 μM) or vehicle control for 2 h, followed by click chemistry to label the probe with biotin. Then, immunoprecipitation was performed using streptavidin beads. Samples were blotted for NCL via immunoblotting. H, immunoprecipitation showing Kmal of endogenous NCL in HepG2 cells with or without sodium malonate treatment (25 mM, 72 h). I, immunoprecipitation showing Kmal of ectopic NCL in HepG2 cells with stable expression of NCL-Flag (WT) or NCL2KR-Flag (2 KR). J, immunoprecipitation showing Kmal of endogenous NCL in HCC and para-HCC biopsy of volunteered patients. Kmal of NCL in each tumor tissue was normalized by the modification level in corresponding paracancerous tissue.
Figure 3
Figure 3
NCL malonylation promotes HCC cell proliferation in vitro and in vivo.A, comparative analysis of NCL mRNA expression between liver tumor specimens and the normal tissues was performed. The mRNA data was derived from the cancer genome atlas (TCGA) database and analyzed by GEPIA2. n(T) = 369, n(N) = 160. B, comparative analysis of NCL expression between different stages of liver cancer. Stage I, n = 168; stage II, n = 84; stage III, n = 82; stage IV, n = 6. C, Kaplan-Meier survival curve of patients with low (n = 91) or high (n = 91) level expression of NCL. (p = 0.00046, Log-rank test). The quartile cutpoint is used to separate the low (below the 25th percentile) and high (above the 75th percentile) groups. DI, HepG2 cells and SK-Hep1 cells were infected with lentivirus containing EV, WT NCL (NCLWT), or malonylation mimicking mutant (NCL2KE), followed by selection with puromycin. Polyclonal stable cells were used for cell proliferation assay. Representative pictures showing the confluence (24 h after seeding) of HepG2 (D) and SK-Hep1 cells (F); scale bar indicating 200 μm. E, cell growth curve for HepG2 cells within 96 h. G, cell growth curve for SK-Hep1 cells within 144 h. (H) HepG2 and (I) SK-Hep-1 stable cells were stained with EDU (red) and Hoechst (blue). Representative pictures were shown on the left panel. Scale bar indicates 100 μm. Right panel showing the bar graph in which EDU signal was quantified and normalized by Hoechst signal intensity. J, colony formation ability of HepG2 and SK-Hep-1 cells with stable expression of the indicated ectopic protein. Left panel: representative pictures; right panel showing the quantification of colonies. KM, HepG2 cells with stable expression of the indicated ectopic protein were subcutaneously injected into nude mice to establish HCC xenograft model. Nine weeks later, mice were sacrificed. K, image of xenograft tumors. Scale bar indicates 10 mm. L, tumor volumes were measured and recorded every week. M, Ki-67 staining in xenograft tumors. Left panel: representative images of Ki-67 staining, scale bar indicating 50 μm; right panel: quantification of Ki-67 staining. ∗p < 0.05,∗∗∗p < 0.001,∗∗∗∗p < 0.0001, n = 3. Error bars represent ± SD.
Figure 4
Figure 4
Lysine malonylation fine-tunes NCL phosphorylation and promotes NCL release from nucleolus.A, schematic representation of functional domains of human nucleolin protein. B, immunoprecipitation analysis of NCL phosphorylation in HepG2 cells with the pan-phospho antibody recognizing p-tyrosine and p-threonine (p-T/Y). C, AlphaFold structure predicted with the full-length sequence of human NCL. Color represents model confidence, with yellow indicating very low confidence and blue indicating very high confidence. The location of K124 and K398 were indicated with a black box, and the Zoom-in box showed the predicted binding pocket of K398 based on molecular docking simulation. D, the subcellular distribution of NCLWT and NCL2KE in SK-Hep1 and HepG2 cells. Flag-tagged protein was labeled with Alexa594 (red). DAPI was included to visualize nuclei. Upper panel: representative pictures of the indicated cells with zoom-in nuclei; lower panel: the proportion of cells with nucleoplasmic localization of NCLWT and NCL2KE cells. Over 200 cells were counted in for each cell type. Scale bar indicates 50 μm (full size) and 10 μm (insets). E, subcellular fractionation showing the distribution of NCLWT and NCL2KE in HepG2 cells. Lamin B1 was included as a marker of nuclear fraction, and GAPDH was included as a marker of cytosolic fraction. F, the subcellular distribution of NCLK124E and NCLK398E in SK-Hep1 and HepG2 cells. Scale bar indicates 50 μm (full size) and 10 μm (insets). G, subcellular fractionation showing the distribution of NCLK124E and NCLK398E in HepG2 cells. Error bars represent ± SD. ∗p < 0.05, ∗∗p < 0.01.
Figure 5
Figure 5
Malonylated NCL binds to AKT mRNA and facilitates AKT translation.AB, protein expression of the PI3K/AKT/mTOR pathway in SK-Hep1(A) and HepG2(B) stable cells. Total protein of each cell line was processed by immunoblotting using antibodies against AKT, p-AKT, mTOR, p-mTOR, P70S6K1, p-P70S6K1, p-4E-BP1. Protein loading was normalized with actin. C, half-life of AKT protein in EV, NCLWT, and NCL2KE stable SK-Hep1 cells. The indicated SK-Hep1 cells were treated with 100 μg/ml cycloheximide (CHX) for the time-course as indicated. Total cell lysates were collected for immunoblotting of AKT, Flag, and actin. DE, RNA-IP showing the binding affinity of indicated ectopic NCL to AKT mRNA. Cell lysates from EV, NCLWT, and NCL2KE (D) or NCLWT, NCLK124E, and NCLK398E (E) stable SK-Hep-1 cells were immunoprecipitated with anti-Flag antibody. The co-precipitated AKT or GAPDH (included as a negative control) mRNA was quantified using RT-qPCR. Results (the mean ± SD, n = 3) were presented as percentages of IP signal/input signal (% input). F, EV, NCLWT, and NCL2KE stable SK-Hep-1 cells were pretreated with 100 μg/ml cycloheximide for 12 h. Cycloheximide was then washed out, and cells were incubated for the time course as indicated. AKT synthesis levels were detected by immunoblotting. Right panel: AKT expression was quantified by ImageJ, with each point representing the mean ± SD. G, histological analysis of AKT expression in HCC xenografts. HepG2 xenograft mice with indicated expression of NCLWT and NCL2KE were established as described above. Left panel: representative images of AKT IHC staining; right penal: AKT staining was quantified and the scores were presented in the bar graph. Scale bar indicates 50 μm. Each point represents the mean ± SD, ns: not significant, ∗p < 0.01, ∗∗p < 0.01, ∗∗∗p < 0.001.
Figure 6
Figure 6
NCL malonylation enhances AKT expression and mediates cell proliferation.AD, HepG2 and SK-Hep-1 cells were infected with lentivirus containing sh-NS (EV), sh-NCL (KD), sh-NCL and NCLWT (KD + WT), sh-NCL and NCL2KR (KD+2 KR), and sh-NCL and NCL2KE (KD+2 KE). Polyclonal stable cells were used for (A) immunoblotting, (B) cell viability assay, and (CD) EDU incorporation assay. Scale bar indicates 100 μm. E, HepG2 cells were treated with 10 μM Malonyl-CoA for 24 h. Total cell lysates were immunoblotted with pan-Kmal antibody. F, HepG2 stable cells with sh-NS or sh-NCL were treated with 10 μM Malonyl-CoA for 24 h. Total cell lysates were proceeded to immunoprecipitation with anti-NCL antibody, followed by the immunoblotting with pan-Kmal and NCL antibodies. G, cell viability of HepG2 and SK-Hep-1 cells treated with Malonyl-CoA (10 μM) on cell proliferation in the presence and absence of NCL. H, representative images showing the EDU incorporation in HepG2 and SK-Hep-1 cells treated with vehicle or Malonyl-CoA (10 μM) for 72 h, in the presence or absence of sh-NCL. Scale bar indicates 100 μm. Each point represents the mean ± SD, ns indicates not significant, ∗∗p < 0.01, ∗∗∗p < 0.001, ∗∗∗∗p < 0.0001, n = 6. Error bars represent ± SD.
Figure 7
Figure 7
AKT is required for the enhanced cell proliferation driven by NCL malonylation.A, immunoblotting of AKT expression to validate the knockdown efficiency of AKT-specific siRNAs. SK-Hep1 cells were transfected with control siRNA (siNS), siAKT-1, and siAKT-2 for 36 h, and total cell lysates were analyzed by immunoblotting. BE, EV, NCLWT, and NCL2KE stable SK-Hep1 cells were transfected with control or AKT-specific siRNA for 36 h. Cells were then collected for immunoblotting or subculture for further analysis. B, total cell lysates were analyzed by immunoblotting with AKT, Flag, and actin antibodies. C, representative pictures of EV, NCLWT, and NCL2KE stable SK-Hep1 cells after indicated siRNAs transfection. Scale bar indicates 200 μm. D, cell growth curve of SK-Hep1 cells with indicated treatment. E, statistical analyses of cell numbers 96 h after subculture. Bar graph showed the mean ± SD. ns: not significant, ∗p < 0.05, ∗∗p < 0.01, ∗∗∗p < 0.001, n = 3. F, cell viability of HepG2 cells with indicated treatments. EV, WT, and 2 KE stable HepG2 cells were infected with mock or AKT expressing lentivirus, followed by the treatment of 200 nM actinomycin D (ACTD) or vehicle. CCK-8 assay was performed to evaluate the proliferation. G, statistical analyses of cell viability 72 h after subculture. H, EDU incorporation in HepG2 cells with indicated treatments. EV, WT, and 2 KE stable HepG2 cells were infected with mock or AKT expressing lentivirus, followed by the treatment of 200 nM actinomycin D (ACTD) or vehicle. EDU (red) and Hoechst (blue) was used to stain cells. Representative pictures were shown on the left panel. Scale bar indicates 100 μm. I, statistical analyses of EDU incorporation. EDU signal was quantified and normalized by Hoechst signal intensity. ∗∗∗p < 0.001,∗∗∗∗p < 0.0001, n = 6. Error bars represent ± SD. J, schematic model showing NCL(Kmal)–AKT axis in regulating cell proliferation in HCC.
Figure 7
Figure 7
AKT is required for the enhanced cell proliferation driven by NCL malonylation.A, immunoblotting of AKT expression to validate the knockdown efficiency of AKT-specific siRNAs. SK-Hep1 cells were transfected with control siRNA (siNS), siAKT-1, and siAKT-2 for 36 h, and total cell lysates were analyzed by immunoblotting. BE, EV, NCLWT, and NCL2KE stable SK-Hep1 cells were transfected with control or AKT-specific siRNA for 36 h. Cells were then collected for immunoblotting or subculture for further analysis. B, total cell lysates were analyzed by immunoblotting with AKT, Flag, and actin antibodies. C, representative pictures of EV, NCLWT, and NCL2KE stable SK-Hep1 cells after indicated siRNAs transfection. Scale bar indicates 200 μm. D, cell growth curve of SK-Hep1 cells with indicated treatment. E, statistical analyses of cell numbers 96 h after subculture. Bar graph showed the mean ± SD. ns: not significant, ∗p < 0.05, ∗∗p < 0.01, ∗∗∗p < 0.001, n = 3. F, cell viability of HepG2 cells with indicated treatments. EV, WT, and 2 KE stable HepG2 cells were infected with mock or AKT expressing lentivirus, followed by the treatment of 200 nM actinomycin D (ACTD) or vehicle. CCK-8 assay was performed to evaluate the proliferation. G, statistical analyses of cell viability 72 h after subculture. H, EDU incorporation in HepG2 cells with indicated treatments. EV, WT, and 2 KE stable HepG2 cells were infected with mock or AKT expressing lentivirus, followed by the treatment of 200 nM actinomycin D (ACTD) or vehicle. EDU (red) and Hoechst (blue) was used to stain cells. Representative pictures were shown on the left panel. Scale bar indicates 100 μm. I, statistical analyses of EDU incorporation. EDU signal was quantified and normalized by Hoechst signal intensity. ∗∗∗p < 0.001,∗∗∗∗p < 0.0001, n = 6. Error bars represent ± SD. J, schematic model showing NCL(Kmal)–AKT axis in regulating cell proliferation in HCC.

References

    1. Trub A.G., Hirschey M.D. Reactive acyl-CoA species modify proteins and induce carbon stress. Trends Biochem. Sci. 2018;43:369–379. - PMC - PubMed
    1. Hirschey M.D., Zhao Y. Metabolic regulation by lysine malonylation, succinylation, and glutarylation. Mol. Cell Proteomics. 2015;14:2308–2315. - PMC - PubMed
    1. Wagner G.R., Bhatt D.P., O'Connell T.M., Thompson J.W., Dubois L.G., Backos D.S., et al. A class of reactive acyl-CoA species reveals the non-enzymatic origins of protein acylation. Cell Metab. 2017;25:823–837.e8. - PMC - PubMed
    1. Kulkarni R.A., Worth A.J., Zengeya T.T., Shrimp J.H., Garlick J.M., Roberts A.M., et al. Discovering targets of non-enzymatic acylation by thioester reactivity profiling. Cell Chem. Biol. 2017;24:231–242. - PMC - PubMed
    1. Xu H., Zhou J., Lin S., Deng W., Zhang Y., Xue Y. PLMD: an updated data resource of protein lysine modifications. J. Genet. Genomics. 2017;44:243–250. - PubMed

Publication types

MeSH terms

LinkOut - more resources