. 2024 Oct;65(10):100651.
doi: 10.1016/j.jlr.2024.100651. Epub 2024 Sep 19.

A specific serum lipid signature characterizes patients with glycogen storage disease type Ia

Affiliations

A specific serum lipid signature characterizes patients with glycogen storage disease type Ia

Alessandro Rossi et al. J Lipid Res. 2024 Oct.

Abstract

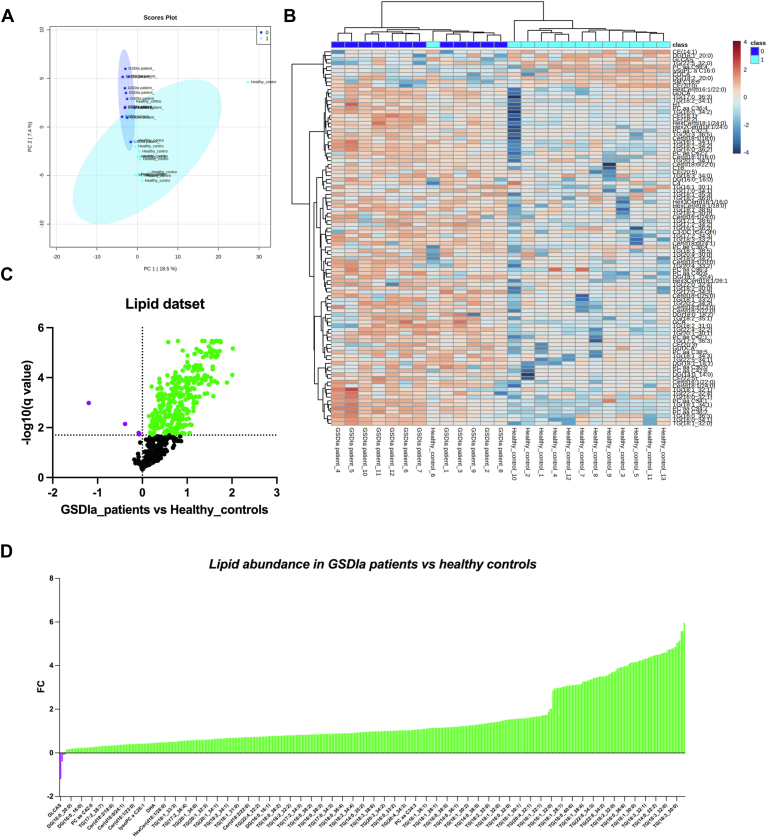
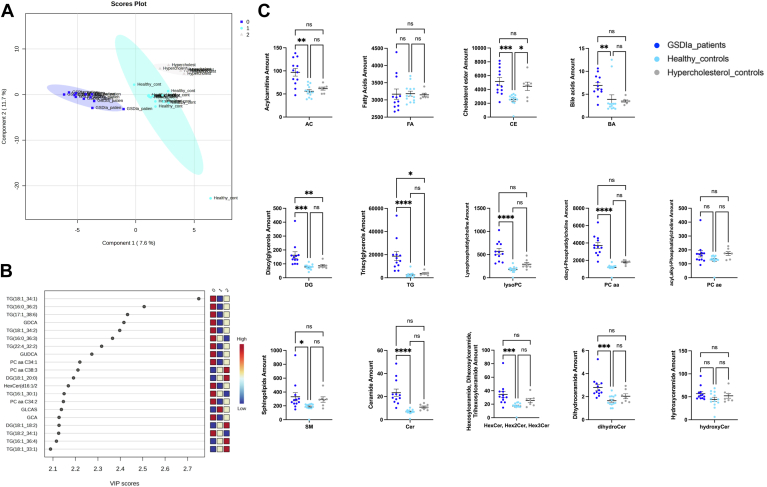
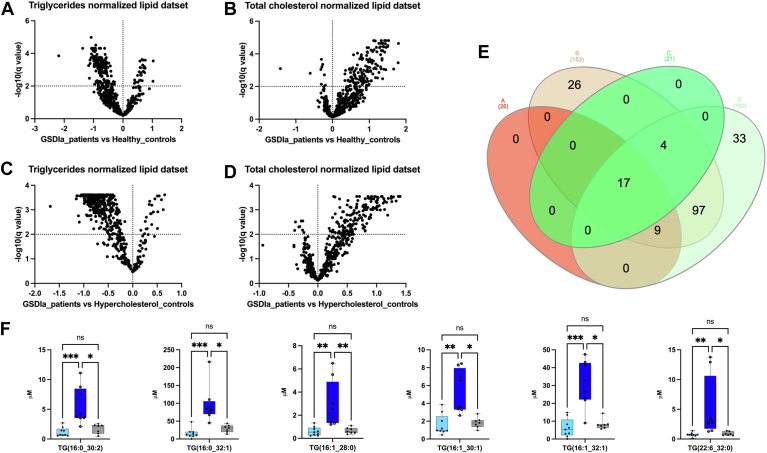
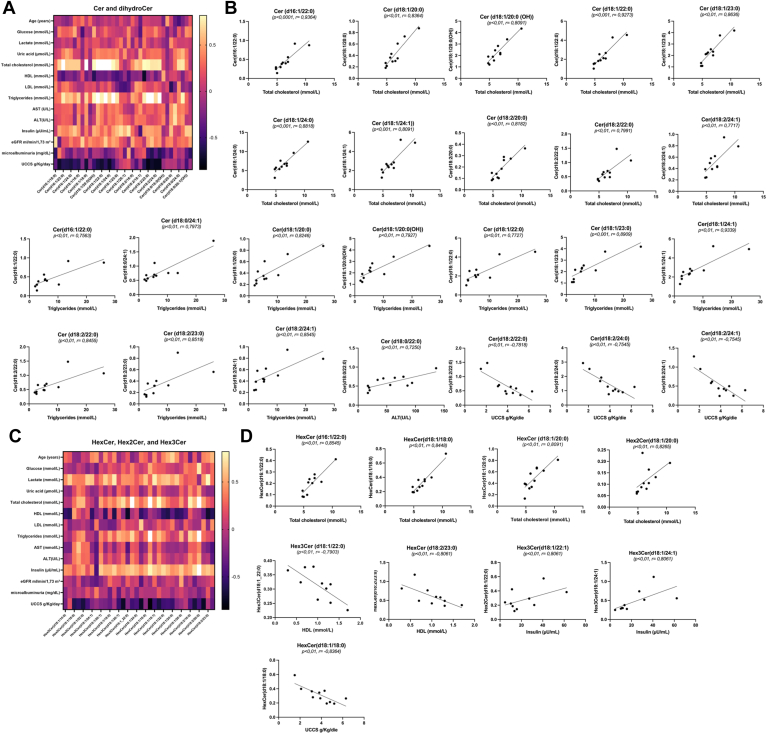
Glycogen storage disease type Ia (GSDIa) is a rare, inherited glucose-6-phosphatase-α (G6Pase-α) deficiency-induced carbohydrate metabolism disorder. Although hyperlipidemia is a hallmark of GSDI, the extent of lipid metabolism disruption remains incompletely understood. Lipidomic analysis was performed to characterize the serum lipidome in patients with GSDIa, by including age- and sex-matched healthy controls and age-matched hypercholesterolemic controls. Metabolic control and dietary information biochemical markers were obtained from patients with GSDIa. Patients with GSDIa showed higher total serum lysophosphatidylcholine (Fold Change, (FC) 2.2, P < 0.0001), acyl-acyl-phosphatidylcholine (FC 2.1, P < 0.0001), and ceramide (FC 2.4, P < 0.0001) levels and bile acid (FC 0.7, P < 0.001), acylcarnitines (FC 0.7, P < 0.001), and cholesterol esters (FC 1.0, P < 0.001) than those of healthy controls, and higher di- (FC 1.1, P < 0.0001; FC 0.9, P < 0.01) and triacylglycerol (FC 6.3, P < 0.0001; FC 3.9, P < 0.01) levels than those of healthy controls and hypercholesterolemic subjects. Both total cholesterol and triglyceride values correlated with Cer (d16:1/22:0), Cer (d18:1/20:0), Cer (d18:1/20:0(OH)), Cer (d18:1/22:0), Cer (d18:1/23:0), Cer (d18:1/24:1), Cer (d18:2/22:0), Cer (d18:2/24:1). Total cholesterol also correlated with Cer (d18:1/24:0), Cer (d18:2/20:0), HexCer (d16:1/22:0), HexCer (d18:1/18:0), and Hex2Cer (d18:1/20:0). Triglyceridelevels correlated with Cer (d18:0/24:1). Alanine aminotransferase values correlated with Cer (d18:0/22:0), insulin with Cer (d18:1/22:1) and Cer (d18:1/24:1), and HDL with hexosylceramide (HexCer) (d18:2/23:0). These results expand on the currently known involvement of lipid metabolism in GSDIa. Circulating Cer may allow for refined dietary assessment compared with traditional biomarkers. Because specific lipid species are relatively easy to assess, they represent potential novel biomarkers of GSDIa.

Keywords: bile acids; ceramides; hyperlipidemia; lysophosphatidylcholine; serum lipidome.


Conflict of interest statement

Conflict of interest The authors declare that they have no conflicts of interest with the contents of this article.

Figures

Fig. 1
Fig. 1
Glycogen storage disease type Ia (GSDIa) lipidomic signature model. A: A principal component analysis (PCA) was performed using the normalized lipid dataset. Patients with GSDIa and healthy controls are represented by different colors (dark blue: patients with GSDIa; light blue: healthy controls). Phenotype conditions showed clear separation according to two principal components (PCs), explaining 25.9% of the total variance (PC1 18.5% and PC2 7.4%). B: Hierarchical cluster analysis and heatmap visualization of the lipid dataset top 100 (y-axis) ranked by a t test (P < 0.05). Serum lipid abundance was log (10) transformed and Pareto scaled. The color code of the heatmap represents the relative metabolite abundance: red and blue represent increased and decreased levels of each lipid in patients with GSDIa versus healthy controls, respectively. C: Volcano plot analysis of differential lipid abundance in patients with GSDIa versus healthy controls. The relative abundance of each lipid was plotted against its statistical significance, reported as Difference (log 10 abundance) and -log10 (q-value), respectively. Purple and green dots refer to significantly decreased and increased lipids. Black dots refer to all the lipids identified in the dataset whose relative abundance is not significantly changed between patients with GSDIa vs. healthy controls. D: The plot shows the differential lipid abundance in patients with GSDIa versus healthy controls. Purple and green bars refer to significantly decreased and increased lipids, respectively.
Fig. 2
Fig. 2
Descriptive discriminant analysis of serum glycogen storage disease type Ia (GSDIa) lipidome. A: Differential segregation (components 1 and 2: 7.2% and 12.5%, respectively) was observed in the serum lipid content of patients with GSDIa and healthy and hypercholesterolemic controls. B: Discriminant features were identified according to the variable importance in projection (VIP) score, and the 20 most important molecules with VIP scores >2.0 were reported. Box color intensity represents the relative abundance for each group. The concentrations of the identified lipids were normalized, log(10) transformed, and Pareto scaled. C: Total lipid content, expressed as the sum of lipid quantity within a specific lipid class (mean ± SEM) in patients with GSDIa (dark blue) and healthy (light blue) and hypercholesterolemic controls (gray). Ceramides reflect those of Supplemental Table S2 with sphingosine and sphingadiene; hydroxyceramides those with sphingosine and sphinganine.
Fig. 3
Fig. 3
Differential lipidome abundance in patients with GSDIa versus healthy controls and hypercholesterol controls. The datasets were normalized according to plasma level of triglycerides and total cholesterol. The relative abundance of each lipid was plotted against its statistical significance, reported as Difference (log 10 abundance) and -log10 (q-value), respectively. GSDIa versus. healthy controls volcano plot analysis of (A) plasma triglycerides and (B) total cholesterol normalized datasets; GSDIa versus hypercholesterol controls volcano plot analysis of (C) plasma triglycerides and (D) total cholesterol normalized datasets; (E) Euler Venn diagram selection of 17 lipid common species shared by all binary comparisons. F: Box and whisker plots summarizing the concentrations of 6 selected lipids, found to be more significant abundant in patients with GSDIa compared to both control groups. Significant differences were established by performing one-way ANOVA followed by a Holm–Sidak multiple comparison test for normally distributed datasets and Kruskal–Wallis and Dunn’s multiple comparison tests for nonnormally distributed datasets (∗P < 0.05, ∗∗P < 0.01, ∗∗∗P < 0.001 ∗∗∗∗P < 0.0001, ns = not significant). Normality was verified according to D’Agostino and Pearson tests. GSDIa, glycogen storage disease type Ia.
Fig. 4
Fig. 4
Spearman’s rank correlations of ceramides/dihydroceramides and hexosylceramides in glycogen storage disease type Ia (GSDIa). The matrix correlates GSDIa serum ceramide/dihydroceramide (A) and hexosylceramide (C) abundances with the diagnostic parameters of patients with GSDIa. The negative and positive associations are represented by dark black and light yellow, respectively. B: Ceramides/dihydroceramides were significantly associated with (i) total cholesterols, (ii) total triacylglycerides, and (iii) ALT (P < 0.01; r > 0.5), as well as (iv) daily UCCS/Glycosade intake (P < 0.01, r < −0.5). D: Hexosylceramides were significantly associated with (i) total cholesterols (ii) HDL, and (iii) insulin (P < 0.01; r > 0.5), as well as (iv) daily UCCS/Glycosade intake (P < 0.01; r < −0.5). The specific values of Spearman rank correlation coefficient are reported in Supplemental Table S7. ALT, alanine aminotransferase; UCCS, uncooked cornstarch.

References

    1. Kishnani P.S., Austin S.L., Abdenur J.E., Arn P., Bali D.S., Boney A., et al. Diagnosis and management of glycogen storage disease type I: a practice guideline of the American College of Medical Genetics and Genomics. Genet. Med. 2014;16:e1–e29. - PubMed
    1. Derks T.G., Rodriguez-Buritica D.F., Ahmad A., de Boer F., Couce M.L., Grünert S.C., et al. Glycogen storage disease type Ia: current management options, burden and unmet needs. Nutrients. 2021;13:3828. - PMC - PubMed
    1. Rossi A., Hoogeveen I.J., Lubout C.M., de Boer F., Fokkert-Wilts M.J., Rodenburg I.L., et al. A generic emergency protocol for patients with inborn errors of metabolism causing fasting intolerance: a retrospective, single-center study and the generation of www.emergencyprotocol.net. J. Inherit. Metab. Dis. 2021;44:1124–1135. - PMC - PubMed
    1. Franco L.M., Krishnamurthy V., Bali D., Weinstein D.A., Arn P., Clary B., et al. Hepatocellular carcinoma in glycogen storage disease type Ia: a case series. J. Inherit. Metab. Dis. 2005;28:153–162. - PubMed
    1. Melis D., Cozzolino M., Minopoli G., Balivo F., Parini R., Rigoldi M., et al. Progression of renal damage in glycogen storage disease type I is associated to hyperlipidemia: a multicenter prospective Italian study. J. Pediatr. 2015;166:1079–1082. - PubMed

Supplementary concepts

LinkOut - more resources