. 2024 Oct:34:348-362.
doi: 10.1016/j.jtos.2024.09.003. Epub 2024 Sep 19.

Changes in conjunctival mononuclear phagocytes and suppressive activity of regulatory macrophages in desiccation induced dry eye

Affiliations

Changes in conjunctival mononuclear phagocytes and suppressive activity of regulatory macrophages in desiccation induced dry eye

Jehan Alam et al. Ocul Surf. 2024 Oct.

Abstract

Purpose: To evaluate the effects of dry eye on conjunctival immune cell number and transcriptional profiles with attention to mononuclear phagocytes.

Methods: Expression profiling was performed by single-cell RNA sequencing on sorted conjunctival immune cells from non-stressed and C57BL/6 mice subjected to desiccating stress (DS). Monocle 3 modeled cell trajectory, scATAC-seq assessed chromatin accessibility and IPA identified canonical pathways. Inflammation and goblet cells were measured after depletion of MRC1+ MΦs with mannosylated clodronate liposomes.

Results: Mononuclear phagocytes (monocytes, MΦs, DCs) comprised 72 % of immune cells and showed the greatest changes with DS. Distinct DS induced gene expression patterns were seen in phagocytes classified by expression of Ccr2 and [Timd4, Lyve1, Folr2 (TLR)]. Expression of phagocytosis/efferocytosis genes increased in TLF+CCR2- MΦs. Monocytes showed the highest expression of Ace, Cx3cr1, Vegfa, Ifngr1,2, and Stat1 and TLF-CCR2+ cells expressed higher levels of inflammatory mediators (Il1a, Il1b, Il1rn, Nfkb1, Ccl5, MHCII, Cd80, Cxcl10, Icam1). A trajectory from monocyte precursors branched to terminate in regulatory MΦs or in mDCs via transitional MΦ and cDC clusters. Activated pathways in TLF+ cells include phagocytosis, PPAR/RXRα activation, IL-10 signaling, alternate MΦ activation, while inflammatory pathways were suppressed. Depletion of MRC1+ MΦs increased IL-17 and IFN-γ expression and cytokine-expressing T cells, reduced IL-10 and worsened goblet loss.

Conclusions: Dryness stimulates distinct gene expression patterns in conjunctival phagocytes, increasing expression of regulatory genes in TLF+ cells regulated in part by RXRα, and inflammatory genes in CCR2+ cells. Regulatory MΦs depletion worsens DS induced inflammation and goblet cell loss.

Keywords: Alternative activation; Conjunctiva; Dry eye; Innate immunity; Macrophage; Phagocyte.


Conflict of interest statement

Declaration of competing interest Patent BLG 22–028; “RXR Agonists in Eye Disorders”; BAYM. P0358WO was filed by Baylor College of Medicine on 1/29/23 and lists SCP and JA as coinventors.

Figures

Fig 1.
Fig 1.
Single-cell RNA sequencing. Single-cell RNA sequencing (scRNA-seq) revealed differences in conjunctival immune cell populations in C57BL/6 mice housed in normal environmental conditions (nonstressed) and after desiccating environmental stress to induce dry eye for 1, 3, 5, and 10 days (DS1,3, 5, 10). A. The entire bulbar conjunctiva from the limbus to the mid tarsal conjunctiva on the upper and lower lids was excised. A similar area was removed from the opposite eye. B. UMAP of 21 distinct immune cell clusters in the conjunctiva generated from single-cell transcriptomic profiles of CD45+ cells sorted from the conjunctiva using Seurat package V4.1.0. C. Bar graph (left) and table (right) of the cell count and percentage (parentheses) of the cells in each cluster. n=16 eyes of 8 mice per group were pooled MΦ = macrophage, cDC2 = conventional dendritic cell 2, cDC1 = conventional dendritic cell 1, mono= monocyte, γδT = gamma delta T cells, ILC2 = innate lymphocyte type 2, CD4-EFF= CD4 effector T cell, CD8-EFF= CD8 effector T cell, T reg = regulatory T cell, CD4-Tn = naïve CD4 T cell, CD8-Tn = naïve CD8 T cell, NK = natural killer cell, NKT = natural killer cell, mDC= monocyte derived dendritic cell, pDC = plasmacytoid dendritic cell
Fig 2.
Fig 2.
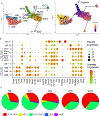
RNA Trajectory, gene expression profiles and ratios of monocular phagocyte subgroups. A. Trajectory and pseudotime trajectory modeled by Monocle 3. Progenitor monocyte to dendritic cell and macrophage (MΦ) differentiation trajectory (left) and pseudotime trajectory (right). Numbers in trajectory correspond to cluster numbers in Figure 1. Black circles are branch nodes and grey circles are different outcomes.; B. Dot plot of top differentially expressed genes in TLFCCR2+ (TLF= Timd4, Lyve-1, Folr2), TLF+CCR2 MΦs. conventional dendritic cell 1 (cDC1), plasmacytoid dendritic cell (pDC) and monocyte derived DC (mDC). Size of the dot equates to the percent of cells in the cluster expressing the marker. Color of dots based on natural log of the normalized RNA expression.; C. Proportions of cells depicted in 2B. in the nonstressed (NS) conjunctiva and after 1, 3, 5 and 10 days of desiccating stress (DS).
Fig 3.
Fig 3.
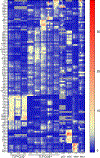
Differentially expressed genes (DEG) induced by desiccating stress (DS) dry eye in myeloid cells, including mononuclear phagocytes and TLFCCR2+ and TLF+CCR2 subgroups. DESeq2 was used to identify DEGs shown in the heatmap that have ≥ 2 log fold difference and Padj value ≤ 0.001 compared to non-stressed (NS) group in at least one of the cells/groups.
Fig 4.
Fig 4.
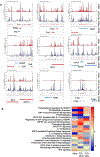
A. Comparison of chromatin accessibility evaluated by ATAC-seq in DEGs in monocytes (top line) or MΦ (bottom line). Coverage plots visualize the depth of sequencing coverage in genes with significantly increased expression with DS in monocytes (C2 and C3; Il1b, Ccr2, Nfkb1, Ccl5) or MΦs (clusters C0, C10–12; Rxra, Lyve1, Mrc1, Gas6 and C1qa-c). Accessibility peaks show regions of open chromatin suggesting potential regulatory elements in these genes, and higher peaks indicate higher read densities. Peaks in monocytes are in red in the upper rows and peaks in MΦs are in blue in the lower rows. B. Pathway analysis. Heatmap of canonical pathways identified in DEGs in monocytes (mono), TLFCCR2+ cells and TLF+CCR2 MΦ using Ingenuity Pathway Analysis (Qiagen). Relevant canonical pathways were identified and activation strengths were calculated based on fold changes and Padj values of DEGs. Z scores for activated (positive) and inhibited (negative) pathways are shown on right Y-axis.
Fig 5.
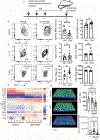
Fig 5.. MRC1+ MΦ in the conjunctiva and phagocyte activity of MRC1+ MΦ.
A. Confocal micrographs of conjunctival wholemounts from a nonstressed 8-week-old female B6 mouse (left) and 50-year-old female human stained for MRC1 or MCR1 and CD11b. DNA is stained with DAPI. Biopsies were taken from the bulbar conjunctiva and epithelium (E) and stroma (S) are labeled. B. Left. Flow cytometry gating strategy for CD11b+ and MRC1+ cells from the conjunctiva of nonstressed (NS) C57BL/6 (B6) mice and those exposed to DS for 5 days (DS5), n=12 biological replicates. Live CD45+ cells were gated for CD11b+ and these were further gated on MRC1+ cells. Right. Bar graphs of mean ± SEM of percent CD45+ cells, % CD11b+ cells, % MRC1+ cells out if CD11b+ cells and count of MRC1+ cells. (two-tailed T test, * P ≤ 0.01, ** P ≤ 0.001, *** P ≤ 0.001) C. Phagocytosis is increased in MRC1+ macrophages. Phagocytosis in bone marrow derived MΦ incubated with FITC-labeled E. coli particles or ovalbumin (Ova) was accessed. Flow cytometry was performed to detect dual MRC1(CD206)+FITC+ or MRC1(CD206)+Ova+ cells. Significantly greater phagocytosed bacterial particles (left) and Ova (right) were seen in the MRC1+ group (n=6 biological replicates for bioparticles and n=7 for Ova) in cells from wild type B6 (mean ± SEM, two-tailed T test, **** P ≤ 0.0001, *** P ≤ 0.001). D. Phagocytosis is impaired in the RXRa mutant Pinkie strain. Phagocytosis in bone marrow derived MΦ incubated with FITC-labeled E. coli particles or ovalbumin (Ova) was accessed. Flow cytometry was performed to detect dual MRC1(CD206)+FITC+ or MRC1(CD206)+Ova+ cells from wild type B6 or RXRa mutant Pinkie strain. Significantly greater phagocytosed bacterial particles (left) and Ova (right) were seen in MRC1+ cells from B6 than the RXRa mutant Pinkie strain (n=8 biological replicates per group, mean ± SEM, two-tailed T test, **** P ≤ 0.0001, * P≤0.01).
Fig 6.
Fig 6.. Clodronate depletion experiment
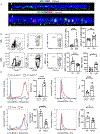
A. Experimental design: C57BL/6 mice received subconjunctival injections of mannosylated liposomes to deplete MRC1+ phagocytes or PBS-loaded liposomes (vehicle) at days −2, 0, +2 of initiation of desiccating stress (DS) to induce dry eye. Flow cytometry, measurement of conjunctival goblet cells, corneal barrier function and gene expression were performed on DS5. B. MRC1 depletion. MRC1+ cells were gated from CD11b+ isolated from the conjunctiva of the vehicle and clodronate treated groups. Mannosylated liposomes decreased MRC1+ MΦ by >50% and increased the percentage of MRC1 cells compared to PBS-loaded liposomes (n=14 biological replicates per group, bar graphs of mean ± SEM, 2 tailed T test, *** P ≤ 0.001). C. Subconjunctival mannosylated clodronate (Clod) significantly increased the percentage of IL17+ (top) and IFNg+ (bottom) CD3+ T cells compared to PBS vehicle loaded liposomes (Veh), Dot flow plots left and percentage of cytokine positive cells and mean fluorescence intensity (MFI) on the right. (n=15–17 biological replicates per group, bar graphs of mean ± SEM, 2 tailed T test, * P ≤ 0.05). D. Comparison of significant differentially expressed genes between the vehicle and mannosylated clodronate treated groups in sorted conjunctival CD45+ cells using Nanostring mouse V2 inflammation array. Two tailed T test with FDR correction ≤ 0.001 (calculated with two-stage set-up method Benjamini, Krieger and Yekutieli), n=6 biological replicates per group. E. Goblet cells were evaluated in conjunctival wholemount tissues and viewed by confocal microscopy. Representative conjunctival tissues from NS, vehicle-treated and clodronate treated reacted with Alexafluor 488 conjugated WGA lectin to stain goblet cells. Goblet cell counts and volume are shown in the three groups is shown on the left. (n=15–17 biological replicates per group, bar graphs of mean ± SEM, two-way ANOVA, * P ≤ 0.05, **P ≤ 0.01).
Fig 7.
Fig 7.
Summary Figure. Left: MRC1+TLF+CCR2 MΦ phagocytes are found in the normal conjunctiva where they phagocytose goblet cell secretory products and antigens passing through goblet cell passages (GAPs). They are replaced by circulating monocytes and TLFCCR2+ MΦs that are conditioned by PPAR/RXRa ligands, IL-10 and IL-13 in the conjunctival niche. Right: In acute dry eye, monocytes are recruited from the blood in response to CCL-2 produced by stressed epithelial and resident monocytes and MΦs. They maybe conditioned by the local environment to MRC1+ TLF+CCR2 MΦs that modulate inflammation and clear debris from apoptotic cells through efferocytosis or to TLFCCR2+ MΦs that produce chemokines and cytokines, such as Il1b that can stimulate IL-17 production by γδ T cells and amplify dry eye inflammation. Aging and systemic vitamin A deficiency appear to reduce conditioning of MRC1+ MΦs. Figure was created with BioRender.com.

References

    1. Pflugfelder SC, de Paiva CS. The Pathophysiology of Dry Eye Disease: What We Know and Future Directions for Research. Ophthalmology. 2017;124:S4–s13. - PMC - PubMed
    1. Roda M, Corazza I, Bacchi Reggiani ML, Pellegrini M, Taroni L, Giannaccare G, et al. Dry Eye Disease and Tear Cytokine Levels-A Meta-Analysis. International journal of molecular sciences. 2020;21. - PMC - PubMed
    1. Lam H, Bleiden L, de Paiva CS, Farley W, Stern ME, Pflugfelder SC. Tear cytokine profiles in dysfunctional tear syndrome. American journal of ophthalmology. 2009;147:198–205. e1. - PMC - PubMed
    1. Chotikavanich S, de Paiva CS, Li de Q, Chen JJ, Bian F, Farley WJ, et al. Production and activity of matrix metalloproteinase-9 on the ocular surface increase in dysfunctional tear syndrome. Investigative ophthalmology & visual science. 2009;50:3203–9. - PMC - PubMed
    1. Epstein SP, Gadaria-Rathod N, Wei Y, Maguire MG, Asbell PA. HLA-DR expression as a biomarker of inflammation for multicenter clinical trials of ocular surface disease. Experimental eye research. 2013;111:95–104. - PMC - PubMed