. 2024 Oct 22;43(10):114783.
doi: 10.1016/j.celrep.2024.114783. Epub 2024 Sep 21.

Geranylgeranylated SCFFBXO10 regulates selective outer mitochondrial membrane proteostasis and function

Affiliations

Geranylgeranylated SCFFBXO10 regulates selective outer mitochondrial membrane proteostasis and function

Sameer Ahmed Bhat et al. Cell Rep. .

Abstract

Compartment-specific cellular membrane protein turnover is not well understood. We show that FBXO10, the interchangeable component of the cullin-RING-ligase 1 complex, undergoes lipid modification with geranylgeranyl isoprenoid at cysteine953, facilitating its dynamic trafficking to the outer mitochondrial membrane (OMM). FBXO10 polypeptide lacks a canonical mitochondrial targeting sequence (MTS); instead, its geranylgeranylation at C953 and interaction with two cytosolic factors, cytosolic factor-like δ subunit of type 6 phosphodiesterase (PDE6δ; a prenyl-group-binding protein) and heat shock protein 90 (HSP90; a chaperone), orchestrate specific OMM targeting of prenyl-FBXO10. The FBXO10(C953S) mutant redistributes away from the OMM, impairs mitochondrial ATP production and membrane potential, and increases fragmentation. Phosphoglycerate mutase-5 (PGAM5) was identified as a potential substrate of FBXO10 at the OMM using comparative quantitative proteomics of enriched mitochondria. FBXO10 loss or expression of prenylation-deficient FBXO10(C953S) inhibited PGAM5 degradation, disrupted mitochondrial homeostasis, and impaired myogenic differentiation of human induced pluripotent stem cells (iPSCs) and murine myoblasts. Our studies identify a mechanism for FBXO10-mediated regulation of selective mitochondrial proteostasis potentially amenable to therapeutic intervention.

Keywords: CP: Metabolism; CP: Molecular biology; E3-ligase; F-box protein; FBXO10; HSP90; PDE6δ; mitochondria; prenylation; trafficking; ubiquitination.


Conflict of interest statement

Declaration of interests The authors declare no competing interests.

Figures
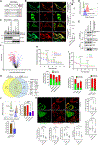
Figure 1.
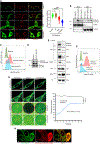
Figure 1.. Mitochondrial function and selective proteostasis at the outer mitochondrial membrane controlled by FBXO10
(A) FBXO10 orthologs contain a C-terminal CaaX motif with cysteine953 conserved across species. (B) HeLa cells expressing GFP-FBXO10 (rows 1, 3, and 4) and GFP-FBXO10(C953S) mutant (row 2) were probed with organelle-specific markers, as indicated. Live-cell confocal imaging is shown by representative captured images. Pearson correlation coefficients (PCC) analysis for the sub-cellular organelle colocalization was performed. MitoTracker, n = 64 for FBXO10 and n = 35 for FBXO10(C953S); PMV-SeQ, n = 85 for FBXO10 and n = 70 for FBXO10(C953S); ER-Tracker, n = 157 for FBXO10 and n = 33 for FBXO10(C953S). The p values were calculated by Student’s t test. Error bars indicate SEM. Scale bars, 10 μm. (C) Cell lysates from the indicated constructs were subjected to stepwise ultracentrifugation. Enriched mitochondrial and cytosolic fractions were assayed by immunoblotting as indicated. A representative of three independent experiments is shown. (D) Enriched mitochondrial fractions from HEK293T cells expressing fluorescent constructs, as indicated, were incubated with MitoView green, allowing mitochondrial tracking during flow cytometry analysis (FACS) quantification. A representative of three independent experiments is shown. (E) HEK293T cells expressing cDNA constructs, as indicated, were treated with lysis, Strep-Tactin immunoprecipitation, and immunoblotting as shown. Shown is a representative of three independent experiments. (F) The volcano plot shows significantly altered proteins between FBXO10 and FBXO10(C953S) datasets assayed by label-free quantitative mass spectrometry analysis (LFQ-MS/MS) of enriched mitochondrial fractions from indicated samples. OMM proteins with significant reciprocal protein level changes are highlighted (≥2-fold, at FDR 5%). Three independent biological replicates of each sample were assayed by LFQ-MS/MS. (G) Venn diagram depicts overlap of significantly deregulated protein numbers revealed by analysis of indicated LFQ-MS/MS datasets. A list of 18 OMM proteins that decrease upon FBXO10 but increase upon FBXO10(C953S) expression is shown (≥2-fold, at FDR 5%). Three independent biological replicates of each sample were assayed by LFQ-MS/MS. (H) Mitochondrial ATP production measurements by Seahorse assay in C2C12 cells stably expressing FBXO10, FBXO10(C953S), FBXO10 (ΔF-box), and empty vector (EV). Line graphs show oxygen consumption rate (OCR) and bar graphs show mitochondrial and glycolytic ATP production rate (pmol/min) obtained from OCR and extracellular acidification rate (ECAR) measurements. Quantifications represent 10 biological replicates. Error bars indicate SEM. (I) Measurement of mitochondrial ATP production by Seahorse assay in C2C12 samples (controls, shRNA depleted for FBXO10 and CRISPR-Cas9-deleted FBXO10 clone) performed as in (H). n = 10 for shCon, sh3UTR, and shCDS; n = 11 for FBXO10+/+; and n = 9 for FBX010−/−. n, biological replicates. Error bars indicate SEM. (J) Measurement of mitochondrial membrane potential by flow cytometry upon Tetramethylrhodamine (TMRM) treatment (100 nM) in differentiated C2C12 cells stably expressing FBXO10, FBXO10(C953S), FBXO10(ΔF-box), or EV and an FBXO10-gene-deleted C2C12 clone (bottom). Bar graphs represent quantifications. n = 3 for EV, FBXO10, FBXO10(C953S), and FBXO10(ΔF-box); n = 4 for FBXO10+/+; n = 9 for FBX010−/−. n, biological replicates; p values were calculated by Student’s t test. Error bars indicate SEM. (K) HeLa cells expressing GFP-FBXO10 (top) and GFP-FBXO10(C953S) (bottom) were treated with MitoTracker prior to live-cell confocal imaging using a ZEISS-LSM750 microscope. Representative images depict the changes in mitochondrial network dynamics. Green arrows, transfected cells. White arrows, non-transfected cell in the same field of view. Scatterplots show mitochondrial morphological descriptors analyzed using ImageJ and Mitochondria-Analyzer software. Mitochondrial network areas (n = 18 NT, n = 19 FBXO10, n = 21 FBXO10(C953S)), average perimeter/branch lengths (n = 19 NT, n = 19 FBXO10, n = 21 FBXO10(C953S)), branches/mito (n = 17 NT, n = 19 FBXO10, n = 21 FBXO10(C953S)); p values were calculated by Student’s t test. Error bars indicate SEM. Scale bars, 5 μm. See also Figure S1 and Table S1.
Figure 2.
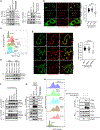
Figure 2.. Geranylgeranylation of CaaX-cysteine953 is indispensable for the distribution of FBXO10 at the outer mitochondrial membrane
(A) HeLa cells expressing GFP-FBXO10 were treated with GGTi-2418 (50 μM), FTi-lonafarnib (10 μM), lovastatin (15 μM), and vehicle for 16 h. Representative confocal images depict the mitochondrial distribution of indicated samples. Scatterplots show the statistical analysis of plotted Pearson correlation coefficients for the colocalization of GFP-FBXO10 and mitochondria (vehicle, n = 70; GGTi, n = 72; Fti, n = 73; and lovastatin, n = 77). The p values were calculated by Student’s t test. Scale bars, 10 μm. (B) HEK293T cells expressing Strep-tagged FBXO10 cells were treated with GGTi-2418 (50 μM) or DMSO for 16 h. Enriched-mitochondrial and cytosolic fractions isolated by stepwise centrifugation were immunoblotted as indicated. Shown is a representative of two independent experiments. (C) HeLa cells expressing ptd-Tomato-FBXO10 were treated with GGTi-2418 (50 μM) or DMSO for 16 h. Enriched mitochondrial fractions were isolated by stepwise centrifugation and incubated with MitoView green to facilitate mitochondrial tracking during flow cytometry analysis for the quantification of mitochondria-associated FBXO10 signal. Shown are representative FACS histograms of three independent experiments. (D) HEK293T cells expressing FLAG-FBXO10 and FLAG-FBXO10(C953S) were metabolically labeled with tritiated (3H) mevalonolactone according to the protocol described in the STAR Methods. Tritium (3H)-labeled anti-FLAG immunocomplexes and lysates were subjected to autoradiography (top) and immunoblotting (bottom) as indicated. Asterisk indicates non-specific band. (E) Enriched intact mitochondrial fractions were isolated from HEK293T cells expressing Strep-FBXO10 by stepwise centrifugation. Isolated mitochondrial fractions were subjected to trypsin protease protection (TPP) assay as described in the STAR Methods and immunoblotted for the SCF-FBXO10 components and sub-mitochondrial membrane compartment-specific markers, as indicated. A representative of three independent experiments is shown. (F) Enriched intact mitochondrial fractions isolated from HEK293T cells expressing GFP-FBXO10 by stepwise centrifugation underwent TPP assay as in (E) followed by flow cytometry analysis to quantify mitochondria-associated GFP-FBXO10 signal. Representatives of three independent experiments are shown. (G) Fluorescence recovery after photobleaching (FRAP) analysis, as described in the STAR Methods, was carried out to monitor the mobility of FBXO10 in HeLa cells expressing GFP-FBXO10. Shown are representative images of bleached, pre-bleached, and post-bleached samples, as indicated, from 18 independent cells analyzed for FRAP. The plot shows the averaged GFP-FBXO10 signal recovery of 18 independent bleached areas from separate cells. The GFP signal before photodestruction was set as 100%. Calculated recovery rate: 0.23 ± 0.04 (%/μm2/s). Error bar: SEM. (H) HeLa cells were cotransfected with GFP-FBXO10 and ptd-Tomato-FBXO10(C953S). Representative confocal images depict the changes in mitochondrial distribution of GFP-FBXO10 upon coexpression with various doses of ptd-Tomato-FBXO10(C953S). Numbers indicate cells with varying doses of cotransfected FBXO10(C953S). 1, no cotransfection; 2 and 3, low dose; 4, high dose. Scale bars, 10 μm. See also Figure S2.
Figure 3.
Figure 3.. The lipid-binding PDE6δ chaperone mediates delivery of geranylgeranylated FBXO10 to the OMM
(A) Strep-tagged cDNA constructs, as indicated, were expressed in HEK293T cells. Strep-Tactin immunoprecipitations and immunoblotting were performed, as indicated. Representatives of three independent experiments are shown. (B) FLAG-tagged indicated F-box family proteins were expressed in HEK293T. Anti-FLAG immunoprecipitations and immunoblotting were performed, as indicated. Representatives of two independent experiments are shown. (C) Lovastatin (15 μM) treatment was carried out for 16 h in Strep-tagged PDE6δ- and empty vector (EV)-expressing HEK293T cells. Strep-Tactin immune-precipitations and immunoblotting were performed, as indicated. (D) Strep-tagged FBXO10-expressing HEK293T cells were treated with deltarasin (2.5 μM) or DMSO overnight. Strep-Tactin immunoprecipitations and immunoblotting were performed, as indicated. Bar graph shows quantification of PDE6δ binding (n = 2). Error bar: SEM. A representative of two independent experiments is shown. (E) GFP-FBXO10 and mCherry-PDE6δ were cotransfected into HeLa cells overnight. Live-cell confocal images were captured with a ZEISS LSM750 confocal microscope. Green arrow, delocalization of GFP-FBXO10. White arrow, typical OMM distribution of GFP-FBXO10. Shown is a representative of three independent experiments. Scale bars, 10 μm. (F) HeLa cells expressing GFP-FBXO10 were transfected with siRNA targeting PDE6δ or non-targeting siRNA and treated with MitoTracker. Confocal images were captured using a ZEISS LSM750 microscope. Shown are representative images of three independent experiments. Scale bars, 5 μm. (G) Deltarasin (2.5 μM) or DMSO treatment was carried out in HeLa cells expressing GFP-FBXO10 for 16 h. MitoTracker was added before live-cell confocal imaging using a ZEISS LSM700 microscope. Shown are representatives of two independent experiments. Scale bars, 5 μm. See also Figure S3 and Table S2.
Figure 4.
Figure 4.. HSP90 coordinates with PDE6δ for the specific targeting of geranylgeranylated FBXO10 to the OMM
(A) Strep-tagged FBXO10 and FBXO10(C953S) were expressed in HEK293T cells. Strep-Tactin immunoprecipitations and immunoblotting were performed, as indicated. Shown are representatives of three independent experiments. (B) CCT018159 (HSP90i: 10 μM), PES-Cl (HSP70i: 5 μM), or DMSO treatment was carried out in HeLa cells expressing GFP-FBXO10 for 16 h, as indicated. MitoTracker was added before live-cell confocal imaging using a ZEISS LSM750 microscope. Shown are representative images of two independent experiments (n = 70 for DMSO, n = 47 for PES-Cl, and n = 29 for CCT018159). Scatterplots show statistical analysis of plotted Pearson correlation coefficients for the colocalization of GFP-FBXO10 and mitochondria. The p values were calculated by Student’s t test. Scale bars, 5 μm. (C) Enriched intact mitochondrial fractions, as part of the experiment in Figure 2C, were treated with CCT018159 (10 μM), PES-Cl (10 μM), or DMSO for 16 h. Before fractionation MitoView green was added for flow cytometry analysis to quantify mitochondria-associated ptd-Tomato-FBXO10 signal. Representatives of three independent experiments are shown. (D) HEK293T cells expressing FLAG-tagged FBXO10 were treated with PES-Cl (10 μM), CCT018159 (10 μM), or vehicle DMSO for 16 h. Enriched mitochondrial and cytosolic fractions were immunoblotted, as indicated. Representatives of three independent experiments are shown. (E) Non-targeting siRNA or siRNA targeting HSP90 and HSP70 were transfected into HeLa cells, and GFP-FBXO10 was expressed for 20 h before MitoTracker incubation for ~30 min for visualization by live-cell confocal microscopy using a ZEISS LSM750 microscope. Shown are representative images (n = 38 for siRNA NT, n = 37 for siRNA HSP70, and n = 29 for siRNA HSP90). Scatterplots show statistical analysis of plotted Pearson correlation coefficients for the colocalization of GFP-FBXO10 and mitochondria. The p values were calculated by Student’s t test. Scale bars, 5 μm. (F) HEK293T cells expressing FLAG-tagged FBXO10 were treated with deltarasin and/or CCT018159 overnight. Strep-Tactin immunoprecipitations and immunoblotting were performed, as indicated. Representatives of two independent experiments are shown. (G) Strep-tagged PDE6δ was coexpressed with FLAG-FBXO10 and FLAG-FBXO10(C953S) in HEK293T cells. Strep-Tactin immunoprecipitations and immunoblotting were performed as indicated. Representatives of two independent experiments are shown. (H) Enriched intact mitochondrial fractions were isolated from ptd-Tomato-FBXO10-expressing HEK293T cells treated with DMSO, CCT018159, and deltarasin alone or in combination as indicated for 16 h. MitoView green was added for flow cytometry analysis to quantify mitochondria-associated ptd-Tomato-FBXO10 signal shown as representative FACS histograms. (I) HEK293T cells were transfected with FLAG-tagged FBXO10, GFP-FBXO10(C953S), or empty vector either individually or in combination, as indicated. Anti-FLAG immunoprecipitations and immunoblotting were performed as indicated. Representatives of two independent experiments are shown. See also Figure S4 and Table S2.
Figure 5.
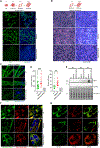
Figure 5.. Geranylgeranylation-deficient FBXO10(C953S) impairs mitochondria-driven myogenic differentiation in iPSCs and murine myoblasts
(A) Human iPSCs stably expressing FLAG-FBXO10 or FLAG-FBXO10(C953S) and vehicle controls (EV) were differentiated for 20 days to myotubes. At the endpoint, the samples were immunostained with myosin heave chain (MyH) antibody conjugated to an A488 fluorescent probe. Hoechst was added to stain nuclei prior to visualization by ZEISS LSM700 confocal microscopy. Scale bars, 20 μm. (B) Murine C2C12 myoblasts stably expressing FLAG-FBXO10 or FLAG-FBXO10(C953S) and vehicle controls (EV) were differentiated for 5 days to myotubes. At the endpoint, the samples were treated with Hoechst and visualized by live-cell bright-field and florescence microscopy. Scale bars, 235.6 μm. (C) Murine C2C12 myoblasts stably expressing FLAG-FBXO10 or FLAG-FBXO10(C953S) and vehicle controls (EV) were differentiated for 7 days to myotubes. At the endpoint, the samples were processed as in (A) for imaging. Scale bars, 20 μm. (D) Indicated differentiated samples processed as in (C) were analyzed for myotube length and width measurements using ImageJ software, and scatterplots were generated using GraphPad Prism software. NA, not analyzed because of non-detectable MyH-positive myotubes (myotube length, n = 49 for EV and n = 24 for FBXO10; myotube width, n = 20 for EV and n = 25 for FBXO10). Error bars: SEM. (E) Murine C2C12 myoblasts stably expressing FLAG-FBXO10 or FLAG-FBXO10(C953S) and vehicle controls (EV) were differentiated up to 7 days to myotubes. At 0, 2, and 7 day time points, the samples were collected for immunoblotting, as indicated. Representatives of two independent experiments are shown. (F) Murine C2C12 myoblasts stably expressing FLAG-FBXO10 or FLAG-FBXO10(C953S) and vehicle controls (EV) were differentiated for 8 days for myotube formation. At the endpoint samples were treated with MitoTracker red, MitoView green, and Hoechst to decorate mitochondria and nuclei. In the representative images captured by ZEISS LSM700 confocal microscopy, mitochondrial and myotube morphology is shown. Scale bars, 5 μm. (G) The mitophagy probe mito-Keima was stably coexpressed in murine C2C12 myoblasts expressing FLAG-FBXO10 or FLAG-FBXO10(C953S) and vehicle controls (EV). As indicated, 7-day-differentiated myotubes were analyzed for mitophagy status by live-cell confocal microscopy using 488 and 555 excitation lasers. Representative images, captured by ZEISS LSM700 confocal microscopy, show mitophagy-positive mitochondria/lysosomal (red) and mitophagy-negative mitochondrial (green) networks. See also Figure S5.
Figure 6.
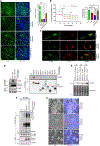
Figure 6.. FBXO10 loss impairs myogenic differentiation
PGAM5 is targeted for FBXO10-mediated degradation during myogenic differentiation. (A) FBXO10 depletion was carried out with two independent shRNAs, as indicated, in C2C12 myoblasts. In parallel, FLAG-FBXO10 expression was reconstituted in 3′ UTR shRNA-treated C2C12 myoblasts (sh3′UTR/FBXO10). Samples were subjected to 7 days of myogenic differentiation to generate myotubes and processed as in (Figure 5A) for visualization by ZEISS LSM700 confocal microscopy. Properly formed myotubes were counted, and quantifications are shown as bar graphs (n = 7 control shRNA, n = 10 shCDS, N = 10 3′ UTR, and n = 15 sh3′UTR/FBXO10, where n represents the fields of view). The p values were calculated by Student’s t test. Scale bars, 20 μm. Error bars: SEM. (B) FBXO10 depletion, reconstitution, and myogenic differentiation was carried out as in (A). Measurement of mitochondrial ATP production was carried out by Seahorse assay. Line graphs show oxygen consumption rate (OCR), and bar graph shows mitochondrial and glycolytic ATP production rate obtained from OCR and ECAR measurements from eight biological replicates. Error bars: SEM. (C) Mito-Keima, a mitochondria-specific mitophagy probe, was stably coexpressed in murine C2C12 myoblasts expressing control shRNA, two independent shRNAs targeted to untranslated (3′ UTR) and coding sequence (CDS). Samples were differentiated and processed for mitophagy analysis as in Figure 5G. Red, mitophagy positive; green, mitophagy negative. (D) Left: C2C12 myoblasts stably expressing FLAG-FBXO10 or FLAG-FBXO10(C953S) and vehicle control (EV) were differentiated for 2 days. Right: FLAG-tagged FBXO10, indicated F-box-family proteins, and empty vector (EV) were expressed in HEK293T cells. Anti-FLAG immunoprecipitations and immunoblotting were performed as indicated. Shown are representatives of two independent experiments. (E) Parental C2C12 and CRISPR-Cas9-deleted FBXO10 myoblasts were subjected to myogenic differentiation for up to 7 days before sample harvesting at the indicated time points for immunoblotting, as indicated. Shown is a representative of two independent experiments. (F) FLAG-tagged TR-TUBE, wild type and mutant, was expressed in HeLa cells as indicated. Anti-FLAG immunoprecipitations and immunoblotting were performed as indicated. The bracket on the right marks polyubiquitylated PGAM5. Shown are representatives of two independent experiments. (G) Parental C2C12 and two independent CRISPR-Cas9-deleted FBXO10 clones (CRISPR #1 and CRISPR #2), as indicated, were differentiated for 7 days. At the endpoint, the samples were treated with Hoechst and visualized by bright-field and immunofluorescence microscopy. Scale bars, 59.9 μm. See also Figure S6.

Update of

References

    1. Skaar JR, Pagan JK, and Pagano M (2013). Mechanisms and function of substrate recruitment by F-box proteins. Nat. Rev. Mol. Cell Biol. 14, 369–381. 10.1038/nrm3582. - DOI - PMC - PubMed
    1. Petroski MD, and Deshaies RJ (2005). Function and regulation of cullin-RING ubiquitin ligases. Nat. Rev. Mol. Cell Biol. 6, 9–20. 10.1038/nrm1547. - DOI - PubMed
    1. Cox AD, and Der CJ (1992). Protein prenylation: more than just glue? Curr. Opin. Cell Biol. 4, 1008–1016. 10.1016/0955-0674(92)90133-w. - DOI - PubMed
    1. Berndt N, Hamilton AD, and Sebti SM (2011). Targeting protein prenylation for cancer therapy. Nat. Rev. Cancer 11, 775–791. 10.1038/nrc3151. - DOI - PMC - PubMed
    1. Michaelson D, Silletti J, Murphy G, D’Eustachio P, Rush M, and Philips MR (2001). Differential localization of Rho GTPases in live cells: regulation by hypervariable regions and RhoGDI binding. J. Cell Biol. 152, 111–126. 10.1083/jcb.152.1.111. - DOI - PMC - PubMed

LinkOut - more resources