

Integrated multi-omics unveil the impact of H-phosphinic analogs of glutamate and α-ketoglutarate on Escherichia coli metabolism
- PMID: 39307306
- PMCID: PMC11533085
- DOI: 10.1016/j.jbc.2024.107803
Integrated multi-omics unveil the impact of H-phosphinic analogs of glutamate and α-ketoglutarate on Escherichia coli metabolism
Abstract
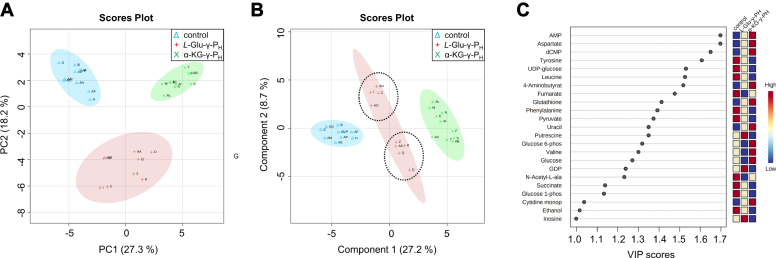
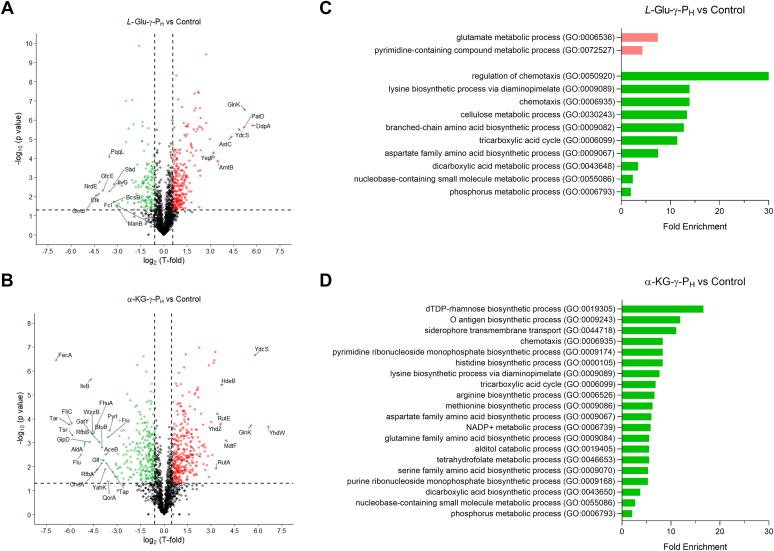
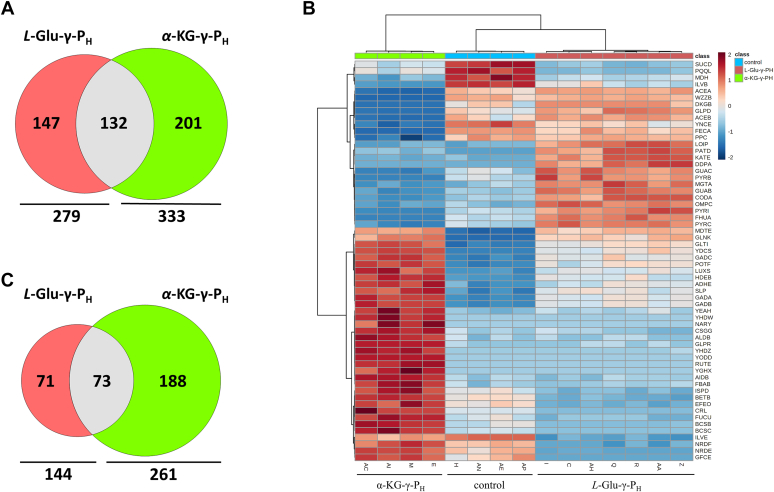
Desmethylphosphinothricin (L-Glu-γ-PH) is the H-phosphinic analog of glutamate with carbon-phosphorus-hydrogen (C-P-H) bonds. In L-Glu-γ-PH the phosphinic group acts as a bioisostere of the glutamate γ-carboxyl group allowing the molecule to be a substrate of Escherichia coli glutamate decarboxylase, a pyridoxal 5'-phosphate-dependent α-decarboxylase. In addition, the L-Glu-γ-PH decarboxylation product, GABA-PH, is further metabolized by bacterial GABA-transaminase, another pyridoxal 5'-phosphate-dependent enzyme, and succinic semialdehyde dehydrogenase, a NADP+-dependent enzyme. The product of these consecutive reactions, the so-called GABA shunt, is succinate-PH, the H-phosphinic analog of succinate, a tricarboxylic acid cycle intermediate. Notably, L-Glu-γ-PH displays antibacterial activity in the same concentration range of well-established antibiotics in E. coli. The dipeptide L-Leu-Glu-γ-PH was shown to display an even higher efficacy, likely as a consequence of an improved penetration into the bacteria. Herein, to further understand the intracellular effects of L-Glu-γ-PH, 1H NMR-based metabolomics, and LC-MS-based shotgun proteomics were used. This study included also the keto-derivative of L-Glu-γ-PH, α-ketoglutarate-γ-PH (α-KG-γ-PH), which also exhibits antimicrobial activity. L-Glu-γ-PH and α-KG-γ-PH are found to similarly impact bacterial metabolism, although the overall effect of α-KG-γ-PH is more pervasive. Notably, α-KG-γ-PH is converted intracellularly into L-Glu-γ-PH, but the opposite was not found. In general, both molecules impact the pathways where aspartate, glutamate, and glutamine are used as precursors for the biosynthesis of related metabolites, activate the acid stress response, and deprive cells of nitrogen. This work highlights the multi-target drug potential of L-Glu-γ-PH and α-KG-γ-PH and paves the way for their exploitation as antimicrobials.
Keywords: LC-MS; NMR; desmethylphosphinothricin; glutamate; multi-omics; multi-target drug; nitrogen starvation; phosphinates.
Copyright © 2024 The Authors. Published by Elsevier Inc. All rights reserved.
Conflict of interest statement
Conflict of interests The authors declare that they have no conflicts of interest with the contents of this article.
Figures


Similar articles
-
Enzymatic Synthesis of Biologically Active H-Phosphinic Analogue of α-Ketoglutarate.Biomolecules. 2024 Dec 10;14(12):1574. doi: 10.3390/biom14121574. Biomolecules. 2024. PMID: 39766281 Free PMC article.
-
Enzymatic kinetic resolution of desmethylphosphinothricin indicates that phosphinic group is a bioisostere of carboxyl group.Commun Chem. 2020 Sep 2;3(1):121. doi: 10.1038/s42004-020-00368-z. Commun Chem. 2020. PMID: 36703359 Free PMC article.
-
A Desmethylphosphinothricin Dipeptide Derivative Effectively Inhibits Escherichia coli and Bacillus subtilis Growth.Biomolecules. 2023 Sep 26;13(10):1451. doi: 10.3390/biom13101451. Biomolecules. 2023. PMID: 37892133 Free PMC article.
-
Role of glutamate metabolism in bacterial responses towards acid and other stresses.J Appl Microbiol. 2013 Jan;114(1):11-24. doi: 10.1111/j.1365-2672.2012.05434.x. Epub 2012 Sep 27. J Appl Microbiol. 2013. PMID: 22924898 Review.
-
Newer aspects of glutamine/glutamate metabolism: the role of acute pH changes.Am J Physiol. 1999 Oct;277(4):F493-7. doi: 10.1152/ajprenal.1999.277.4.F493. Am J Physiol. 1999. PMID: 10516271 Review.
Cited by
-
Enzymatic Synthesis of Biologically Active H-Phosphinic Analogue of α-Ketoglutarate.Biomolecules. 2024 Dec 10;14(12):1574. doi: 10.3390/biom14121574. Biomolecules. 2024. PMID: 39766281 Free PMC article.
References
-
- Peck S.C., Gao J., Van Der Donk W.A. Discovery and biosynthesis of phosphonate and phosphinate natural products. Methods Enzymol. 2012;516:101–123. - PubMed
-
- Abdou M.M., O’Neill P.M., Amigues E., Matziari M. Phosphinic acids: current status and potential for drug discovery. Drug Discov. Today. 2019;24:916–929. - PubMed
-
- Bayer von E., Gugel K.H., Hagele K., Hagenmaier H., Jessipow S., Zahner W.A. Stoffwechselprodukte von Mikroorganismen 98. Mitteilung. Phosphinothricin Phosphinothricyl-alanyl-alanin. Helv. Chim. Acta. 1972;55:224–239. - PubMed
Publication types
MeSH terms
Substances
Grants and funding
LinkOut - more resources
Full Text Sources
Molecular Biology Databases
Research Materials
