. 2024 Sep 23;12(1):179.
doi: 10.1186/s40168-024-01898-7.

Dietary fibers boost gut microbiota-produced B vitamin pool and alter host immune landscape

Affiliations

Dietary fibers boost gut microbiota-produced B vitamin pool and alter host immune landscape

Erica T Grant et al. Microbiome. .

Abstract

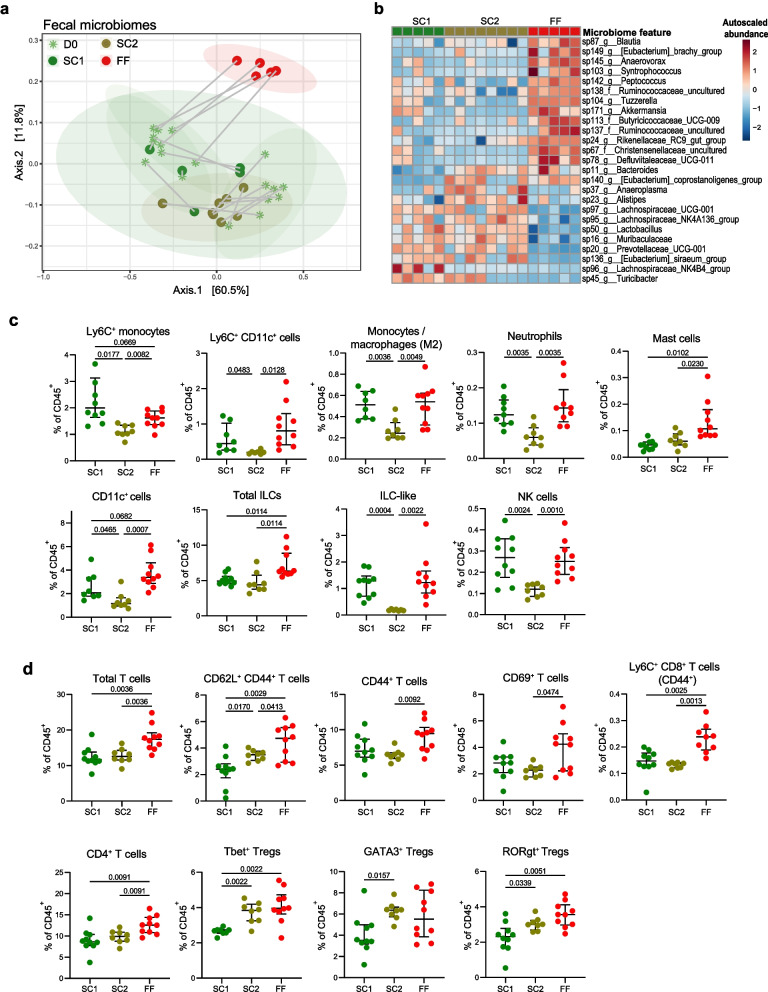
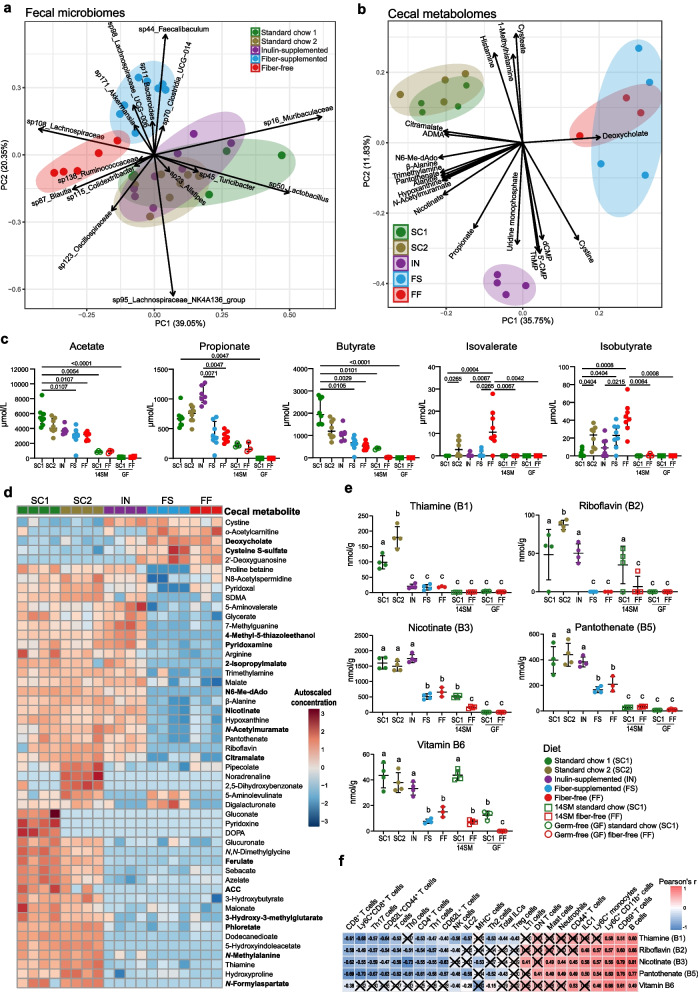
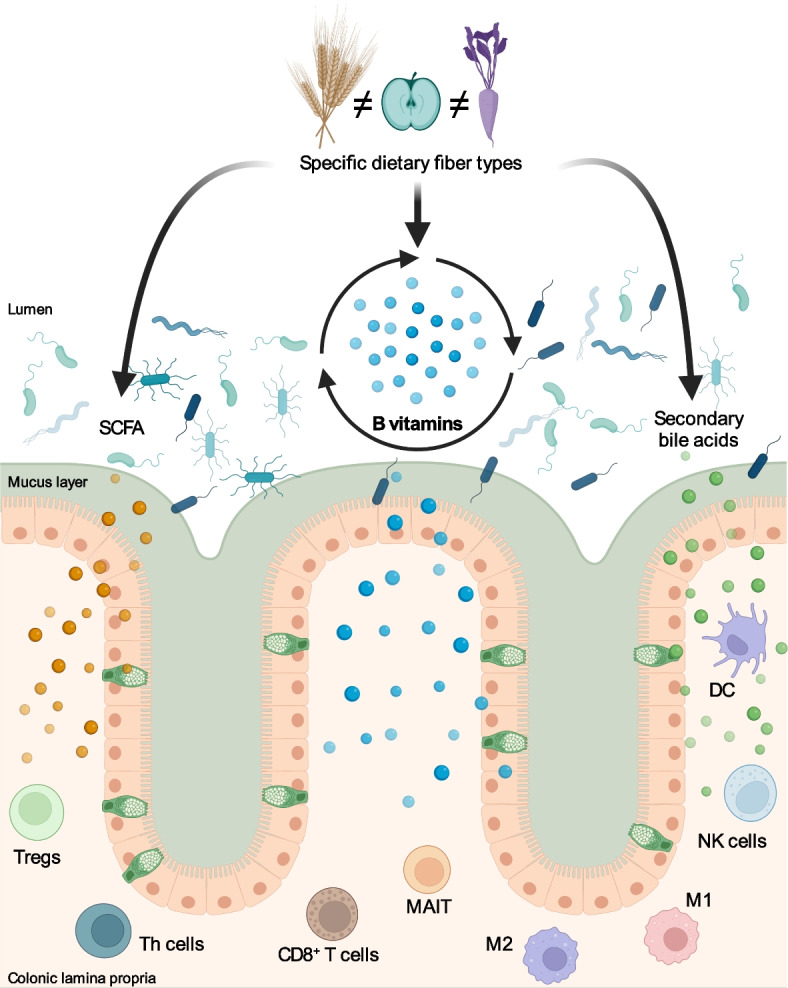
Background: Dietary fibers can alter microbial metabolic output in support of healthy immune function; however, the impact of distinct fiber sources and immunomodulatory effects beyond short-chain fatty acid production are underexplored. In an effort to discern the effects of diverse fibers on host immunity, we employed five distinct rodent diets with varying fiber content and source in specific-pathogen-free, gnotobiotic (containing a 14-member synthetic human gut microbiota), and germ-free mice.

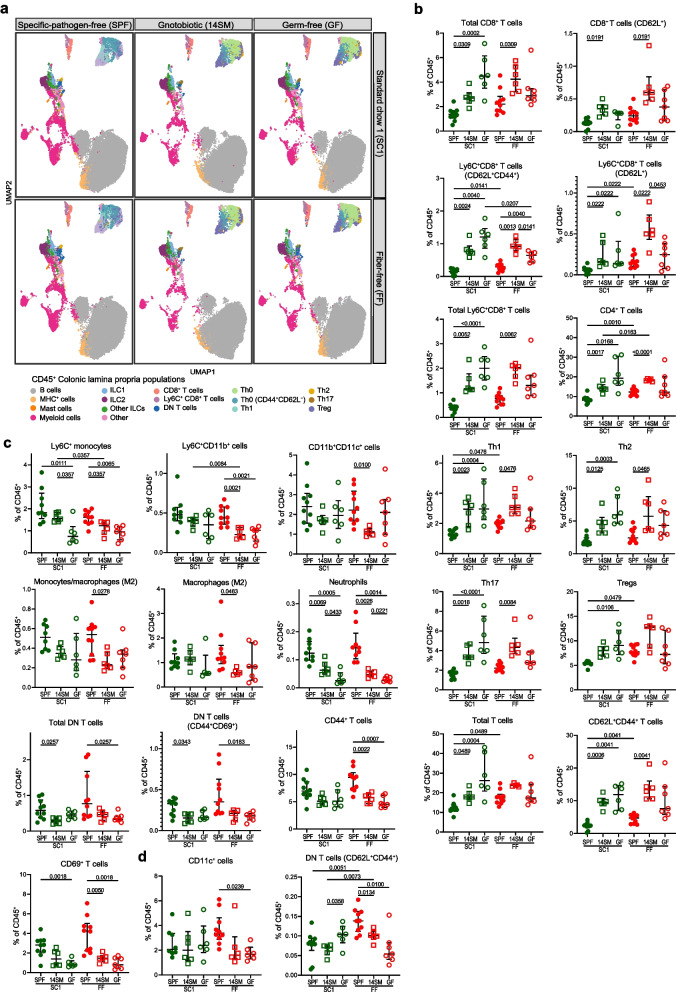
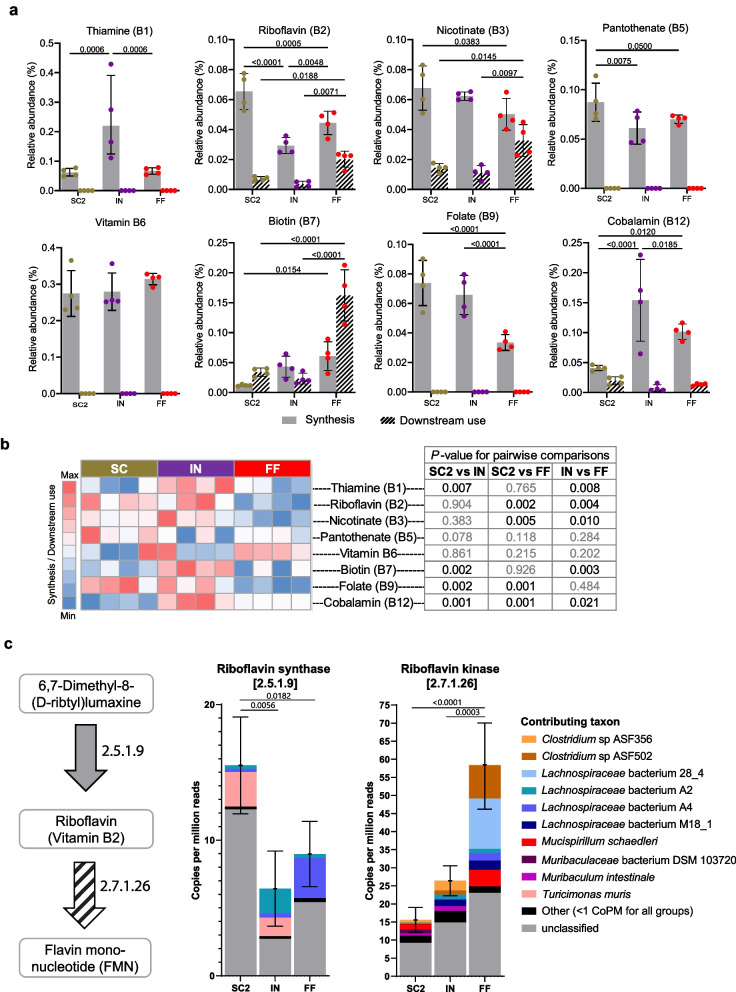
Results: Broad-scale metabolomics analysis of cecal contents revealed that fiber deprivation consistently reduced the concentrations of microbiota-produced B vitamins. This phenomenon was not always explained by reduced biosynthesis, rather, metatranscriptomic analyses pointed toward increased microbial usage of certain B vitamins under fiber-free conditions, ultimately resulting in a net reduction of host-available B vitamins. Broad immunophenotyping indicated that the local gut effector immune populations and activated T cells accumulate in a microbiota-dependent manner. Supplementation with the prebiotic inulin recovered the availability of microbially produced B vitamins and restored immune homeostasis.

Conclusions: Our findings highlight the potential to use defined fiber polysaccharides to boost microbiota-derived B vitamin availability in an animal model and to regulate local innate and adaptive immune populations of the host. Video abstract.

Keywords: B vitamins; Dietary fiber; Mass cytometry; Microbiome.


Conflict of interest statement

M.S.D. works as a consultant and an advisory board member at Theralution GmbH, Germany. S.F. is a founder and CEO of Metagen, Inc., Japan, focused on the design and control of the gut environment for human health.

Figures

Fig. 1
Fig. 1
Colonization state exerts stronger impact on immune profiles than diet in CyTOF analysis. a UMAP projections of the cLP populations in SC1 and FF-fed mice, faceted by colonization state (specific-pathogen-free, SPF; 14-member synthetic microbiota, 14SM; germfree, GF). Plots were generated from 100 clusters with populations manually annotated and merged. Dot plots show immune clusters of the colonic lamina propria (cLP) with proportions among SC1 (green) and FF (red) groups for the three colonization states with either b negative or c positive association between microbial colonization and population abundance as % of total CD45+ cells. d Variance dominated by interaction between diet and colonization state. CD4+ populations were manually gated in FlowJo. Brown–Forsythe and Welch ANOVA or Kruskal–Wallis test with P values adjusted using the Benjamini–Hochberg method. n = 6–10 mice per group (SPF: two batches of five mice each; 14SM: two batches of three mice each; GF: two batches of two to four mice each). Outliers were removed based on ROUT (Q = 1%): Tregs SPF SC1 n = 1; CD11c+ cells SPF SC1 n = 2 and GF FF n = 1; CD11b+CD11c+ cells 14SM FF n = 1; Macrophages (M2) SPF SC1 n = 1 and 14SM FF n = 1; monocytes/macrophages (M2) SPF SC1 n = 2; neutrophils SPF SC1 n = 1 and SPF FF n = 1. Specific-pathogen-free (SPF) = closed circles, gnotobiotic (14SM) = open squares, germ-free (GF) = open circles
Fig. 2
Fig. 2
Fiber deprivation shifts microbiome composition and local immunity in mice with complex microbiome. a Principal coordinates of analysis (PCoA) based on Bray–Curtis dissimilarity index from fecal microbiota of SPF mice at day 0 (D0, stars, light green), when all mice were fed standard chow 1 (SC1), and after feeding for 40 days (D40, dots) on either SC1, standard chow 2 (SC2), or fiber-free (FF) diet (green, brown, and red, respectively). Ellipses show 95% confidence interval (CI). b Heatmap of top 25 differentially abundant taxa in mice fed SC1, SC2, or FF diets according to a linear mixed-effect model with the FF group as reference. Microbiome feature abundances were normalized by total sum scaling and log-transformed, then auto-scaled for each taxa by mean-centering and dividing by standard deviation. Feature order is based on Ward clustering; sample order is fixed by group. For a and b, n = 5 (SC1 and FF) or 8 (SC2) mice per group. Adaptive and innate immune clusters of the cLP, represented as % of total CD45+ cells, showing significantly different proportions among c innate and d adaptive populations. CD4+ T cell populations were manually gated in FlowJo. Outliers were removed based on ROUT (Q = 1%): Tbet+ Tregs SC1 n = 2; Ly6C+ Monocytes SC1 n = 1; Ly6C+ CD11c+ cells SC1 n = 2 and SC2 n = 1; M2 Mono/Macro SC1 n = 2. Statistical testing was performed using Brown–Forsythe and Welch ANOVA or Kruskal–Wallis test with P values adjusted using the Benjamini–Hochberg method. For cd, n = 10 (SC1 and FF; two batches of five mice each) or 8 (SC2; four batches of four mice each) mice per group. Only populations with significant differences between the diets are shown; see Supplementary Table 3 for a complete list of populations analyzed
Fig. 3
Fig. 3
Fiber-supplemented diets differentially alter gut microbial and immune profiles in mice with complex microbiome. a Principal coordinates of analysis (PCoA) based on Bray–Curtis dissimilarity index from fecal microbiota of SPF mice at day 0 (D0, stars, light green) on standard chow and after feeding on an inulin-supplemented (IN), crude raw fiber-supplemented (FS), or fiber-free (FF) diet for 40 days (D40, dots, purple, blue, and red, respectively). Ellipses show 95% confidence interval (CI). b Heatmap of top 25 differentially abundant taxa in mice fed IN, FS, or FF diets according to a linear mixed-effect model with the FF group as reference. Microbiome feature abundances were normalized by total sum scaling and log-transformed, then auto-scaled for each taxa by mean-centering and dividing by standard deviation. Feature order is based on Ward clustering; sample order is fixed by group. For a and b, n = 5 (FF; one batch) or 8 (IN and FS; two batches of four mice) mice per group. Adaptive and innate immune clusters of the cLP, represented as % of total CD45+ cells, showing significantly different proportions among c innate or d adaptive immune populations (FF data same as in Fig. 1). CD4+ T cell were manually gated in FlowJo. No outliers were detected based on ROUT (Q = 1%). Statistical testing was performed using Brown–Forsythe and Welch ANOVA or Kruskal–Wallis test with P values adjusted using the Benjamini–Hochberg method. For cd, n = 8 (IN: two batches of four mice each), 7–9 (FS: two batches of two to four mice, two samples that were excluded from cluster gating due to low cell count were included in the manual gating after confirming proportions not biased by low cell count), or 10 (FF: two batches of five mice) mice per group. Only populations with significant differences between the diets are shown; see Supplementary Table 3 for a complete list of populations analyzed
Fig. 4
Fig. 4
Inulin supplementation shifts microbiome and cecal metabolite profiles to resemble standard chow-fed mice. a PCA based on Bray–Curtis dissimilarity of the SPF fecal microbiome composition was generated for the five diet groups using samples from day 0 (all mice on SC1) and after 40 days of feeding on their respective diets (D40). Plot is scaled and centered with top 15 loadings are displayed. Ellipses represent 95% CI. n = 5–8 mice per group. b PCA of SPF cecal metabolomes for the five diet groups quantified by capillary electrophoresis time-of-flight mass spectrometry (CE-TOFMS), with loadings overlain for the top 20 metabolites contributing to PC1 and PC2. c SCFA and BCFA concentrations from cecal contents as quantified by GC–MS, adjusted by the initial sample weight of sample. One-way ANOVA with P values adjusted using the Benjamini–Hochberg method. Standard chow 1 (SC1) = green, standard chow 2 (SC2) = brown, inulin-supplemented (IN) = purple, fiber-supplemented (FS) = blue, fiber-free (FF) = red. d Heatmap of top 50 differentially abundant cecal metabolites in mice fed SC1, SC2, IN, FS, or FF diets according to a linear mixed-effect model with the FF group as reference. Metabolite concentrations were normalized to the cecal weight and log-transformed, then auto-scaled for each metabolite by mean-centering and dividing by standard deviation. Metabolite order is based on Ward clustering; sample order is fixed by group. Metabolites in bold were absent in germ-free samples. ACC, 1-aminocyclopropane-1-carboxylate; DOPA, 3,4-dihydroxyphenylalanine; N6-Me-dAdo, N6-methyl-2′-deoxyadenosine; SDMA, symmetric dimethylarginine; 3-HMG, 3-hydroxy-3-methylglutarate. e Concentrations of detected B vitamins (mean ± SD). Vitamin B6 includes pyridoxine, pyridoxal, pyridoxamine, and their phosphorylated derivatives. One-way ANOVA with adjusted P values calculated using the Benjamini–Hochberg method. Different letters denote statistically significant differences (adjusted P < 0.01). n = 4 mice per group (exception: one outlier removed from FF group based on PCA). f Correlation matrix between log-transformed cecal B vitamin concentrations and immune cell frequencies as a percent of CD45+ cells. Correlations that were not statistically significant (adjusted P ≥ 0.05) are indicated with an ex (×) over the Pearson correlation coefficient in each square. Data for correlations were derived from matched values (i.e., from the same mouse) for 14SM, GF, and SPF mice. Matched values were not available for SPF SC1, FS, and FF mice; therefore, the data was pooled for each of these groups
Fig. 5
Fig. 5
B vitamin synthesis and utilization dynamics are disrupted in fiber-deprived conditions. a Relative abundance (%) of cecal transcripts mapping to non-host genes involved in B vitamin synthesis or downstream utilization. One-way ANOVA with adjusted P values calculated using the Benjamini–Hochberg method. b Log2-adjusted ratio of all upstream synthesis over downstream utilization transcripts (S/D) for B vitamins in cecal metatranscriptomes for mice fed a standard chow (SC2), an inulin supplemented diet (IN), or a fiber-free (FF) diet. Pseudocounts (plus one to all values) were used when downstream values were 0 (e.g., thiamine, pantothenate, vitamin B6, and folate) to permit the calculation of log2-adjusted ratios. Color intensity is relative to min and max within each row, with the midpoint at the median value. Unpaired t test, non-significant (p > 0.05) values in gray. c Bacterial contributors for enzymes immediately up- or downstream of riboflavin (vitamin B2), based on the KEGG riboflavin metabolism reference pathway [79]. n = 4 mice per group, mean ± SD
Fig. 6
Fig. 6
Summary of diet–microbiome–immune interactions in the colon. Dietary fibers of diverse plant origins are metabolized by the gut microbiome to produce short-chain fatty acids, which support Tregs. B vitamins are both synthesized and utilized by the gut microbiome and impact diverse immune cell subsets as reviewed by Gholami et al. [82]. Secondary bile acids are also produced by the microbiome and show variation by diet, with distinct immune impacts as reviewed by Fiorucci et al. [75]. Figure created with BioRender.com

References

    1. Ansaldo E, Farley TK, Belkaid Y. Control of immunity by the microbiota. Ann Rev Immunol. 2021;39:449–79. 10.1146/annurev-immunol-093019-112348. - PubMed
    1. Wolter M, Grant ET, Boudaud M, Steimle A, Pereira G V, Martens EC, et al. Leveraging diet to engineer the gut microbiome. Nat Rev Gastroenterol Hepatol. 2021;18:885–902. 10.1038/s41575-021-00512-7. - PubMed
    1. Gentile CL, Weir TL. The gut microbiota at the intersection of diet and human health. Science. 2018;362:776–80. 10.1126/science.aau5812. - PubMed
    1. Rothschild D, Weissbrod O, Barkan E, Kurilshikov A, Korem T, Zeevi D, et al. Environment dominates over host genetics in shaping human gut microbiota. Nature. 2018;555:210–215. 10.1038/nature25973. - PubMed
    1. Makki K, Deehan EC, Walter J, Bäckhed F. The impact of dietary fiber on gut microbiota in host health and disease. Cell Host Microbe. 2018;23:705–15. 10.1016/j.chom.2018.05.012. - PubMed

LinkOut - more resources