. 2024 Nov;11(43):e2310282.
doi: 10.1002/advs.202310282. Epub 2024 Sep 23.

Spatiotemporal Analysis of Mesenchymal Stem Cells Fate Determination by Inflammatory Niche Following Soft Tissue Injury at a Single-Cell Level

Affiliations

Spatiotemporal Analysis of Mesenchymal Stem Cells Fate Determination by Inflammatory Niche Following Soft Tissue Injury at a Single-Cell Level

Chen Kan et al. Adv Sci (Weinh). 2024 Nov.

Abstract

Heterotopic ossification (HO), often arising in response to traumatic challenges, results from the aberrant osteochondral differentiation of mesenchymal stem cells (MSCs). Nevertheless, the impact of trauma-induced inflammatory exposure on MSC fate determination remains ambiguous. In this study, the cellular diversity within inflammatory lesions is elucidated, comprising MSCs and several innate and adaptive immune cells. It is observed that quiescent MSCs transition into cycling MSCs, subsequently giving rise to chondrogenic (cMSC) and/or osteogenic (oMSC) lineages within the inflammatory microenvironment following muscle or tendon injuries, as revealed through single-cell RNA sequencing (scRNA-seq), spatial transcriptome and lineage tracing analysis. Moreover, these investigations demonstrate that neutrophils and natural killer (NK) cells enhance transition of quiescent MSCs into cycling MSCs, which is also controlled by M1 macrophages, a subpopulation of macrophages can also stimulate cMSC and oMSC production from cycling MSCs. Additionally, M2 macrophages, CD4+ and CD8+ T lymphocytes are found to promote chondrogenesis. Further analysis demonstrates that immune cells promotes the activation of signaling transducers and activators of transcription (STAT) pathway and phosphoinositide 3 (PI3K)/protein kinase B (AKT) pathway in MSC proliferation and osteochondral progenitors' production, respectively. These findings highlight the dynamics of MSC fate within the inflammatory lesion and unveil the molecular landscape of osteoimmunological interactions, which holds promise for advancing HO treatment.

Keywords: heterotopic ossification; inflammatory microenvironment; mesenchymal stem cells; osteoimmunology.


Conflict of interest statement

The authors declare no conflict of interest.

Figures
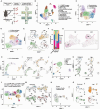
Figure 1
Figure 1
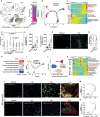
scRNA‐seq analysis of the cell types in the injured sites of tibial muscle from HO model mice. A) Schematic of the study design, highlighting the systematic process of target tissue collection at specified time intervals for scRNA‐seq analysis. B) UMAP visualization of 50 466 cells derived from injured tibial muscle of Nse‐Bmp4 mice. C) UMAP visualization of MSC linage cells in injured tibial muscle of Nse‐Bmp4 mice. D) UMAP visualization of macrophages and monocytes derived from injured tibial muscle of Nse‐Bmp4 mice. E) UMAP visualization and F) percentage of macrophages and monocytes in uninjured and injured tibial muscle of Nse‐Bmp4 mice at different time point. G) The feature plot images of classical molecules for M1 and M2 macrophages in uninjured and injured tibial muscle of Nse‐Bmp4 mice covering 4 time points. H,I) UMAP visualization of neutrophils derived from tibial muscle of H) Nse‐Bmp4 mice covering 4 time points and I) different time points with or without injury. UMAP visualization of DCs derived from tibial muscle of J) Nse‐Bmp4 mice covering 4 time points and K) different time points post injury. L,M) UMAP visualization of NK & T cells derived from tibial muscle of L) Nse‐Bmp4 mice covering 4 time points and M) different time points post injury. UMAP visualization of B cells derived from N) tibial muscle of Nse‐Bmp4 mice covering 4 time points and O) different time points post injury.
Figure 2
Figure 2
Quiescent MSC enters the cycling stage and differentiates into two lineage cells with osteogenic and chondrogenic capacity after tibial muscle injury. A) UMAP visualization and percentage of MSC linage cells in uninjured and injured tibial muscle of Nse‐Bmp4 mice at different time points. B) Pseudotemporal trajectories of the quiescent MSCs (cluster 5 mesenchymal lineage cells) and cycling MSCs (cluster 4 mesenchymal lineage cells) in injured tibial muscle of Nse‐Bmp4 mice using Monocle 2 analysis. C) Heatmap showing relative expressions of four modules genes in quiescent and cycling MSCs along inferred trajectories. D) AddModuleScore analysis of the cell cycle of each type of mesenchymal lineage cells. E) Statistical analysis of the number of total MSCs and MSCs at G2/M phase in uninjured and injured tibial muscle at indicated time points post injury. (n = 5 per group). Data are presented as mean ± SD of biological replicates. ** p < 0.01, *** p < 0.001, **** p < 0.0001. F,G) Representative immunofluorescence staining images of F) CldU and G) statistical analysis of Tie2+/CldU+ cells in uninjured and injured tibial muscle at 1 dpi from Tie2‐Cre; RosamTmG ; Nse‐Bmp4 mice. (n = 5 per group). Data are presented as mean ± SD of biological replicates. **** p < 0.0001. Scale bar, 200 µm. H) GSVA analysis of the capacity of trilineage differentiation of cycling MSCs (cluster 4), cMSC (cluster 3) and oMSC (cluster 6). I) Pseudotemporal trajectories of the cycling MSCs (cluster 4), cMSCs (cluster 3) and oMSCs (cluster 6) in injured tibial muscle of Nse‐Bmp4 mice using Monocle 2 analysis. J) Pseudotime trajectory analysis of cycling MSC, cMSC and oMSC using diffusion map. K) Heatmap showing relative expressions of four modules genes in cycling MSCs, cMSCs and oMSCs along inferred trajectories. L,M) Representative immunofluorescence staining images of L) Tie2 and SOX9 and statistical analysis of M) Tie2+/SOX9+ cells in uninjured and injured tibial muscle from Nse‐Bmp4 mice. (n = 5 per group). Data are presented as mean ± SD of biological replicates. ** p < 0.01, N. S. indicated no significance. Scale bar, 200 µm. N,O) Representative immunofluorescence staining images of N) Tie2 and RUNX2 and O) statistical analysis of Tie2+/RUNX2+ cells in uninjured and injured tibial muscle from Nse‐Bmp4 mice. (n = 5 per group). Data are presented as mean ± SD of biological replicates. ** p < 0.01, N. S. indicated no significance. Scale bar, 200 µm.
Figure 3
Figure 3
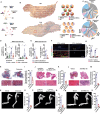
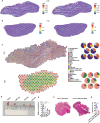
Interaction of MSC with immune cells in the inflammatory niche of injured tibial muscle of Nse‐Bmp4 mice. A) Signaling role of MSCs and immune cells in tibial muscle of Nse‐Bmp4 mice covering 4 time points. B) Heatmap displaying differential interactions between immune cells and MSCs at three indicated time points: Day 1 versus Uninjured, Day 3 versus Day 1, and Day 7 versus Day 3. C) HE staining images of uninjured and injured tibial muscles for spatial transcriptome sequencing. D) Mapping of 12 types of cluster cells across tissue regions. E–M) Using AddModule analysis for mapping the cell types generated from single‐cell RNA sequencing to spatial transcriptomics, including E) quiescent MSCs, F) cycling MSCs, G) cMSCs, H) oMSCs, I) DCs, J) NK&T cells, K) macrophages & monocytes, L) neutrophils and M) B cells. N) RCTD analysis of the distribution of each type of cells across the tissue regions at different time points. O) Stlearn analysis of the interaction between two spots across the tissue regions at different time points.
Figure 4
Figure 4
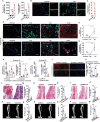
Macrophages promote transition of quiescent MSCs into cycling MSCs and aberrant osteochondral differentiation of cycling MSCs. A) The interaction number for M1 and M2 macrophages (source) and each subtype of MSCs (recipients). B) RCTD analysis for the interaction among M1 macrophages and MSCs at 1 dpi and M2 macrophages and MSCs at 3 dpi. C) Interaction analysis for M1 macrophages and MSCs at 1 dpi and M2 macrophages and MSCs at 3 dpi. D) Statistical analysis of total MSCs and MSCs at G2/M phase in injured tibial muscle of Nse‐Bmp4 mice with vehicle or clodronate liposome treatment at 1 dpi. (n = 5 per group). Data are presented as mean ± SD of biological replicates. * p < 0.05, ** p < 0.01. E) Statistical analysis of the number of total MSCs and MSCs at G2/M phase in injured tibial muscle of LysM‐Cre; Nse‐Bmp4 and LysM‐Cre; iDTR; Nse‐Bmp4 mice with DT treatment at 1 dpi. (n = 4 per group). Data are presented as mean ± SD of biological replicates. * p < 0.05. F) Representative immunofluorescence staining images and G) statistical analysis of the area of RUNX2+ and SOX9+ in the injured tibial muscle of Nse‐Bmp4 mice with vehicle or clodronate treatment. (n = 5 per group). Data are presented as mean ± SD of biological replicates. **** p < 0.0001. Scale bar, 50 µm. H) Representative images and I) statistical analysis of safranine O+ area in injured tibial muscle of Nse‐Bmp4 mice with vehicle or clodronate liposome treatment. (n = 5 per group). Data are presented as mean ± SD of biological replicates. *** p < 0.001. Scale bar, 50 µm. J) Representative images and K) statistical analysis of safranine O+ area in injured tibial muscle of LysM‐Cre; Nse‐Bmp4 and LysM‐Cre; iDTR; Nse‐Bmp4 mice with DT treatment. (n = 5 per group). Data are presented as mean ± SD of biological replicates. **** p < 0.0001. Scale bar, 50 µm. L) Representative images and M) statistical analysis of safranine O+ area in injured muscle of Nse‐Bmp4 mice with vehicle or anti‐MRC1 antibody treatment. (n = 5 per group). Data are presented as mean ± SD of biological replicates. **** p < 0.0001. Scale bar, 50 µm. N) Representative microCT images and O) statistical analysis of HO volume in injured tibial muscle of Nse‐Bmp4 mice with vehicle or clodronate treatment from 7 to 14 dpi. (n = 5 per group). Data are presented as mean ± SD of biological replicates. * p < 0.05, ** p < 0.01, **** p < 0.0001, N. S. indicated no significance. P) Representative microCT images and Q) statistical analysis of HO volume in injured tibial muscle of LysM‐Cre; Nse‐Bmp4 and LysM‐Cre; iDTR; Nse‐Bmp4 mice with DT treatment. (n = 5 per group). Data are presented as mean ± SD of biological replicates. *** p < 0.001. R) Representative microCT images and S) statistical analysis of HO volume in injured tibial muscle of Nse‐Bmp4 mice with either vehicle or anti‐MRC1 antibody treatment (n = 5 per group). Data are presented as mean ± SD of biological replicates. **** p < 0.0001.
Figure 5
Figure 5
Neutrophils and NK cells potentiates the proliferation of MSC in injured tibial muscle of Nse‐Bmp4 mice. A) The differential interaction number and strength between neutrophils and MSCs at 1 dpi compared to uninjured group, or at 3 dpi compared to 1 dpi. B) RCTD analysis of the interaction between neutrophils and each subtype of MSCs. C) Statistical analysis of the number of total MSCs and MSCs at G2/M phase in injured tibial muscle of Nse‐Bmp4 mice with either vehicle or Ly6G antibody treatment at 1 dpi (n = 4 per group). Data are presented as mean ± SD of biological replicates. ** p < 0.01, *** p < 0.001, **** p < 0.0001. D) Statistical analysis of number of total MSCs and MSCs at G2/M phase in injured tibial muscle of Ly6G‐Cre; Nse‐Bmp4 and Ly6G‐Cre; iDTR; Nse‐Bmp4 mice with DT treatment. (n = 6 per group). Data are presented as mean ± SD of biological replicates. * p < 0.05, ** p < 0.01. E,F) The differential interaction number and strength of NK or T cells with MSCs at 1 dpi compared to uninjured group, or at 3 dpi compared to 1 dpi. G) RCTD analysis of the interaction of NK or T cells with each subtype of MSCs. H) Statistical analysis of the number of total MSCs and MSCs at G2/M phase in injured tibial muscle of Nse‐Bmp4 mice with either vehicle or GM1 antibody treatment at indicated time points after injury. (n = 4 per group). Data are presented as mean ± SD of biological replicates. * p < 0.05, ** p < 0.01, *** p < 0.0001. I) Statistical analysis of number of total MSCs and MSCs at G2/M phase in injured tibial muscle of Ncr1‐Cre; Nse‐Bmp4 and Ncr1‐Cre; iDTR; Nse‐Bmp4 mice with DT treatment. (n = 5 per group). Data are presented as mean ± SD of biological replicates. ** p < 0.01, *** p < 0.001, **** p < 0.0001.
Figure 6
Figure 6
CD4+ and/or CD8+ T cells promote chondrogenic differentiation of cMSCs. A,B) AddModuleScore analysis of A) Cd4 and Cd8 at 3 and B) 7 dpi using spatial transcriptome analysis. C) RCTD analysis of CD4+ and CD8+ T cells at 3 and 7 dpi using spatial transcriptome analysis. D) Representative images and E) statistical analysis of the chondroid weight after either Ly6G mAb, CD4 mAb or CD8 mAb treatment. (n = 4 or 5 per group). Data are presented as means ± SD of biological replicates. ** p < 0.01, *** p < 0.001. F) Representative safranine O staining images and G) statistical analysis of the injured tibial muscle of LckCre; NseBmp4 mice and Lck‐Cre; iDTbR; NseBmp4 mice (n = 5 per group). Data are presented as means ± SD of biological replicates. **** p < 0.0001. Scale bar, 200 µm.
Figure 7
Figure 7
Macrophages promotes MSC proliferation and osteochondral differentiation in tendon. A) Statistical analysis of the number of total MSCs and MSCs at G2/M phase in injured tendon at indicated time points after injury. (n = 5 per group). Data are presented as mean ± SD of biological replicates. * p < 0.05, ** p < 0.01, N. S. indicated no significance. Representative immunofluorescence staining images of B) Tie2 and CldU and C) statistical analysis of Tie2+/CldU+ cells in uninjured and injured tendon at 3 dpi from Nse‐Bmp4 mice. (n = 5 per group). Data are presented as mean ± SD of biological replicates. ** p < 0.01. Scale bar, 200 µm. Representative IF staining images of D) Tie2, SOX9, and Col2a and statistical analysis of E) Tie2+/SOX9+ cells in uninjured and injured tendon from WT mice. (n = 5 per group). Data are presented as mean ± SD of biological replicates. * p < 0.05, N. S. indicated no significance. Scale bar, 200 µm. Representative IF staining images of F) Tie2, RUNX2 and BSP and G) statistical analysis of Tie2+/RUNX2+ cells in uninjured and injured tendon from WT mice. (n = 5 per group). Data are presented as mean ± SD of biological replicates. ** p < 0.01, N. S. indicated no significance (unpaired two‐tailed t‐test). Scale bar, 200 µm. H) Statistical analysis of the number of total MSCs and MSCs at G2/M phase in injured tendon of WT mice with either vehicle or clodronate liposome treatment at 3 dpi. (n = 5 per group). Data are presented as mean ± SD of biological replicates. ** p < 0.01, **** p < 0.0001. I) Statistical analysis of the number of total MSCs and MSCs at G2/M phase in injured tendon of LysM‐Cre and LysM‐Cre; iDTR mice with DT treatment at indicated time points after injury. (n = 4 per group). Data are presented as mean ± SD of biological replicates. * p < 0.05. Representative IF staining images of J) SOX9 and RUNX2 and K) statistical analysis of SOX9+ or RUNX2+ cells in injured tendon from WT mice with either vehicle or clodronate treatment. (n = 5 per group). Data are presented as mean ± SD of biological replicates. **** p < 0.0001. Scale bar, 200 µm. L) Representative images and M) statistical analysis of safranine O+ area in injured tendon of WT mice with either vehicle or clodronate treatment. (n = 5 per group). Data are presented as mean ± SD of biological replicates. **** p < 0.0001. Scale bar, 200 µm. N) Representative images and O) statistical analysis of safranine O+ area in injured tendon of LysM‐Cre and LysM‐Cre; iDTR mice with DT treatment. (n = 5 per group). Data are presented as mean ± SD of biological replicates. **** p < 0.0001. Scale bar, 200 µm. P) Representative images and Q) statistical analysis of HO volume in injured tendon of WT mice with either vehicle or clodronate treatment. (n = 5 per group). Data are presented as mean ± SD of biological replicates. **** p < 0.0001. Scale bar, 200 µm. R) Representative microCT images and S) statistical analysis of HO in injured tendon of LysM‐Cre and LysM‐Cre; iDTR mice. (n = 5 per group). Data are presented as mean ± SD of biological replicates. ** p < 0.01. T) Representative safranine O+ area and V) microCT images and U) statistical analysis of safranine O+ area and W) HO volume in injured tendon of WT mice with MRC1 antibody (n = 5 per group). Data are presented as mean ± SD of biological replicates. ** p < 0.01 **** p < 0.0001.
Figure 8
Figure 8
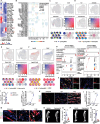
Molecular regulation of MSC by immune cells. A) Heatmap of the activity of the regulons of each subtype of MSCs. B) Molecular interaction pairs between immune cells (donors) and MSCs (recipients). C) Co‐expression pattern of Sell and Cd34 in the spatial section and the spatial feature plots of Sell and Cd34‐enriched NK/MSC expansion units at 1 dpi. D) Coexpression pattern of Tnf and Tnfrsf1b in the spatial section and the spatial feature plots of Tnf and Tnfrsf1b‐enriched NK/MSC expansion units at 1 dpi. E) Co‐expression pattern of Thbs1 and Cd47 in the spatial section and the spatial feature plots of Thbs1 and Cd47‐enriched NK/MSC expansion units at 1 dpi. F) Coexpression pattern of Lgals9 and Cd44 in the spatial section and the spatial feature plots of Lgals9 and Cd44‐enriched NK/MSC expansion units at 3 dpi. G) KEGG analysis of immune‐MSC interaction pairs. H) IF staining and I) statistical analysis of the PRX1+/CldU+ MSCs in injured tendon with or without JAK inhibitor (JAK1‐IN‐11) treatment. (n = 5 per group). Data are presented as mean ± SD of biological replicates. ** p < 0.01. Scale bar, 50 µm. J) IF staining and K) statistical analysis of the PRX1+/SOX9+/p‐AKT+ MSCs in injured tendon at different time points post injury. (n = 5 per group). Data are presented as mean ± SD of biological replicates. *** p < 0.001, **** p < 0.0001, Scale bar, 50 µm. M) IF staining and L) statistical analysis of the PRX1+/RUNX2+/p‐AKT+ MSCs in injured tendon at different time points post injury. (n = 5 per group). Data are presented as mean ± SD of biological replicates. *** p < 0.001, **** p < 0.0001, Scale bar, 20 µm. N) Representative microCT images and O) statistical analysis of muscle HO volume in Nse‐Bmp4 mice after Capivasertib treatment. (n = 5 per group). Data are presented as mean ± SD of biological replicates. *** p < 0.001. P) Representative microCT images and Q) statistical analysis of tendon HO volume after Capivasertib treatment. (n = 5 per group). Data are presented as mean ± SD of biological replicates. **** p < 0.0001.

References

    1. Shore E. M., Ahn J., de Beur S. J., Li M., Xu M., Gardner R. J. M., Zasloff M. A., Whyte M. P., Levine M. A., Kaplan F. S., N. Engl. J. Med. 2002, 346, 99. - PubMed
    1. Dey D., Wheatley B. M., Cholok D., Agarwal S., Yu P. B., Levi B., Davis T. A., Transl. Res. 2017, 186, 95. - PMC - PubMed
    1. Shore E. M., Kaplan F. S., Nat. Rev. Rheumatol. 2010, 6, 518. - PMC - PubMed
    1. Meyers C., Lisiecki J., Miller S., Levin A., Fayad L., Ding C., Sono T., McCarthy E., Levi B., James A. W., JBMR Plus 2019, 3, e10172. - PMC - PubMed
    1. Wong K. R., Mychasiuk R., O'Brien T. J., Shultz S. R., McDonald S. J., Brady R. D., Bone Res. 2020, 8, 42. - PMC - PubMed

LinkOut - more resources