. 2024 Dec 4;120(15):1869-1883.
doi: 10.1093/cvr/cvae163.

Hypoxia-responsive zinc finger E-box-binding homeobox 2 (ZEB2) regulates a network of calcium-handling genes in the injured heart

Affiliations

Hypoxia-responsive zinc finger E-box-binding homeobox 2 (ZEB2) regulates a network of calcium-handling genes in the injured heart

Monika M Gladka et al. Cardiovasc Res. .

Abstract

Aims: Intracellular calcium (Ca2+) overload is known to play a critical role in the development of cardiac dysfunction. Despite the remarkable improvement in managing the progression of heart disease, developing effective therapies for heart failure (HF) remains a challenge. A better understanding of molecular mechanisms that maintain proper Ca2+ levels and contractility in the injured heart could be of therapeutic value.

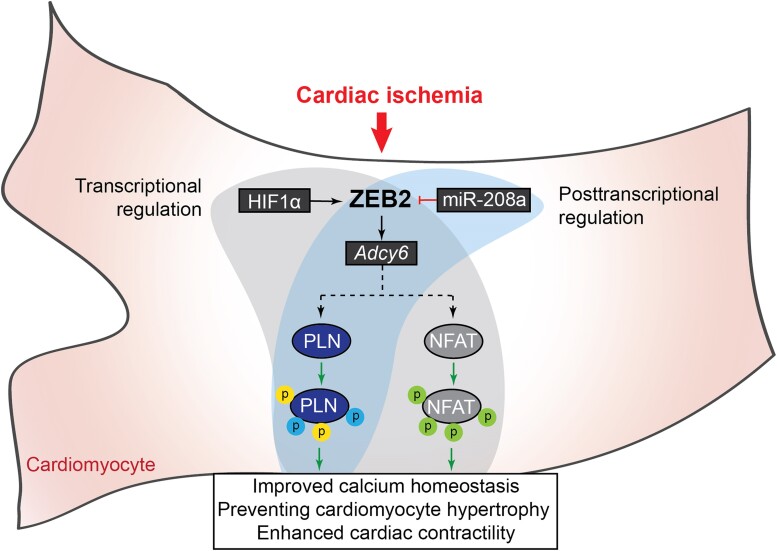
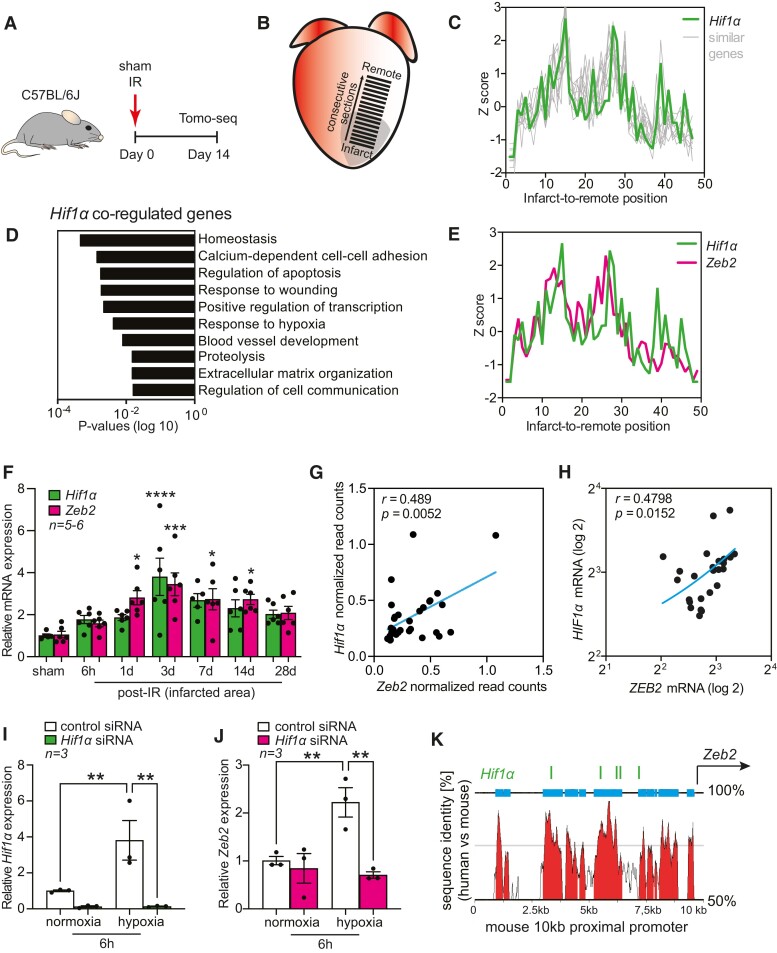
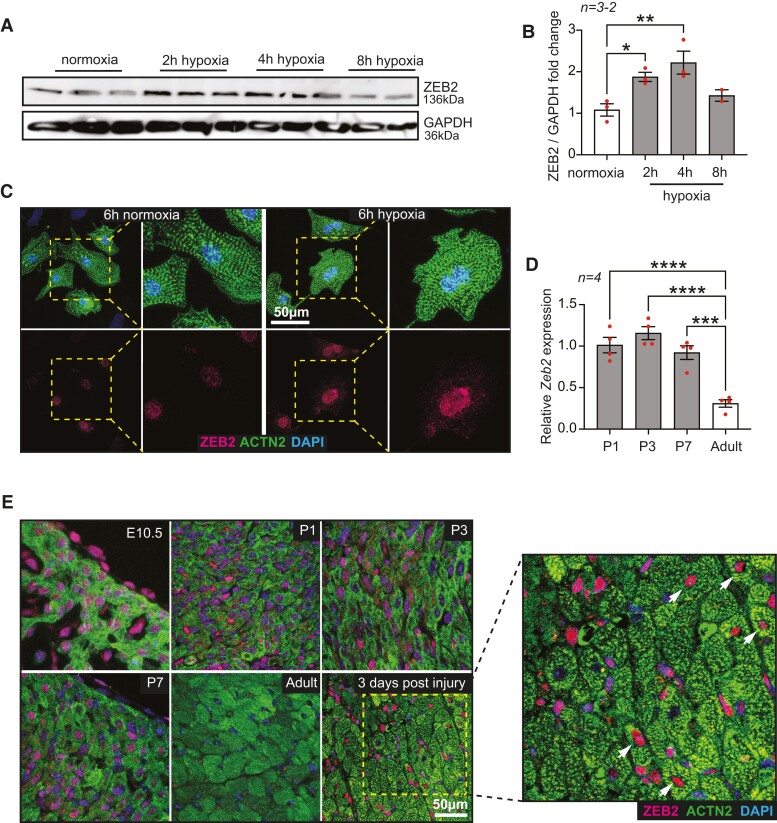
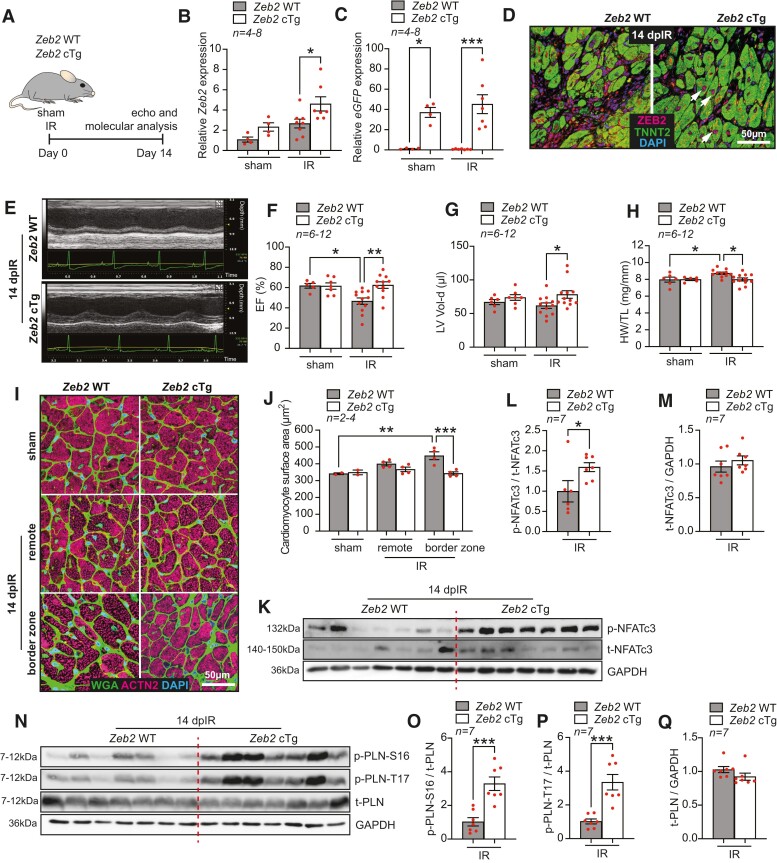
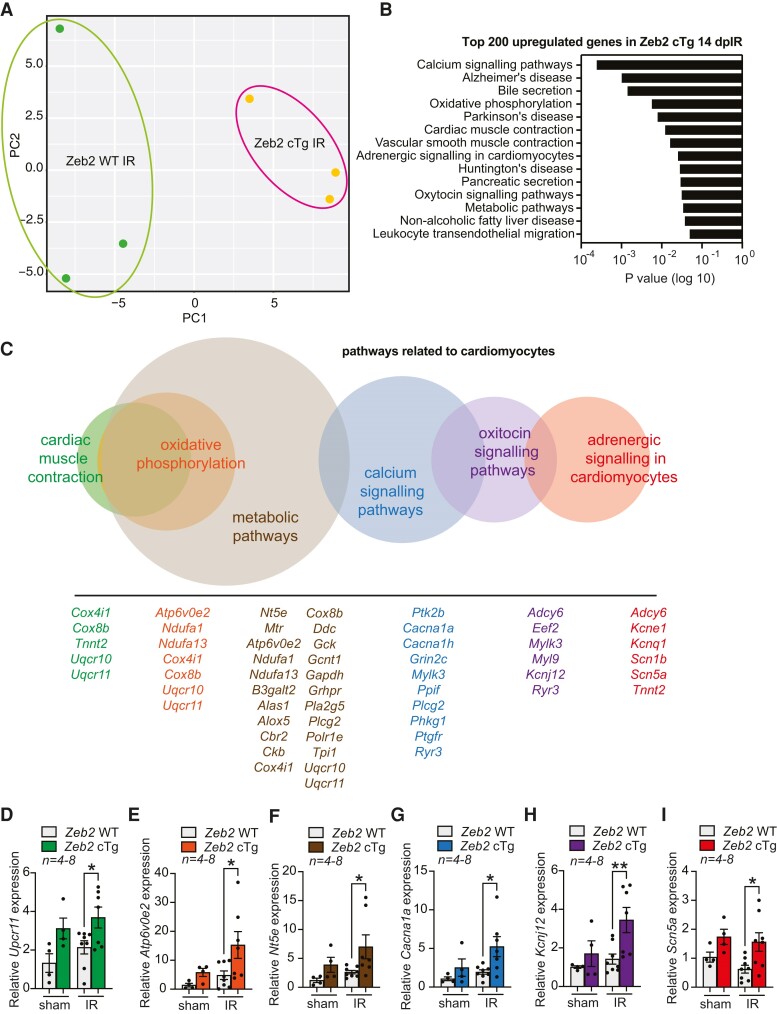
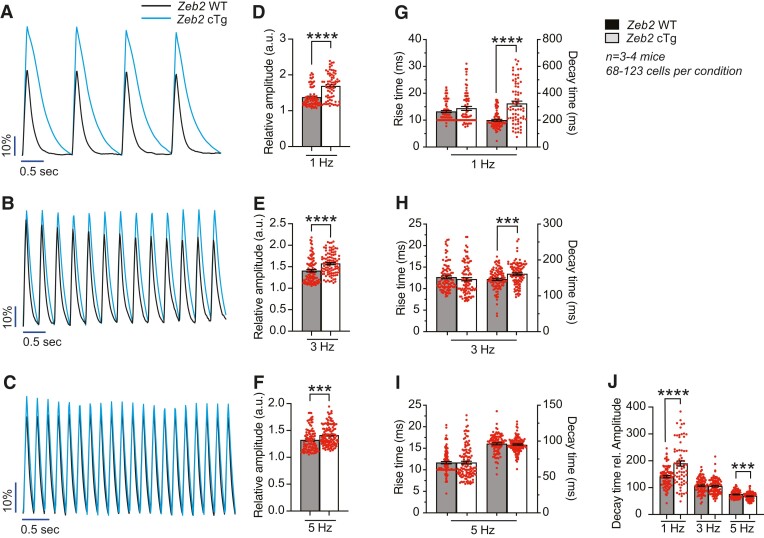
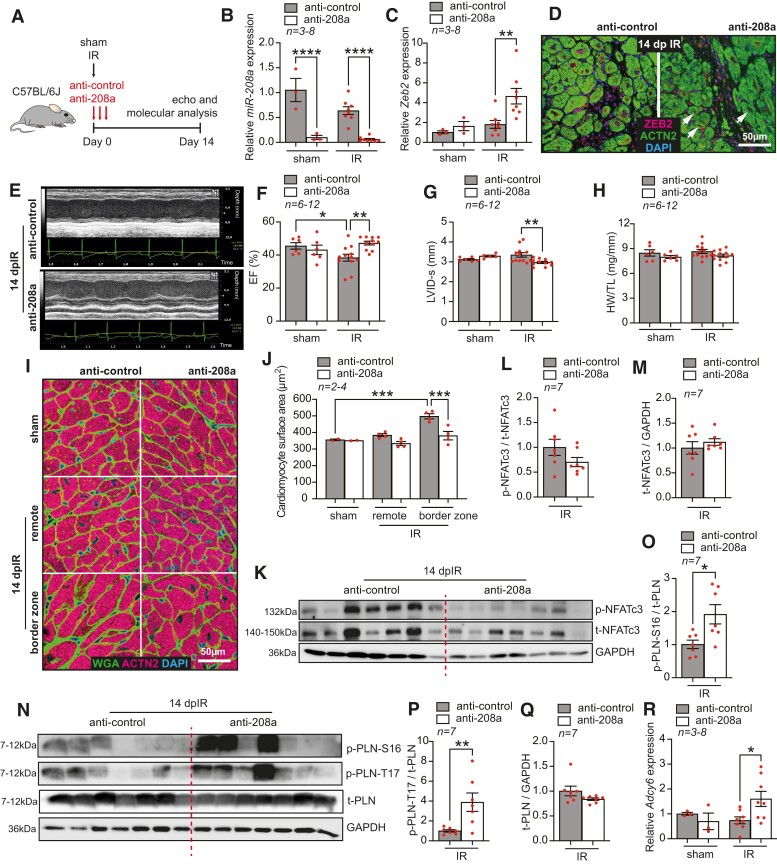
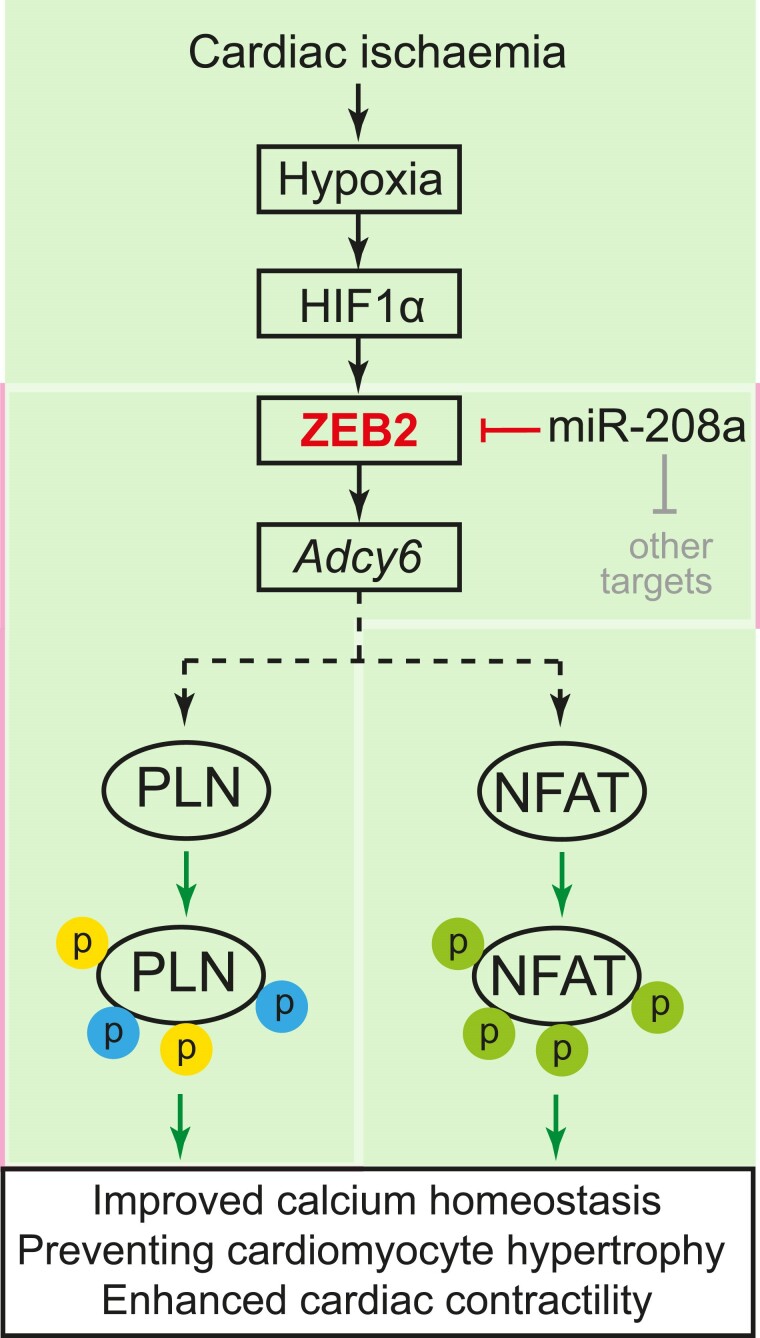
Methods and results: Here, we report that transcription factor zinc finger E-box-binding homeobox 2 (ZEB2) is induced by hypoxia-inducible factor 1-alpha (HIF1α) in hypoxic cardiomyocytes and regulates a network of genes involved in Ca2+ handling and contractility during ischaemic heart disease. Gain- and loss-of-function studies in genetic mouse models revealed that ZEB2 expression in cardiomyocytes is necessary and sufficient to protect the heart against ischaemia-induced diastolic dysfunction and structural remodelling. Moreover, RNA sequencing of ZEB2-overexpressing (Zeb2 cTg) hearts post-injury implicated ZEB2 in regulating numerous Ca2+-handling and contractility-related genes. Mechanistically, ZEB2 overexpression increased the phosphorylation of phospholamban at both serine-16 and threonine-17, implying enhanced activity of sarcoplasmic reticulum Ca2+-ATPase (SERCA2a), thereby augmenting SR Ca2+ uptake and contractility. Furthermore, we observed a decrease in the activity of Ca2+-dependent calcineurin/NFAT signalling in Zeb2 cTg hearts, which is the main driver of pathological cardiac remodelling. On a post-transcriptional level, we showed that ZEB2 expression can be regulated by the cardiomyocyte-specific microRNA-208a (miR-208a). Blocking the function of miR-208a with anti-miR-208a increased ZEB2 expression in the heart and effectively protected from the development of pathological cardiac hypertrophy.

Conclusion: Together, we present ZEB2 as a central regulator of contractility and Ca2+-handling components in the mammalian heart. Further mechanistic understanding of the role of ZEB2 in regulating Ca2+ homeostasis in cardiomyocytes is an essential step towards the development of improved therapies for HF.

Keywords: Calcium handling; Cardiac ischaemia; Hypoxia; MicroRNA; Post-transcriptional regulation; Transcriptional regulation.


Conflict of interest statement

Conflict of interest: none declared.

Figures

Graphical Abstract
Graphical Abstract
Figure 1
Figure 1
Zeb2 is induced by HIF1α in hypoxic cardiomyocytes. (A) Study design. (B) Tomo-seq on infarcted mouse heart. (C) Spatial expression traces of Hif1α and similarly regulated genes in mouse hearts 14 days post-injury. (D) Gene Ontology analysis showing enriched pathways of Hif1α co-regulated genes. (E) Spatial expression traces of Hif1α and Zeb2 in the infarcted mouse heart. (F) qPCR analysis of Hif1α and Zeb2 expression levels in mouse hearts collected at different time points after IR. (G–H) Pearson correlation between Hif1α and Zeb2 expression in (G) single cardiomyocytes isolated from injured mouse hearts and (H) human ischaemic hearts. (I and J) qPCR analysis of (I) Hif1α and (J) Zeb2 expression levels following Hif1α knock-down in NRCMs. (K) UCSC Genome Browser annotation of the 10 kb proximal promoter region of Zeb2 showing multiple conserved HREs. n (biological replicates) is indicated in the figures. Data are represented as mean ± SEM, *P < 0.05, **P < 0.01, and ***P < 0.001 compared to control (corresponding sham or normoxia) using one-way ANOVA followed by Dunnett’s multiple comparison test (F) or unpaired, two-tailed Student’s t-test (I and J). NRCMs, neonatal rat cardiomyocytes; HRE, hypoxia-responsive elements.
Figure 2
Figure 2
ZEB2 expression is induced in response to hypoxia. (A) Western blot analysis of ZEB2 and (B) the quantification in NRCMs subjected to normoxia and hypoxia for indicated time points. (C) Representative immunofluorescence staining of ZEB2 and ACTN2 in normoxic and hypoxic NRCMs. Insets show magnified regions. (D) qPCR expression analysis of Zeb2 at different developmental stages of mouse hearts. (E) Representative immunofluorescence staining of ZEB2 and ACTN2 in mouse hearts at different developmental time points and after ischaemic injury. n (biological replicates) is indicated in the figures. White arrows show ZEB2-positive cardiomyocytes. Data are represented as mean ± SEM, *P < 0.05, **P < 0.01, ***P < 0.001, and ****P < 0.0001 compared to control (normoxia or adult heart) using one-way ANOVA followed by Dunnett’s multiple comparison test (B and D).
Figure 3
Figure 3
Cardiomyocyte-specific ZEB2 overexpression protects from ischaemia-induced pathological hypertrophy and contractile dysfunction. (A) Study design. (B and C) qPCR analysis of (B) Zeb2 and (C) eGFP (Ct values) in the hearts from Zeb2 WT and Zeb2 cTg mice post sham or IR surgeries. (D) Representative immunofluorescence staining of ZEB2 and TNNT2 in the hearts from Zeb2 WT and Zeb2 cTg mice 14 days post-IR (dpIR). (E) Representative M-mode images of Zeb2 WT and Zeb2 cTg mice 14 dpIR. (F–H) Quantification of (F) ejection fraction (EF), (G) left ventricular volume in diastole (LV Vol-d), and (H) heart weight to tibia length (HW/TL) ratio in Zeb2 WT and Zeb2 cTg mice post-surgery. (I) WGA staining to show cardiomyocyte surface area and (J) its quantification. (K–Q) Western blot analysis of (K and N) the indicated proteins and (L, M, and O–Q) their quantification in Zeb2 WT and Zeb2 cTg mice 14 dpIR. n (biological replicates) is indicated in the figures. White arrows show ZEB2-positive cardiomyocytes. Data are represented as mean ± SEM, *P < 0.05, **P < 0.01, and ***P < 0.001 using one-way ANOVA followed by Sidak’s multiple comparison test (B, C, F, G, and H), compared to sham using one-way ANOVA followed by Dunnett’s multiple comparison test (J) or compared to Zeb2 WT using unpaired, two-tailed Student’s t-test (L, M, O, P, and Q).
Figure 4
Figure 4
RNA-seq analysis on the hearts from injured Zeb2 WT and Zeb2 cTg mice reveals altered expression of Ca2+-handling genes. (A) Principal component analysis (PCA) showing the distribution of RNA-seq data transcripts from Zeb2 WT and Zeb2 cTg mice 14 days post-IR (dpIR). (B) Gene ontology analysis showing enriched pathways of the top 200 upregulated genes on RNA-seq in Zeb2 cTg vs. Zeb2 WT mice 14 dpIR. (C) Multi-set Venn diagram illustrating pathway Gene Ontology analysis related to cardiomyocyte function of the top upregulated genes on RNA-seq in Zeb2 cTg vs. Zeb2 WT mice 14 dpIR. (D–I) qPCR analysis of the indicated genes representative of the different pathways in C in Zeb2 cTg vs. Zeb2 WT mice 14 days post sham or IR. n (biological replicates) is indicated in the figures. Data are represented as mean ± SEM, *P < 0.05, and **P < 0.01 compared to Zeb2 WT using Ordinary one-way ANOVA followed by Sidak’s multiple comparison test (D, E, F, G, H, I, and J).
Figure 5
Figure 5
ZEB2 overexpression improves Ca2+ handling in cardiomyocytes after injury. (A–C) Representative analysis of Ca2+ transients in cardiomyocytes isolated from Zeb2 WT and Zeb2 cTg mice 14 days post-IR (dpIR) exposed to a Ca2+-sensitive dye after different stimulation frequencies. (D–F) Quantification of relative Ca2+ transient amplitude. (G–I) Quantification of rise time, defined as the time from baseline to transient peak, and decay time, defined as the time from the transient peak back to baseline. (J) Quantification of decay time related to amplitude. n (biological replicates) is indicated in the figures. Data are represented as mean ± SEM, ***P < 0.001, and ****P < 0.0001 compared to Zeb2 WT using unpaired, two-tailed Student’s t-test (D, E, F, G, H, I, and J).
Figure 6
Figure 6
miR-208a inhibition increases ZEB2 levels and improves cardiac function post-injury. (A) Study design. (B–C) qPCR analysis of (B) miR-208a and (C) Zeb2 in WT mouse hearts treated with anti-control or anti-208a subjected to sham or IR surgeries. (D) Representative immunofluorescence staining of ZEB2 and ACTN2 in mouse hearts treated with anti-control or anti-208a 14 days post-IR (dpIR). (E) Representative M-mode images of hearts from mice treated with anti-control or anti-208a 14 dpIR. (F–H) Quantification of (F) ejection fraction (EF), (G) left ventricular internal diameter in systole (LVID-s), and (H) heart weight to tibia length (HW/TL) ratio in mice treated with anti-control or anti-208a. (I) WGA staining to show cardiomyocyte surface area and (J) its quantification. (K–Q) Western blot analysis of (K and N) the indicated proteins and (L, M, and OQ) their quantification in hearts from WT mice treated with anti-control or anti-208a 14 dpIR. (R) qPCR analysis of Adcy6 expression in anti-control or anti-208a-treated mice 14 days post-surgery. n (biological replicates) is indicated in the figures. White arrows show ZEB2-positive cardiomyocytes. Data are represented as mean ± SEM, *P < 0.05, **P < 0.01, and ***P < 0.001 using one-way ANOVA followed by Sidak’s multiple comparison test (B, C, F, G, H, and R), compared to sham using one-way ANOVA followed by Dunnett’s multiple comparison test (J) or compared to anti-208a-treated IR group using unpaired, two-tailed Student’s t-test (L, M, O, P, Q, S, and T).
Figure 7
Figure 7
Model depicting the function of ZEB2 in the ischaemic heart. Upon cardiac ischaemia, ZEB2 is transcriptionally regulated by HIF1α and post-transcriptionally by miR-208a, resulting in transcriptional activation of Adcy6, which will trigger cardioprotective signalling by improving Ca2+ homeostasis, preventing cardiomyocyte hypertrophy and enhancing cardiac contractility.

References

    1. Virani SS, Alonso A, Benjamin EJ, Bittencourt MS, Callaway CW, Carson AP, Chamberlain AM, Chang AR, Cheng S, Delling FN, Djousse L, Elkind MSV, Ferguson JF, Fornage M, Khan SS, Kissela BM, Knutson KL, Kwan TW, Lackland DT, Lewis TT, Lichtman JH, Longenecker CT, Loop MS, Lutsey PL, Martin SS, Matsushita K, Moran AE, Mussolino ME, Perak AM, Rosamond WD, Roth GA, Sampson UKA, Satou GM, Schroeder EB, Shah SH, Shay CM, Spartano NL, Stokes A, Tirschwell DL, VanWagner LB, Tsao CW, American Heart Association Council on E, Prevention Statistics C, Stroke Statistics S . Heart Disease and Stroke Statistics-2020 Update: a report from the American Heart Association. Circulation 2020;141:e139–e596. - PubMed
    1. Sanchis-Gomar F, Perez-Quilis C, Leischik R, Lucia A. Epidemiology of coronary heart disease and acute coronary syndrome. Ann Transl Med 2016;4:256. - PMC - PubMed
    1. Nowbar AN, Gitto M, Howard JP, Francis DP, Al-Lamee R. Mortality from ischemic heart disease. Circ Cardiovasc Qual Outcomes 2019;12:e005375. - PMC - PubMed
    1. Minicucci MF, Azevedo PS, Polegato BF, Paiva SA, Zornoff LA. Heart failure after myocardial infarction: clinical implications and treatment. Clin Cardiol 2011;34:410–414. - PMC - PubMed
    1. Talman V, Ruskoaho H. Cardiac fibrosis in myocardial infarction-from repair and remodeling to regeneration. Cell Tissue Res 2016;365:563–581. - PMC - PubMed

Publication types

MeSH terms

Associated data