. 2024 Dec 4;120(15):1967-1984.
doi: 10.1093/cvr/cvae160.

A non-genetic model of vascular shunts informs on the cellular mechanisms of formation and resolution of arteriovenous malformations

Affiliations

A non-genetic model of vascular shunts informs on the cellular mechanisms of formation and resolution of arteriovenous malformations

Marie Ouarné et al. Cardiovasc Res. .

Abstract

Aims: Arteriovenous malformations (AVMs), a disorder characterized by direct shunts between arteries and veins, are associated with genetic mutations. However, the mechanisms leading to AV shunt formation and how shunts can be reverted are poorly understood.

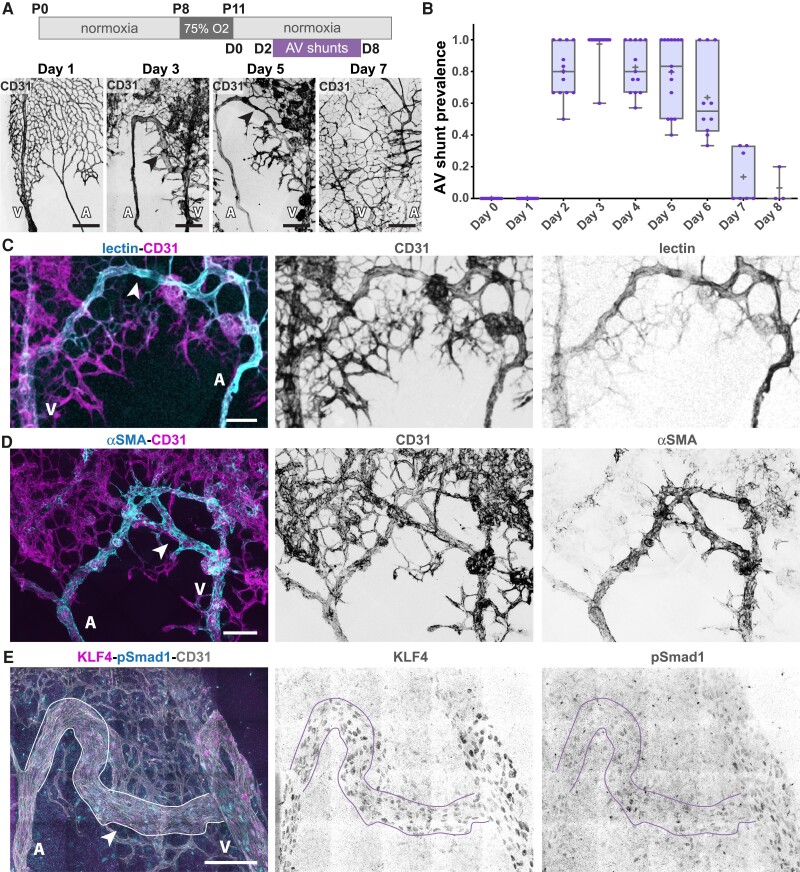
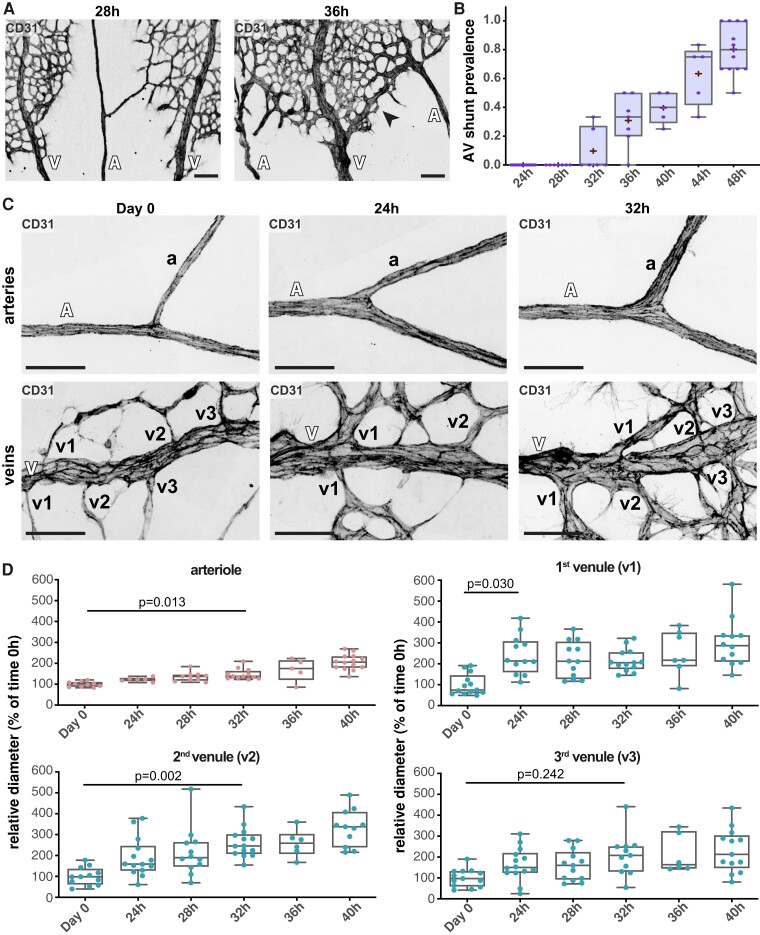
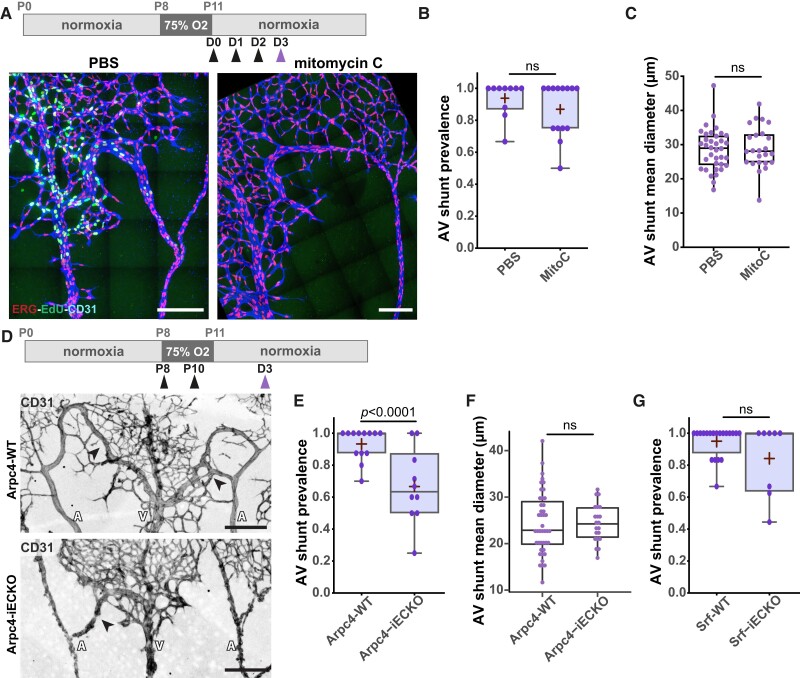
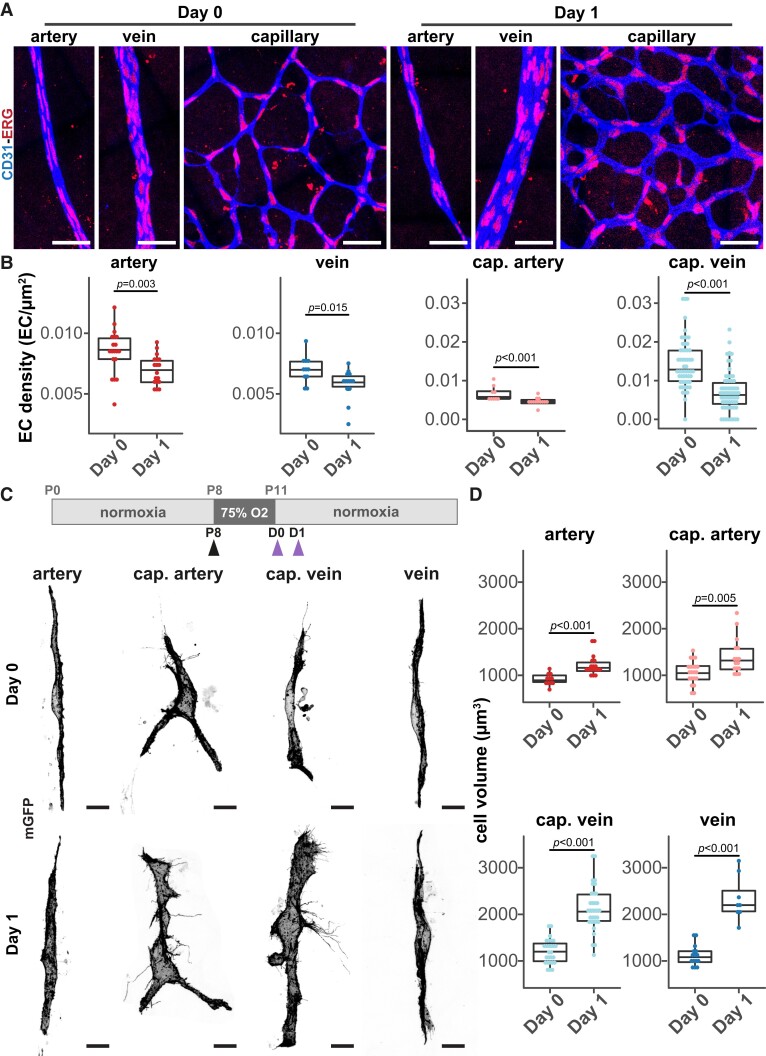
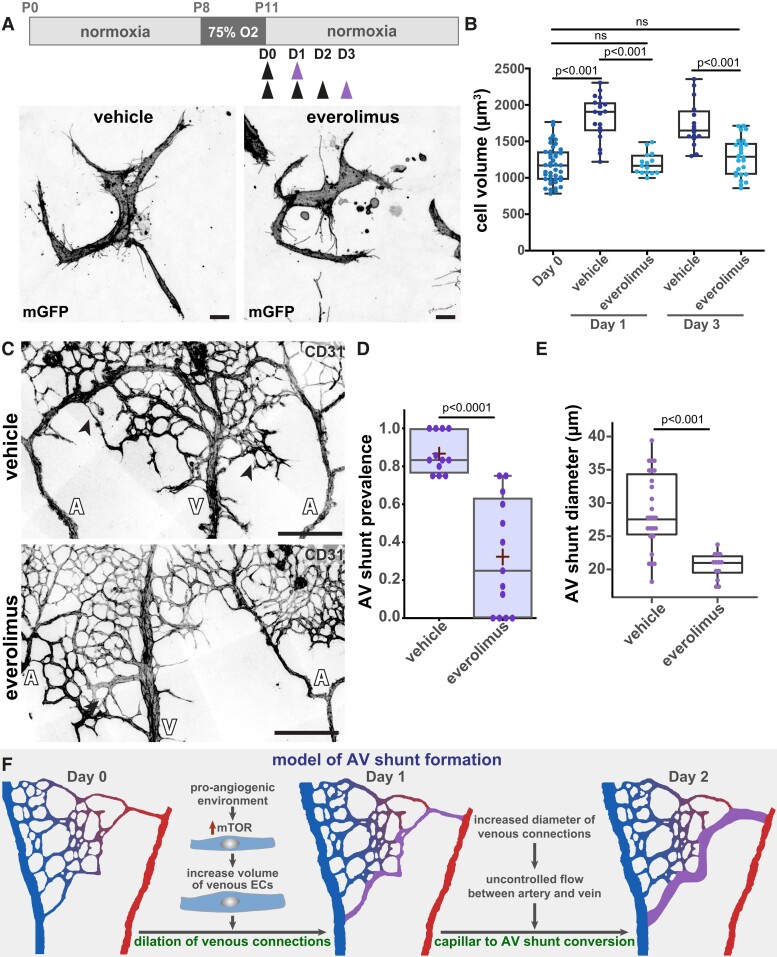
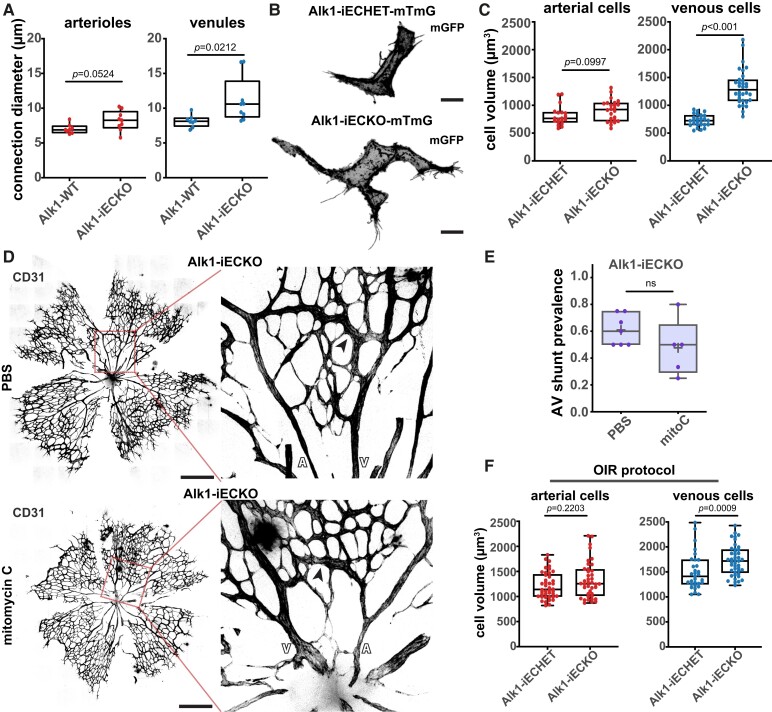
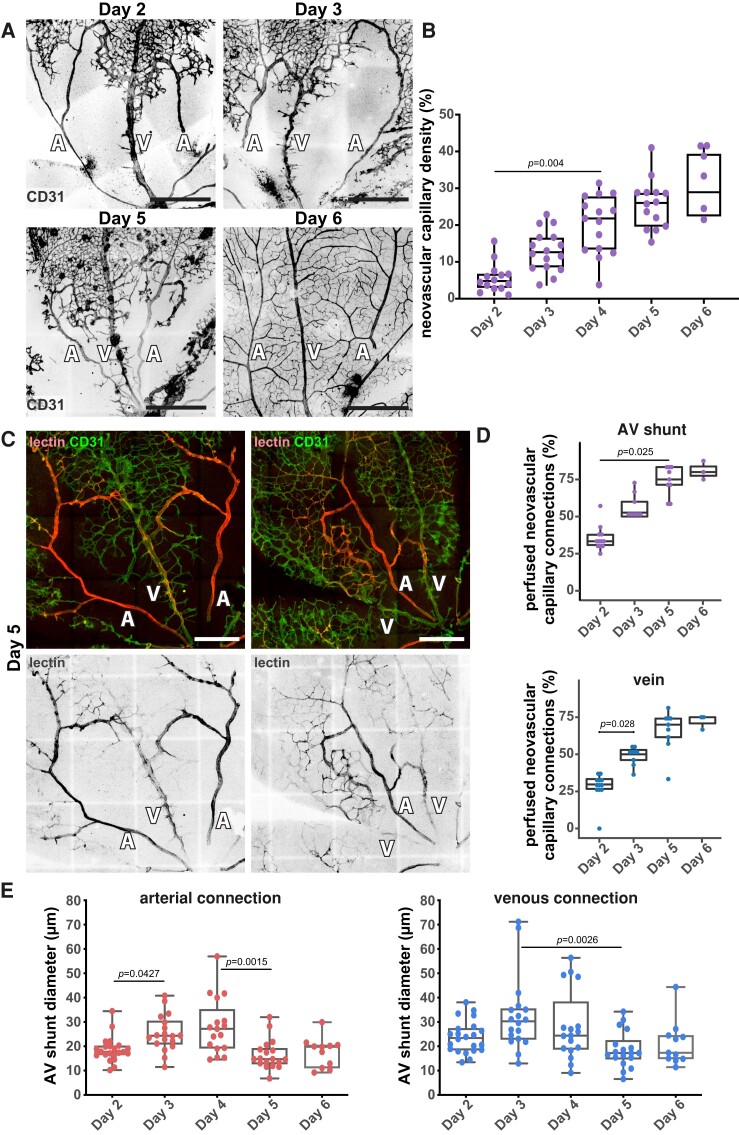
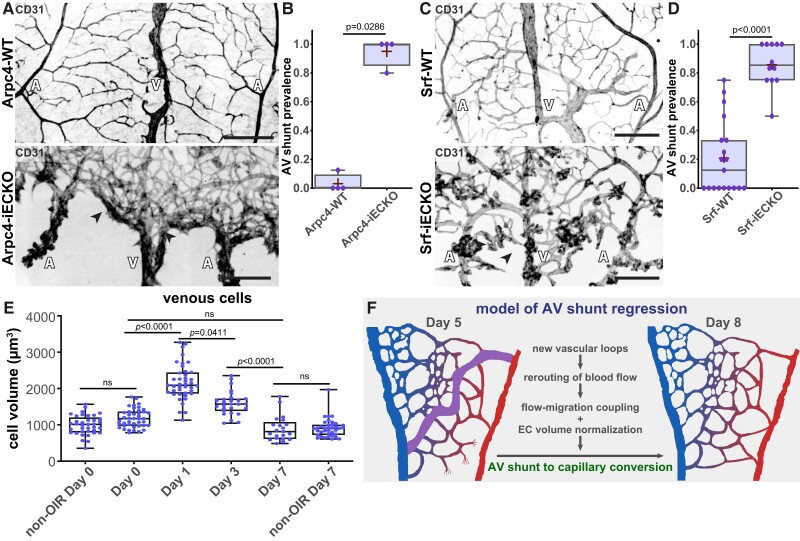
Methods and results: Here, we report that oxygen-induced retinopathy (OIR) protocol leads to the consistent and stereotypical formation of AV shunts in non-genetically altered mice. OIR-induced AV shunts show all the canonical markers of AVMs. Genetic and pharmacological interventions demonstrated that changes in the volume of venous endothelial cells (EC)-hypertrophic venous cells-are the initiating step promoting AV shunt formation, whilst EC proliferation or migration played minor roles. Inhibition of the mTOR pathway prevents pathological increases in EC volume and significantly reduces the formation of AV shunts. Importantly, we demonstrate that ALK1 signalling cell-autonomously regulates EC volume in pro-angiogenic conditions, establishing a link with hereditary haemorrhagic telangiectasia-related AVMs. Finally, we demonstrate that a combination of EC volume control and EC migration is associated with the regression of AV shunts.

Conclusion: Our findings highlight that an increase in the EC volume is the key mechanism driving the initial stages of AV shunt formation, leading to asymmetric capillary diameters. Based on our results, we propose a coherent and unifying timeline leading to the fast conversion of a capillary vessel into an AV shunt. Our data advocate for further investigation into the mechanisms regulating EC volume in health and disease as a way to identify therapeutic approaches to prevent and revert AVMs.

Keywords: Angiogenesis; Arteriovenous malformations; Cell volume; Oxygen-induced retinopathy.


Conflict of interest statement

Conflict of interest: none declared.

Figures

Figure 1
Figure 1
OIR protocol forms transient AV shunts independent of genetic alterations. (A) Top panel: schematic of the experimental protocol. Bottom panel: representative images of mouse retinas stained for CD31 (grey) on Day 1, Day 3, Day 5, and Day 7. Black arrows: AV shunt; A, artery; V, vein. Scale bar: 200 µm. (B) Quantification of AV shunt prevalence between Day 0 and Day 8. Day 0, 51 AV sections (8 pups); Day 1, 44 AV sections (8 pups); Day 2, 56 AV sections (8 pups); Day 3, 66 AV sections (8 pups); Day 4, 55 AV sections (7 pups); Day 5, 50 AV sections (7 pups); Day 6, 41 AV sections (6 pups); Day 7, 30 AV sections (4 pups); Day 8, 11 AV sections (3 pups). Each dot represents a mouse retina. (C) Representative image of an AV shunt at Day 3 highlighting its perfusion status (lectin, cyan) and co-stained for ECs (CD31, magenta). Arrowhead: AV shunt; A, artery; V, vein. Scale bar: 100 µm. (D) Representative image of smooth muscle coverage (αSMA, cyan) of an AV shunt at Day 4 co-stained for ECs (CD31, magenta). Arrowhead: AV shunt; A, artery; V, vein. Scale bar: 100 µm. (E) Representative image of an AV shunt at Day 3 stained for ECs (CD31, grey), pSmad1 (cyan), and KLF4 (magenta). Arrowhead: AV shunt; A, artery; V, vein. Scale bar: 100 µm.
Figure 2
Figure 2
Fine time-course analysis of AV shunt formation. (A) Representative images of mouse retinas at 28 and 36 h stained for CD31 (grey). Black arrow: AV shunt; A, artery; V, vein. Scale bar: 200 µm. (B) Quantification of total AV shunt prevalence every 4 h between 24 and 48 h. 24 h, 44 AV sections (8 pups); 28 h, 31 AV sections (7 pups); 32 h, 29 AV sections (5 pups); 36 h, 34 AV sections (5 pups); 40 h, 23 AV sections (3 pups); 44 h, 23 AV sections (3 pups); 48 h, 56 AV sections (8 pups). Each dot represents a mouse retina. P-values from Fisher’s exact t-test and Fisher’s post hoc test using Benjamini–Hochberg correction for multiple comparisons. (C) Representative images of OIR arterial (top) and venous (bottom) mouse retina vessels (A, artery; a, arteriole; V, vein; v, venule) at 0, 24, and 32 h stained for CD31 (grey). Scale bar: 50 µm. (D) Quantification of arteriole and first (v1), second (v2,) and third (v3) venule normalized diameter (% of mean diameter at Day 0) between 0 and 40 h. Each dot represents a second-order vessel from Day 0 (3 pups); 24 h (3 pups); 28 h (3 pups); 32 h (3 pups); 36 h (3 pups); and 40 h (3 pups). Each dot represents a mouse retina. P-values from Kruskal–Wallis test and Dunn’s post hoc test using Benjamini–Hochberg correction for multiple comparisons.
Figure 3
Figure 3
EC proliferation and migration have minor contributions to AV shunt formation. (A) Top panel: schematic of mitomycin C treatment. Black arrow: time of vehicle or mitomycin C injection. Purple arrow: time of collection. Bottom panel: representative images of retinas at Day 3 treated with PBS or mitomycin C stained for ECs (CD31, blue), EC nuclei (ERG, red), and proliferative cells (EdU, green). White arrows: AV shunts; A, artery; V, vein. Scale bar: 200 µm. (B) Quantification of AV shunt prevalence at Day 3 in PBS- (33 AV sections, 5 pups) and mitomycin C (46 AV sections, 7 pups)-treated retinas. Each dot represents a mouse retina. P-value from Mann–Whitney U test. (C) Quantification of AV shunt mean diameter at Day 3 in PBS- (21 AV sections, 3 pups) and mitomycin C (14 AV sections, 3 pups)-treated retinas. Each dot represents a mouse retina. P-value from Mann–Whitney U test. (D) Top panel: schematic of the experimental protocol using Arpc4/Srf mouse strains. Black arrow: tamoxifen injection. Purple arrow: time of collection. Representative images of Arpc4-WT and Arpc4-iECKO retinas on Day 3 stained for ECs (CD31, grey). Black arrows: AV shunts; A, artery; V, vein. Scale bar: 200 µm. (E) Quantification of AV shunt prevalence at Day 3 in Arpc4-WT (91 AV sections, 7 pups) and Arpc4-iECKO (57 AV sections, 5 pups) retinas. Each dot represents a mouse retina. P-value from Mann–Whitney U test. (F) Quantification of AV shunt mean diameter at Day 3 in Arpc4-WT (7 pups) and Arpc4-iECKO (5 pups) retinas. Each dot represents an AV shunt. Each dot represents a mouse retina. P-value from Mann–Whitney U test. (G) Quantification of AV shunt prevalence at Day 3 in Srf-WT (85 AV sections, 12 pups) and Srf-iECKO (45 AV sections, 5 pups) retinas. Each dot represents a mouse retina. P-value from Mann–Whitney U test.
Figure 4
Figure 4
EC volume and venule diameter increases precede AV shunt development. (A) Representative images of EC nuclei (ERG, red) distribution within artery, vein, and capillary at Day 0 and Day 1 (CD31, blue). Scale bar: 50 µm. (B) Quantification of EC density in arteries, veins, arterial capillaries, and venous capillaries at Day 0 and Day 1. Each dot represents a vessel on Day 0 (4 pups) and Day 1 (5 pups). P-value from Mann–Whitney U test. (C) Top panel: schematic of experimental protocol for mosaic expression of mGFP in ECs. Black arrow: tamoxifen injection. Purple arrows: time of collection. Bottom panel: representative images of single ECs (mGFP, grey) in the artery, arterial capillary, venous capillary, and vein from mouse retinas at Day 0 and Day 1. Scale bar: 10 µm. (D) Quantification of EC volume in single cells in arteries, arterial capillaries, venous capillaries, and veins from mouse retinas at Day 0 and Day 1. Each dot represents an EC from Day 0 (11 artery, 21 cap. artery, 15 vein, and 25 cap. vein cells, 3 pups) and Day 1 (18 artery, 16 cap. artery, 8 vein, and 33 cap. vein cells, 3 pups). P-value from Mann–Whitney U test.
Figure 5
Figure 5
mTOR inhibition prevents EC volume increase and AV shunt formation. (A) Top panel: schematic of AV shunt study protocol with everolimus treatment. Black arrows: times of vehicle or everolimus injections. Purple arrow: time of collection. Bottom panel: representative images of single venous ECs (mGFP, grey) of retinas at Day 3 treated with vehicle or everolimus. Scale bar: 10 µm. (B) Quantification of EC volume in venous cells (veins and venous capillaries) at Day 0, Day 1, and Day 3 mouse retinas treated with vehicle or everolimus. Each dot represents one EC from Day 0 (42 cells, 3 pups), Day 1 (19 cells for vehicle and 15 cells for everolimus, 3 pups), and Day 3 (16 cells for vehicle and 26 cells for everolimus, 3 pups). P-value from Kruskal–Wallis test with Dunn’s correction for multiple comparisons. (C) Representative images of retinas at Day 3 treated with vehicle or everolimus stained for ECs (CD31, grey). Black arrows: AV shunts; A, artery; V, vein. Scale bar: 200 µm. (D) Quantification of AV shunt prevalence at Day 3 in vehicle- (43 AV sections, 4 pups) and everolimus (54 AV sections, 5 pups)-treated retinas. P-value from Mann–Whitney U test. (E) Quantification of AV shunt mean diameter at Day 3 in vehicle- (4 pups) and everolimus (5 pups)-treated retinas. Each dot represents an AV shunt. P-value from Mann–Whitney U test. (F) Model describing AV shunt formation in OIR protocol.
Figure 6
Figure 6
Alk1 signalling controls EC volume cell-autonomously. (A) Quantification of arteriole and venule diameter in Alk1-WT (19 arterial and 24 venous cells, 4 pups) and Alk1-iECKO (24 arterial and 32 venous cells,4 pups) retinas 72 h post-tamoxifen injection. Each dot represents a second-order vessel. P-value from Mann–Whitney U test. (B) Representative images of ECs from a venous capillary EC (GFP, grey) of Alk1.iECHET-mTmG and Alk1-iECKO-mTmG 24 h post-tamoxifen injection. Scale bar: 10 µm. (C) Quantification of EC volume in arterial (arteries and arterial capillaries) and venous (vein and venous capillaries) vessels from Alk1.iECHET-mTmG and Alk1-iECKO-mTmG 72 h post-tamoxifen injection. Each dot represents one EC from Alk1.iECHET-mTmG (3 pups) and Alk1-iECKO-mTmG (3 pups). P-value from Mann–Whitney test. (D) Representative images (left, overview; right, higher magnification of the AV shunt) from Alk1-iECKO late P5 retinas treated with PBS or mitomycin C stained for ECs (CD31, grey). Black arrows: AV shunts; A:, artery; V, vein. Scale bar: 500 µm. (E) Quantification of AV shunt prevalence at Day 3 in Alk1-iECKO late P5 retinas treated with PBS (52 AV sections, 7 pups) or mitomycin (34 AV section, 5 pups). Each dot represents a mouse retina. P-value from Mann–Whitney U test. (F) Quantification of EC volume in arterial (arteries and arterial capillaries) and venous (vein and venous capillaries) vessels from Alk1.iECHET-mTmG and Alk1-iECKO-mTmG at Day 2. Each dot represents one EC from Alk1.iECHET-mTmG (42 arterial and 31 venous cells, 4 pups) and Alk1-iECKO-mTmG (40 arterial and 43 venous cells, 4 pups).
Figure 7
Figure 7
AV shunt regression associates with perfusion of the neo-capillaries. (A) Representative images of mouse retinas stained for CD31 (grey) at Day 2, Day 3, Day 5, and Day 6. A, artery; V: vein. Scale bar: 500 µm. (B) Quantification of neovascular capillary density between Day 2 and Day 6. Each dot represents an AV shunt proximal region from Day 2 (4 pups); Day 3 (3 pups); Day 4 (3 pups); Day 5 (4 pups); and Day 6 (3 pups). P-values from Kruskal–Wallis test and Dunn’s post hoc test using Benjamini–Hochberg correction for multiple comparisons. (C) Representative images of Day 5 mouse retinas perfused with lectin (red) and co-stained for ECs (CD31, green). A, artery; V, vein. Scale bar: 250 µm. (D) Quantification of perfused neovascular capillary connections to AV shunt (top) and associated vein (bottom) between Day 2 and Day 6. Each dot represents an AV shunt or a vein from Day 2 (6 retinas); Day 3 (4 retinas); Day 5 (5 retinas); and Day 6 (3 retinas). P-values from Kruskal–Wallis test with Dunn’s correction for multiple comparisons. (E) Quantification of AV shunt diameter on the first 50 µm connected to the corresponding artery (left) or vein (right) between Day 2 and Day 6 mouse retinas. Each dot represents an AV shunt from Day 2 (4 pups); Day 3 (3 pups); Day 4 (3 pups); Day 5 (4 pups); and Day 6 (3 pups). P-values from Kruskal–Wallis test and Dunn’s post hoc test using Benjamini–Hochberg correction for multiple comparisons.
Figure 8
Figure 8
Inhibition of neovascular capillaries prevents AV shunt regression. (A) Representative images of Arpc4-WT (top) and Arpc4-iECKO (bottom) retinas at Day 7 stained for vascular network (CD31, grey). Black arrows: AV shunts; A, artery; V, vein. Scale bar: 200 µm. (B) Quantification of AV shunt prevalence at Day 7 in Arpc4-WT (29 AV sections) and Arpc4-iECKO (16 AV sections) retinas. Each dot represents a mouse retina. P-value from Mann–Whitney test. (C) Representative images of Srf-WT (top) and Srf-iECKO (bottom) retinas at Day 9 stained for vascular network (CD31, grey). Black arrows: AV shunts; A, artery; V, vein. Scale bar: 200 µm. (D) Quantification of AV shunt prevalence at Day 9 in Srf-WT (86 AV sections) and Srf-iECKO (63 AV sections) retinas. Each dot represents a mouse retina. P-value from Mann–Whitney test. (E) Quantification of venous (vein and venous capillaries) EC volume at Day 0, Day 1, Day 3, and Day 7 and of non-OIR mouse retinas corresponding to time points Day 0 (P11) and Day 7 (P18). Each dot represents one EC from Day 0 (42 cells, 3 pups); Day 1 (41 cells, 3 pups); Day 3 (27 cells, 3 pups); Day 7 (21 cells, 5 pups); non-OIR Day 0 (37 cells, 5 pups); and non-OIR Day 7 (37 cells, 5 pups). P-values from Kruskal–Wallis test with Dunn’s correction for multiple comparisons. (F) Model describing AV shunt regression in OIR protocol.

References

    1. Alaraj A, Shakur SF, Amin-Hanjani S, Mostafa H, Khan S, Aletich VA, Charbel FT. Changes in wall shear stress of cerebral arteriovenous malformation feeder arteries after embolization and surgery. Stroke 2015;46:1216–1220. - PubMed
    1. Steiger HJ. Recent progress understanding pathophysiology and genesis of brain AVM-a narrative review. Neurosurg Rev 2021;44:3165–3175. - PMC - PubMed
    1. Couto JA, Huang AY, Konczyk DJ, Goss JA, Fishman SJ, Mulliken JB, Warman ML, Greene AK. Somatic MAP2K1 mutations are associated with extracranial arteriovenous malformation. Am J Hum Genet 2017;100:546–554. - PMC - PubMed
    1. Nikolaev SI, Vetiska S, Bonilla X, Boudreau E, Jauhiainen S, Rezai Jahromi B, Khyzha N, DiStefano PV, Suutarinen S, Kiehl TR, Mendes Pereira V, Herman AM, Krings T, Andrade-Barazarte H, Tung T, Valiante T, Zadeh G, Tymianski M, Rauramaa T, Ylä-Herttuala S, Wythe JD, Antonarakis SE, Frösen J, Fish JE, Radovanovic I. Somatic activating KRAS mutations in arteriovenous malformations of the brain. N Engl J Med 2018;378:250–261. - PMC - PubMed
    1. Dupuis-Girod S, Bailly S, Plauchu H. Hereditary hemorrhagic telangiectasia: from molecular biology to patient care. J Thromb Haemost 2010;8:1447–1456. - PubMed

Publication types

MeSH terms